5045
Dynamic Monitoring of Brown Adipose Tissue Activation and White Adipose Tissue Beiging1Physics and Astronomy, University of Georgia, Athens, GA, United States, 2Bio-Imaging Research Center, University of Georgia, Athens, GA, United States, 3Biochemistry and Molecular Biology, University of Georgia, Athens, GA, United States
Synopsis
The treatment of obesity is clinically significant as it is related to many serious heart diseases and diabetes. Therefore, it is very advantageous to be able to non-invasively monitor whether or not a treatment is effective. Presented here is a method using magnetic resonance imaging (MRI) based water-fat separation, quantitative susceptibility mapping (QSM), and transverse relaxation rate ($$$R_{2}^{*}$$$) to dynamically monitor brown adipose tissue (BAT) activation and the white adipose tissue (WAT) beiging process. In a mouse model, increases in susceptibility between 40-164% and increases in $$$R_{2}^{*}$$$ between 32-71% were observed in intracapsular BAT and inguinal WAT indicating metabolic changes related to BAT activation and WAT beiging.
Purpose
To monitor dynamic changes in magnetic susceptibility and the transverse relaxation rate ($$$R_{2}^{*}$$$) in adipose tissue during brown adipose tissue (BAT) activation and white adipose tissue (WAT) beiging using magnetic resonance imaging (MRI).Methods
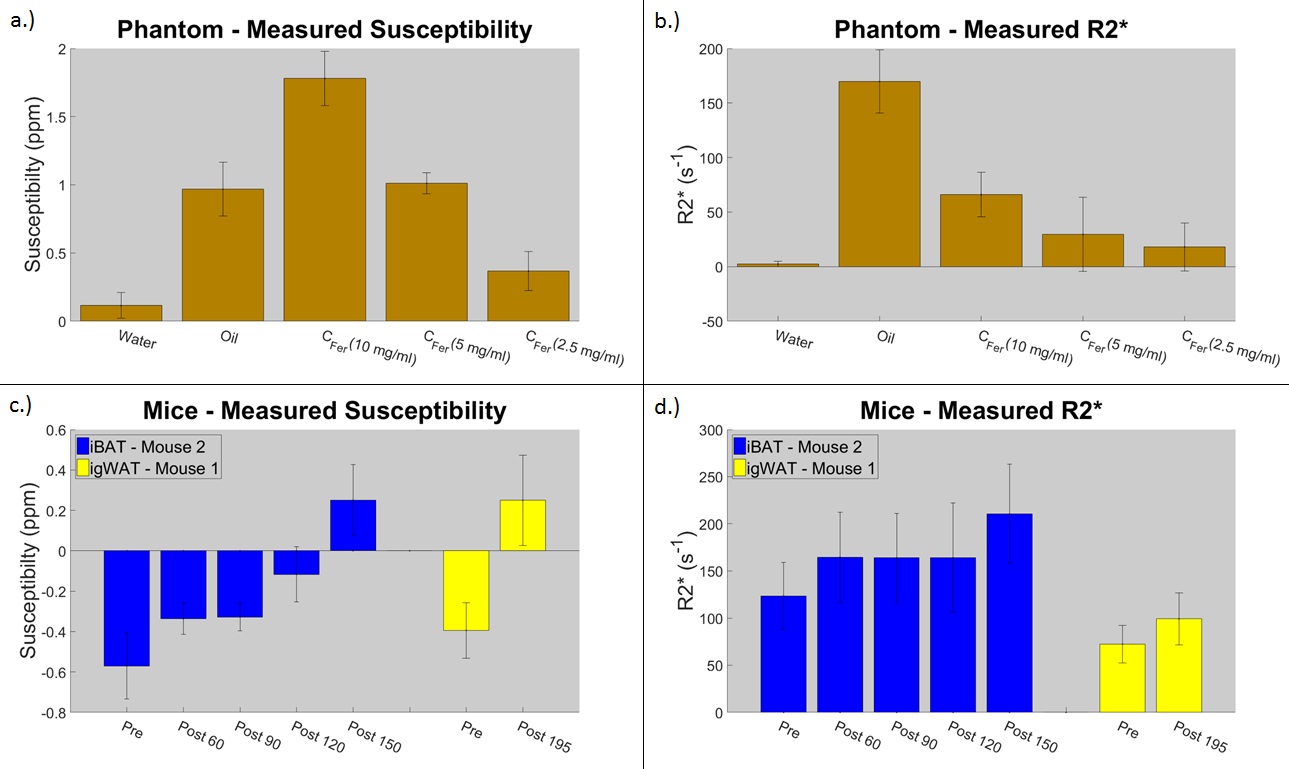
To confirm the accuracy of the proposed estimation methods, phantom experiments were first conducted containing vials of tap water, vegetable oil, and horse spleen ferritin (an iron-based protein) (Ref. F4503, Sigma-Aldrich) solutions diluted with distilled water to concentrations ($$$C_{Fer}$$$) of 10, 5, and 2.5 mg/ml. In vivo experiments were then performed using two C57/BL6 mice on both the intracapsular brown adipose tissue (iBAT) and inguinal white adipose tissue (igWAT). MR data was acquired pre- and post-injection (on the iBAT at 60, 90, 120, and 150 minutes and on the igWAT at 195 minutes) of CL316,243 (1 mg/kg), which is known to cause BAT activation and WAT beiging.1,2 Both phantom and in vivo mouse experiments were performed using a 7T Varian Magnex MRI Scanner with Multi-echo 3D gradient-recalled echo sequences.
Water/Fat separation was performed to confirm adipose tissue locations using a 3D graphcut algorithm with a fixed multi-fat peak model that accounted for local frequency shifts due to static field inhomogeneities and $$$R_{2}^{*}$$$ effects.3 To estimate susceptibility and $$$R_{2}^{*}$$$, initially, the field map ($$$f_{B}$$$ map) was estimated using variable projection (VARPRO)4 and spatial regularization by minimizing:
$$R_{f_{B}}=\sum_{q=1}^{Q}R_{f_{B,o}}+\mu\sum_{q=1}^{Q}\sum_{j\epsilon\delta_{q }}w_{q,j}(f_{B,q}-f_{B,j})^2$$
where Q is the number of voxels, µ is a smoothness parameter, w is a spatial weight parameter, δq is the local neighborhood of voxel q, and
$$R_{f_{B,o}}=\left\|[\mathbf{I}-\mathbf{\psi}(f_{B,q})\mathbf{\psi^{+}}(f_{B,q})]\mathbf{s_{q}}\right\|^2$$
where I is the identity matrix, ψ is an N (number of echoes) by M (number of fat peaks) matrix with $$$\mathbf{\psi_{(n,1)}}=e^{i2\pi f_{B}t_{n}}$$$ and $$$\mathbf{\psi_{(n,1)}}=e^{i2\pi (f_{B}+f_{F,m})t_{n}}$$$ with fF representing the water-fat frequency shift, and s is the MR signal.3 The field map was then converted into a change in phase map and used to perform quantitative susceptibility mapping (QSM). Regularization enabled sophisticated harmonic artifact reduction for phase data (RESHARP)5 was used to remove the background field and total variation using split Bregman (TVSB)6 was used to solve the ill-posed inverse problem.
The $$$R_{2}^{*}$$$ map was also estimated using VARPRO by minimizing
$$R_{R_{2}^{*}}=\left\|[\mathbf{I}-\mathbf{\psi}(R_{2,q}^{*})\mathbf{\psi^{+}}(R_{2,q}^{*})]\mathbf{s_{q-f_{B}}}\right\|^2$$
where $$$\mathbf{\psi}=e^{-R_{2}^{*}t_{n}}$$$, $$$\mathbf{\psi}=e^{R_{2}^{*}t_{n}}$$$, and $$$s_{q-f_{B}}$$$ is the signal with the already estimated field map component removed.3 A 3D Gaussian filter was then applied to the $$$R_{2}^{*}$$$ maps to impose spatial smoothness.
Measurements of susceptibility and $$$R_{2}^{*}$$$ were made across multiple axial slices within each vial of the phantoms and within the iBAT and igWAT of the mice at each time point.
Results
In the phantom experiment, the measured susceptibilities for all samples are comparable to previously published results7,8; it is also shown that water has a very low $$$R_{2}^{*}$$$, vegetable oil has a comparably high $$$R_{2}^{*}$$$ due to large fat content, and higher ferritin concentrations have higher $$$R_{2}^{*}$$$ values than lower concentrations (see Figure 1a and 1b).
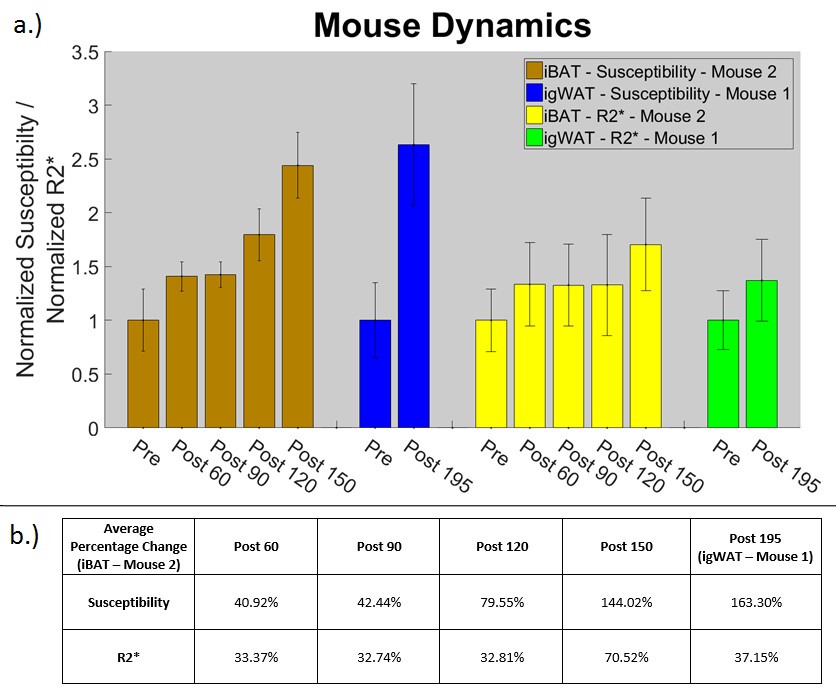
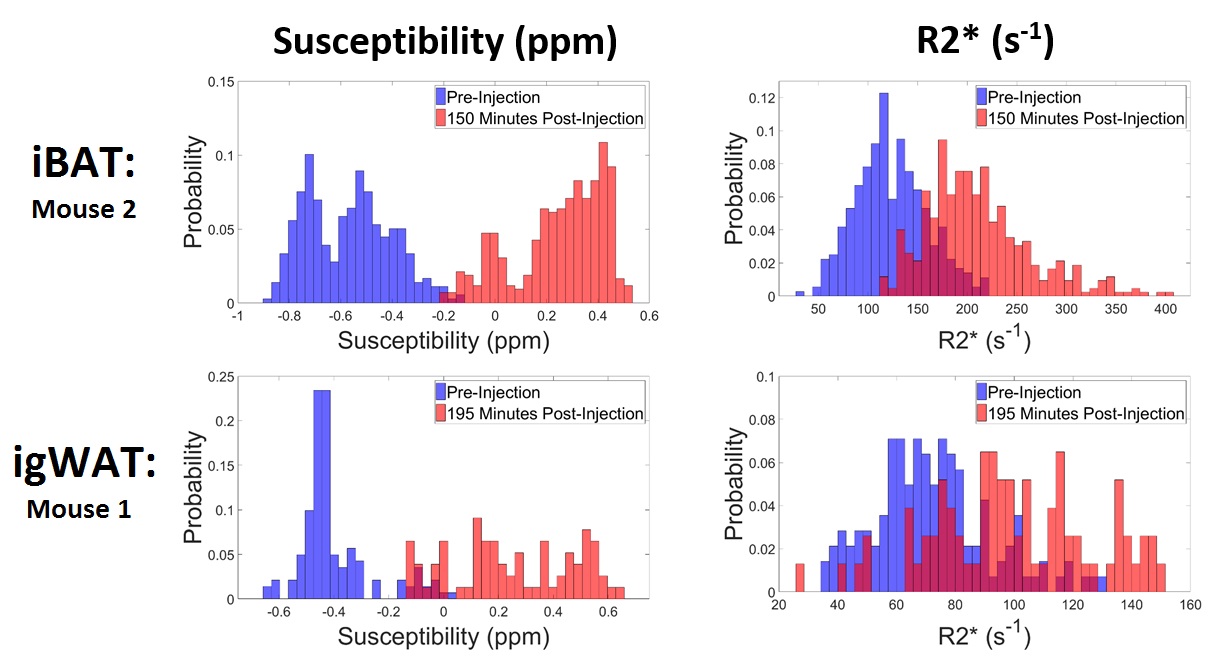
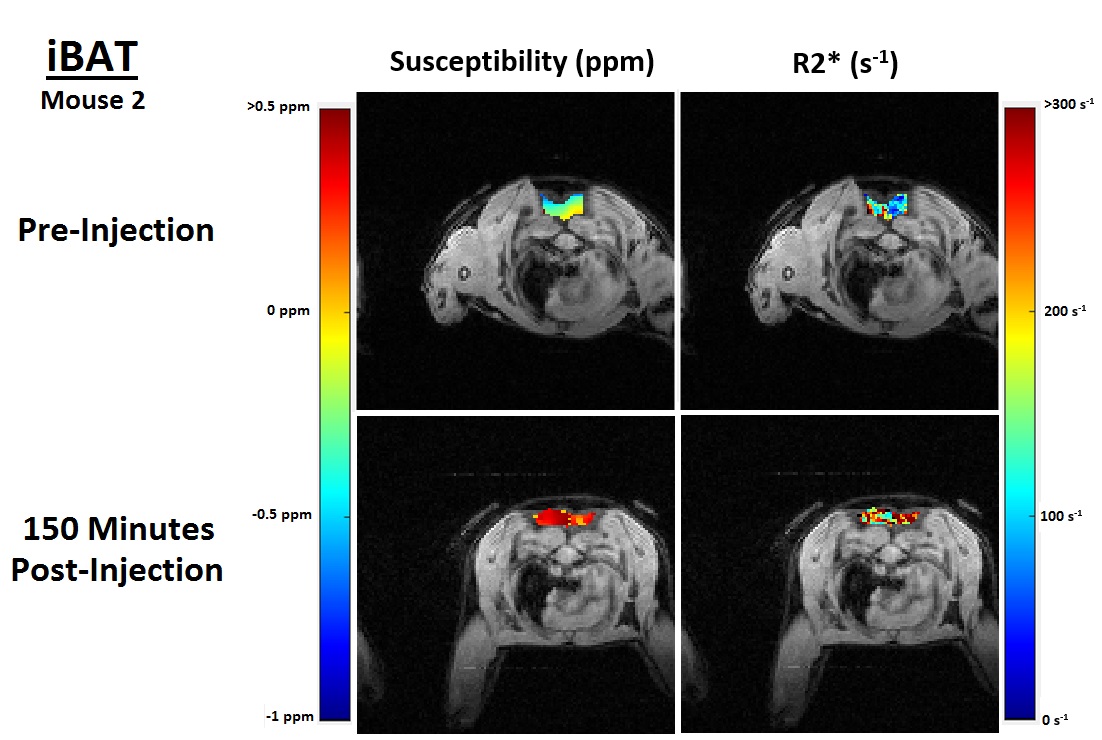
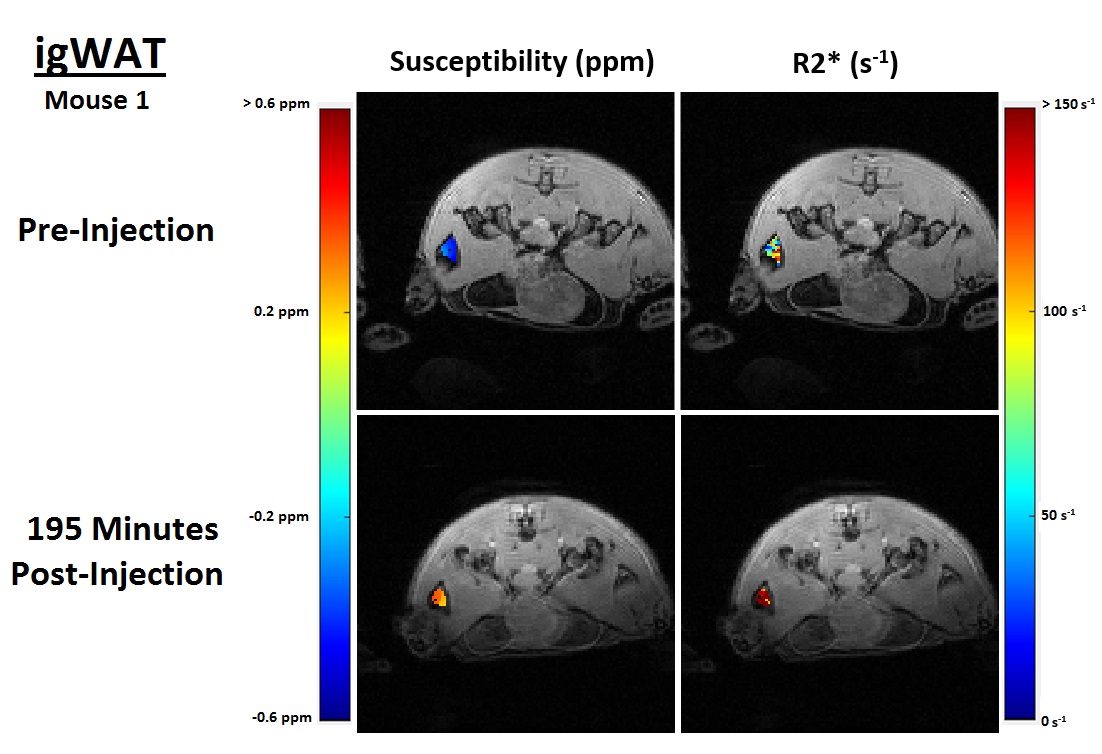
In both the iBAT and igWAT of the mice, increases in susceptibility and $$$R_{2}^{*}$$$ are seen over time (see Figure 1c and 1d). Results for iBAT of Mouse 1 are not presented due to highly noisy pre-injection data, and data was not collected for igWAT of Mouse 2 due to time constraints. To better show the observed increases, all measurements were normalized to their corresponding pre-injection measurement, and average percentage changes were calculated. Results showed that increases in susceptibility between 40-164% and increases in $$$R_{2}^{*}$$$ between 32-71% were observed in iBAT and igWAT (see Figure 2). Distributions of the measurements were also examined to determine if there was a complete shift in the measured values post-injection or if a skewed distribution occurred. Figure 3 shows that there is a complete shift from lower values to higher values for both susceptibility and $$$R_{2}^{*}$$$ in both the iBAT and igWAT. Figures 4 and 5 also show this shift by comparing measurements within similar anatomies.
Discussion and Conclusion
Lipocyte activation causes increased ferritin levels9, blood flow, and oxygen consumption10 to adipose tissue. The observed increases in susceptibility and $$$R_{2}^{*}$$$ in the iBAT and igWAT due to the CL316,243 injection are consistent with these effects suggesting BAT activation and WAT beiging are occurring. Dynamically monitoring BAT activation and WAT beiging using susceptibility and $$$R_{2}^{*}$$$ may provide a useful method in evaluating the effectiveness of various obesity related treatments. BAT and WAT susceptibilities have previously been quantified ex vivo using NMR11,12 and MRI susceptometry14, and recent studies have quantified liver susceptibility in vivo,15 which is high in fat content. However, this work is believed to contain the first in vivo BAT and WAT susceptibility measurements using QSM.Acknowledgements
Dr. Diego Hernando of the University of Wisconsin for providing the 3D graphcut algorithm and the Cornell MRI Research lab for providing the QSM algorithm.References
1. Engles, James, et al. "BAT activation in diabetic rats undergoing treatment with CL316, 243 and cold exposure." Journal of Nuclear Medicine53.supplement 1 (2012): 1586-1586.
2. Zheng, Zongji, et al. "Regulation of UCP1 in the browning of epididymal adipose tissue by β3 adrenergic agonist: a role for microRNAs." International journal of endocrinology 2014 (2014).
3. Hernando, Diego, et al. "Robust water/fat separation in the presence of large field inhomogeneities using a graph cut algorithm." Magnetic resonance in medicine 63.1 (2010): 79-90.
4. Hernando, Diego, et al. "Joint estimation of water/fat images and field inhomogeneity map." Magnetic resonance in medicine 59.3 (2008): 571-580.
5. Sun, Hongfu, and Alan H. Wilman. "Background field removal using spherical mean value filtering and Tikhonov regularization." Magnetic resonance in medicine 71.3 (2014): 1151-1157.
6. Bilgic, Berkin, et al. "Fast quantitative susceptibility mapping with L1-regularization and automatic parameter selection." Magnetic resonance in medicine 72.5 (2014): 1444-1459.
7. de Rochefort, Ludovic, et al. "Quantitative MR susceptibility mapping using piece-wise constant regularized inversion of the magnetic field." Magnetic Resonance in Medicine 60.4 (2008): 1003-1009.
8. Xie, He, et al. "A quantitative study of susceptibility and additional frequency shift of three common materials in MRI." Magnetic resonance in medicine (2015).
9. Ramm, Grant A., et al. "Identification and characterization of a receptor for tissue ferritin on activated rat lipocytes." Journal of Clinical Investigation94.1 (1994): 9.
10. Muzik, Otto, et al. "15O PET measurement of blood flow and oxygen consumption in cold-activated human brown fat." Journal of Nuclear Medicine 54.4 (2013): 523-531.
11.Hopkins, Jeffrey A., and Felix W. Wehrli. "Magnetic susceptibility measurement of insoluble solids by NMR: Magnetic susceptibility of bone." Magnetic resonance in medicine 37.4 (1997): 494-500.
12. Sprinkhuizen, Sara M., et al. "Temperature dependence of the magnetic volume susceptibility of human breast fat tissue: an NMR study." Magnetic Resonance Materials in Physics, Biology and Medicine 25.1 (2012): 33-39.
13. Ong, Henry H., et al. “MRI susceptometry measurements of murine brown and white adipose tissue.” Proc. Intl. Soc. Mag. Reson. Med. 23 (2015).
14. Sharma, Samir D., et al. "Quantitative susceptibility mapping in the abdomen as an imaging biomarker of hepatic iron overload." Magnetic resonance in medicine 74.3 (2015): 673-683.
Figures