5044
Quantitative MRI method, a multi-pathway multi-echo approach1Radiology, Brigham and Women's Hospital, Harvard Medical School, Boston, MA, United States, 2Department of Imaging system, Philips Healthcare, Taipei, Taiwan
Synopsis
A novel quantitative imaging method based on steady-state signals was proposed to simultaneously resolve MR-related parameters. A special, two-flip angle acquisition was implemented to account for the fluctuations in B1+ field. Furthermore, we developed a motion-resistant sampling scheme to lessen the impact of motion on steady-state signal for in vivo brain scans. A 3D brain imaging that extracts main MR-related parameters such as T1, T2, T2*, M0, B0, and B1+ was performed here in less than 12 minutes.
Introduction
Quantitative parametric mapping offers many advantages over qualitative gray-scale imaging, especially for tissue characterization and segmentation. Quantitative maps, with physical units, may better capture tissue properties than arbitrary gray-scale pixels. Several methods have been introduced to this end, such as DESPOT1, MR fingerprinting2, and GE’s MAGiC application. The main strengths of our approach revolve around its ability to achieve volume coverage relatively rapidly, to map the spatially-varying B1+ field rather than assuming the user-input flip angle value to be accurate, and the fact that it functions in a strikingly different fashion than competing approaches. The latter point suggests that hybrid approaches might be developed, combining strengths from existing methods1-2 to those achieved here for added effect. The present method was validated both in phantoms and in healthy volunteers.Methods
The method is based on a multi-pathway multi-echo pulse sequence (Fig. 1a). It is a 3D steady-state sequence that samples three pathway signals at three different echo times. Two separate scans were performed, with different scaling for the RF waveform (Fig. 1a, gray dashed line, N×α1). An index notation of the form (scan, echo, pathway) was employed in Fig. 1a. Because the larger flip angle scan involved only a small central k-space region, it contributed very little to the overall scan time.
Signal pathways naturally get formed anytime a steady-state (i.e., no RF spoiling) sequence is employed3, see Fig. 1b. But typically, a pulse sequence would sample only one of these pathways. On the other hand, some sequences may sample two4 or as many as three5 pathways. A balanced steady-state (bSSFP) sequence actually samples them all, but in a form where they were first summed and overlapped. The pulse sequence used here is very similar to that employed in TESS5, except for the fact that each one of three acquired pathways gets sampled at a couple different echo times. In Fig. 1b, magnetization states F have a superscript –/+ that means just before/after an RF pulse, and a subscript for pathway number.
The evolution of magnetization states can be mathematically tracked using the equations and tools introduced by Hennig3, leading to a new set of equations solved here for T1, T2, T2*, M0, B0, and B1+. These equations are listed in Fig. 2: Eq. 1 was solved for R2 and R2′ (whereby T2 = 1/R2 and T2* = 1/ (R2+ R2′)), Eq. 2 for the flip angle α1 (and thus B1+), Eq. 3 for T1, and Eq. 4 for M0. Equations 2-4 used definitions from Eq. 5, and Eq. 1 was the same as that also employed in Cheng et al6. A flowchart for the reconstruction process is presented in Fig. 3a.
Scanning was performed on a 3.0T system (Siemens Trio) with a 12-element head matrix. Our 3D sequence provided volumetric parameter mapping, and a series of spin-echo images were acquired at one given 2D location within this volume, to provide a reference standard for T1 and T2. Scans were performed on an fBIRN gel phantom and in vivo on four healthy volunteers (following informed consent using an IRB-approved protocol). To reduce motion sensitivity in human scans, a sampling scheme inspired from the PROPELLER method7 was implemented in the ky-kz plane, to oversample the central k-space region (Fig. 3b). The overall acquisition time was 11m24s, only 40s of which was for the large flip angle acquisition (FOV = 192×192×192mm3, TR = 25ms, nominal flip angles α1/α2 = 15°/330°, matrix size = 192×160×160). One extra global fit parameter β was introduced, as in N = β×α1/α2.
Results
Figure 4a-f show reconstructed parameter maps for one slice (out of 88) in the imaged phantom. Erratic pixels tend to be at the location of air bubbles, where little to no MRI signal was available. Validation against spin echo results is shown in Fig. 4g-h. In vivo results are shown in Fig. 5. Parameters found in white matter (T1=781ms, T2=56.5ms) and gray matter (T1=1279ms, T2=74.1ms) agreed with those found with SE-based measurement (WM: 752 and 62.2ms; GM: 1245 and 66.0ms). Values of β = 1.0 and 1.2 were employed for phantom and in vivo data, respectively.Discussion and Conclusion
We proposed a multi-pathway multi-echo scheme for volumetric mapping of most parameters responsible for MRI contrast, achieving full brain coverage in less than 12 min. Faster imaging could readily be achieved with parallel imaging and/or other acceleration schemes, but our approach already tends to be SNR-limited and shorter scan times might prove detrimental. Good agreement was obtained with a spin-echo based reference standard, both in phantom and in vivo.Acknowledgements
Financial support from grants NIH R21EB019500, P41EB015898 and R01CA149342 is duly acknowledged. The content is solely the responsibility of the authors and does not necessarily represent the official views of the NIH.References
1. Deoni SC, Rutt BK, Peters TM. Rapid combined T1 and T2 mapping using gradient recalled acquisition in the steady state. Magn Reson Med 2003;49(3):515-526.
2. Ma D, Gulani V, Seiberlich N, Liu K, Sunshine JL, Duerk JL, Griswold MA. Magnetic resonance fingerprinting. Nature 2013;495(7440):187-192. PMCID:PMC3602925
3. Hennig J. Multiecho Imaging Sequences with Low Refocusing Flip Angles. Journal of magnetic Resonance (1969) 1988;78(3):397−407.
4. Bruder H, Fischer H, Graumann R, Deimling M. A new steady-state imaging sequence for simultaneous acquisition of two MR images with clearly different contrasts. Magn Reson Med 1988;7(1):35-42
5. Heule R, Ganter C, Bieri O. Triple echo steady-state (TESS) relaxometry. Magn Reson Med 2014;71(1):230-237.
6. Cheng CC, Mei CS, Duryea J, Chung HW, Chao TC, Panych LP, Madore B. Dual−pathway multi−echo sequence for simultaneous frequency and T2 mapping. J Magn Reson 2016;265:177−187.
7. Pipe JG. Motion correction with PROPELLER MRI: application to head motion and free-breathing cardiac imaging. Magn Reson Med 1999;42(5):963-969.
Figures
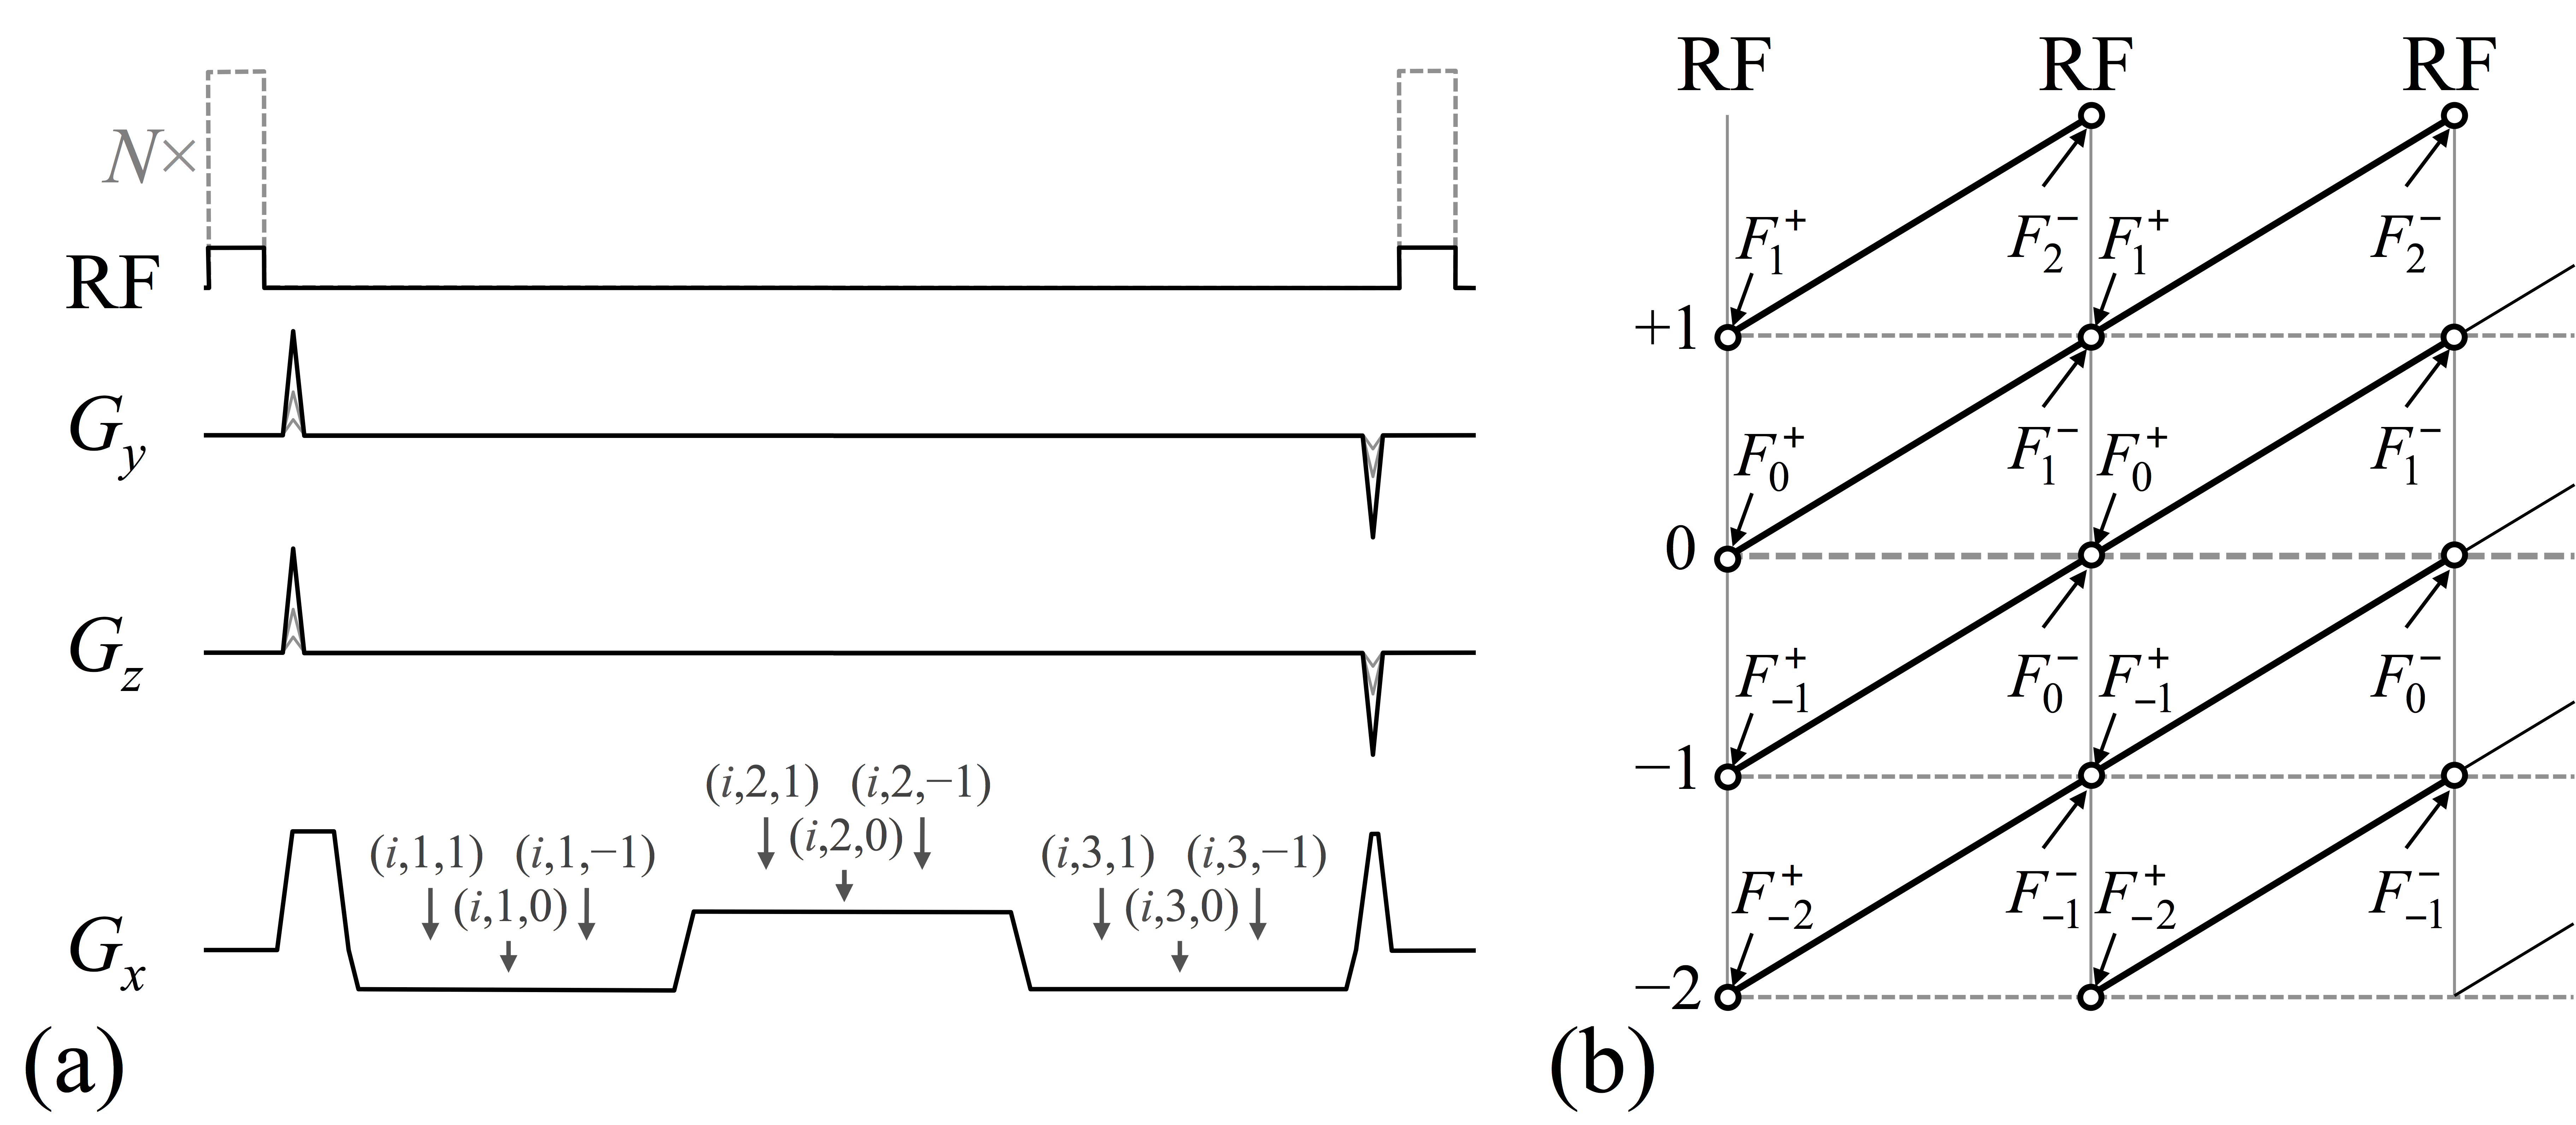
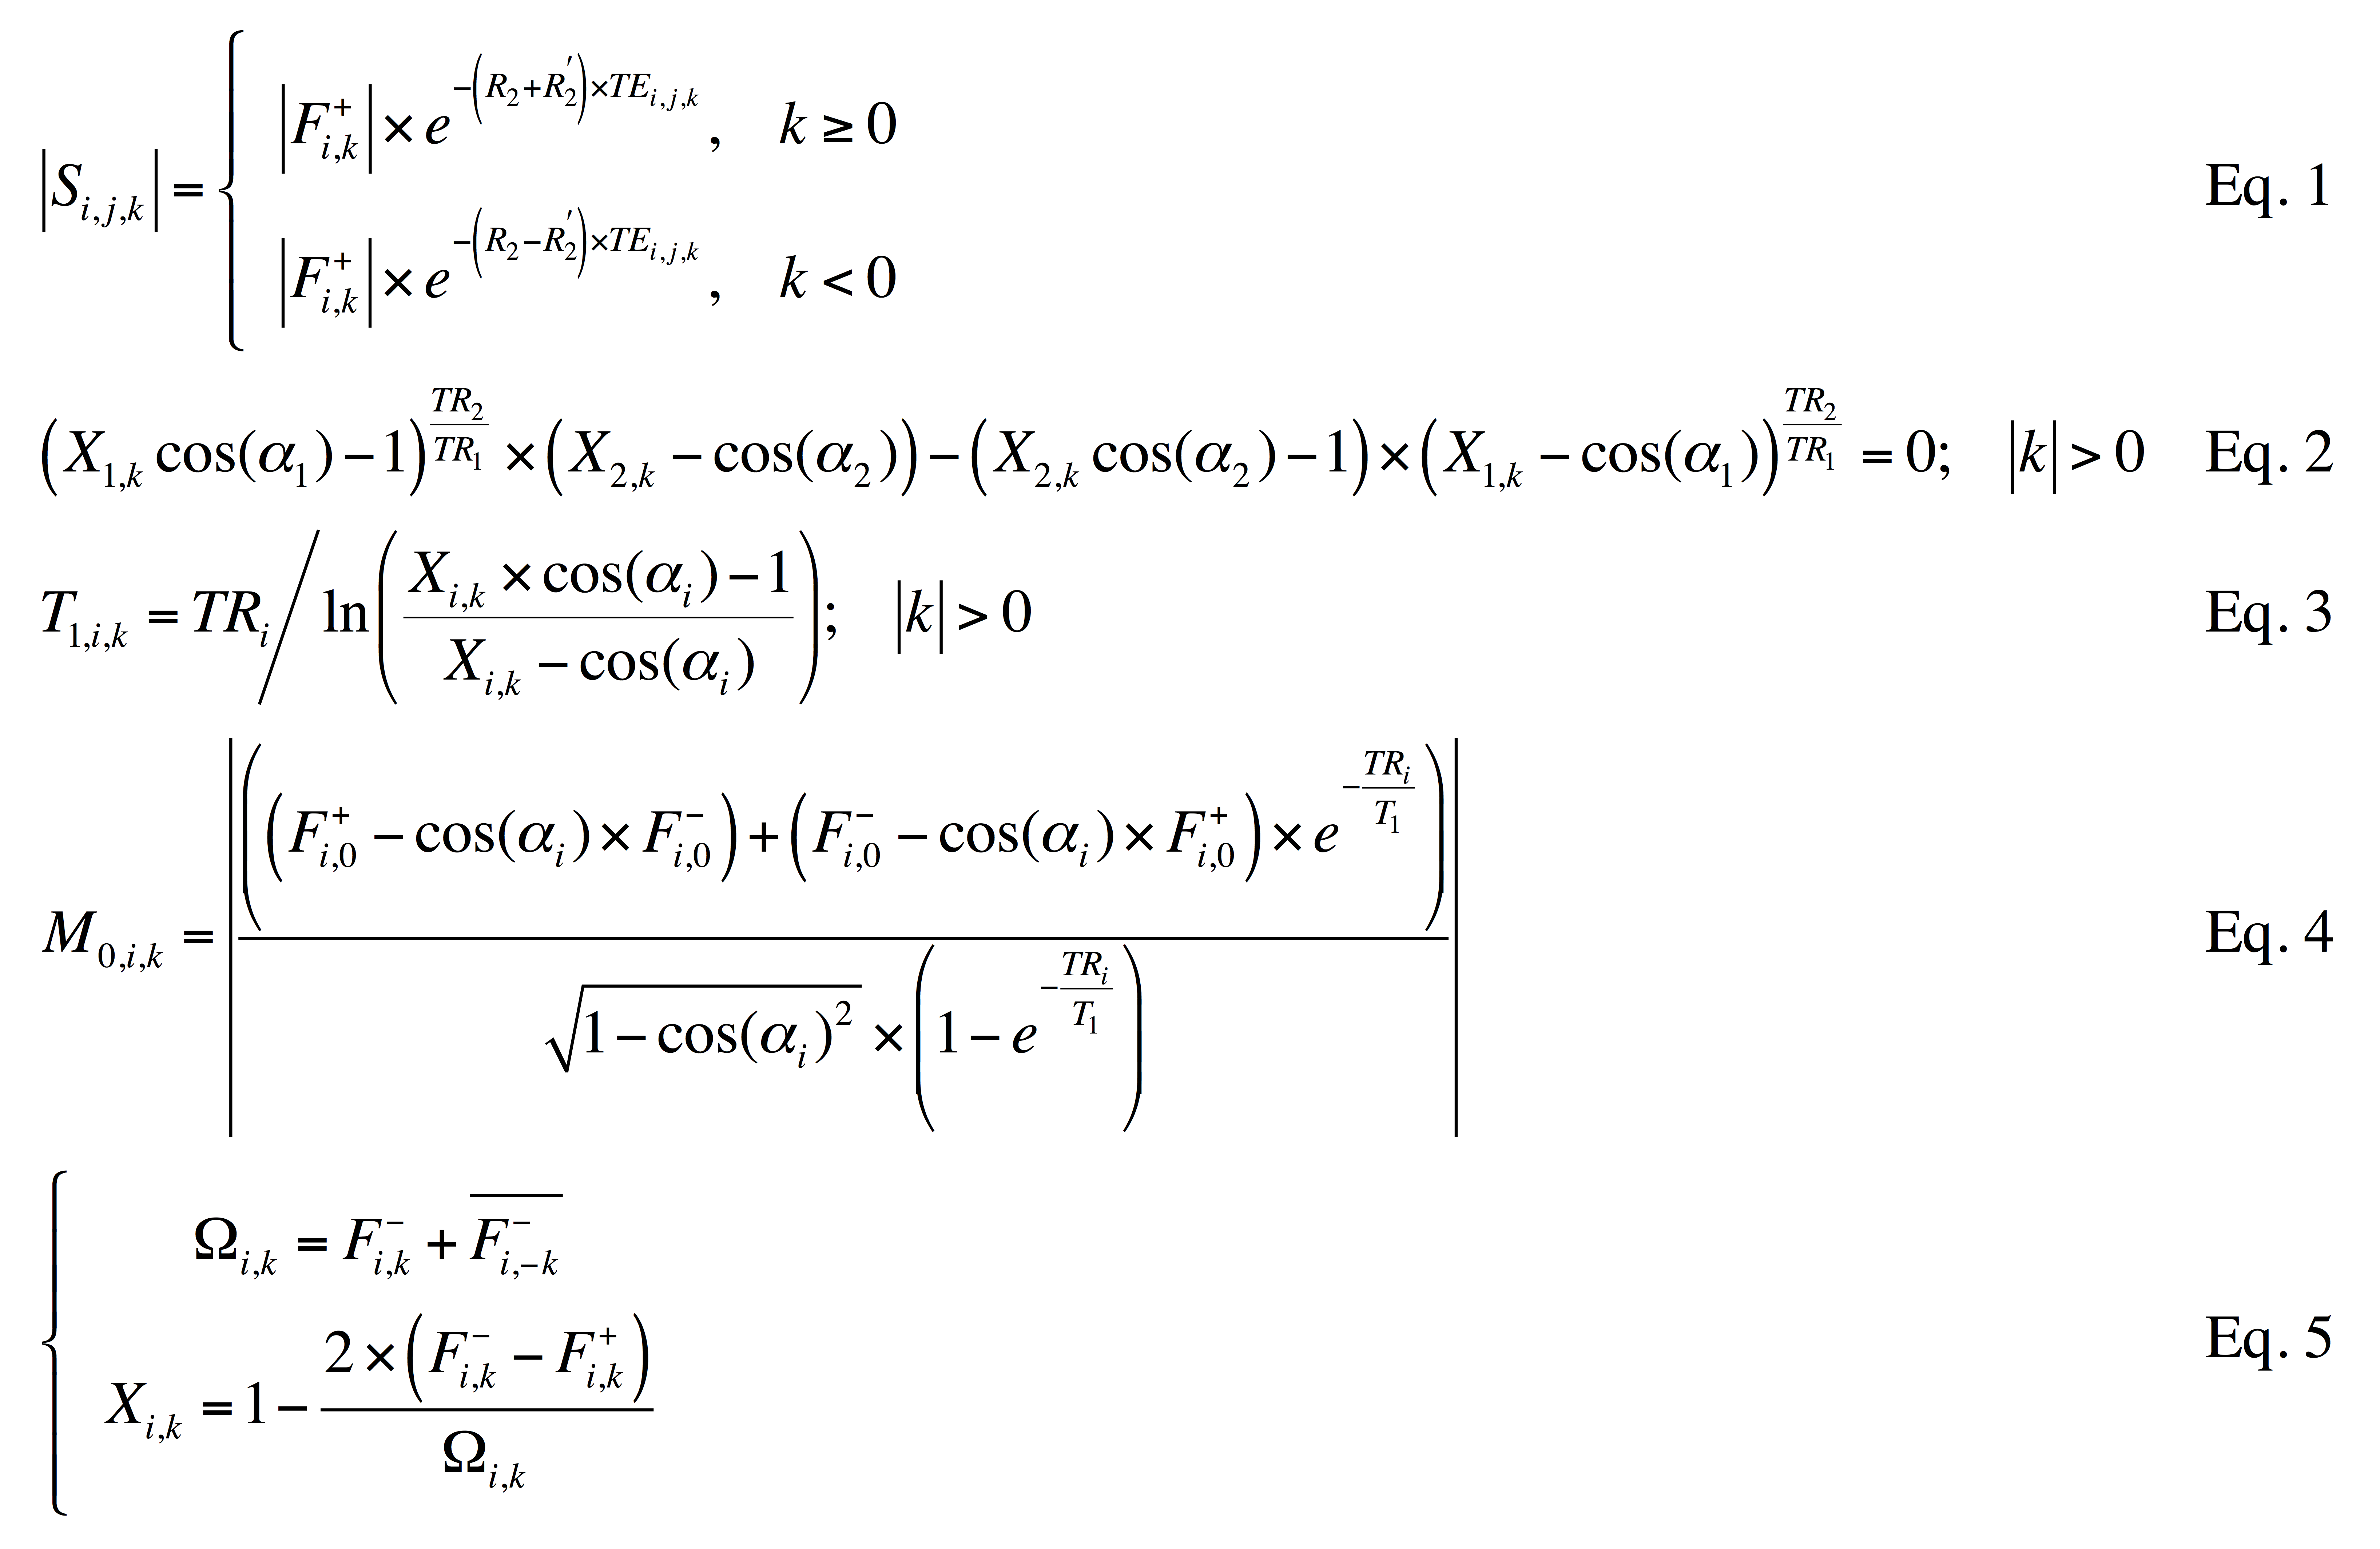
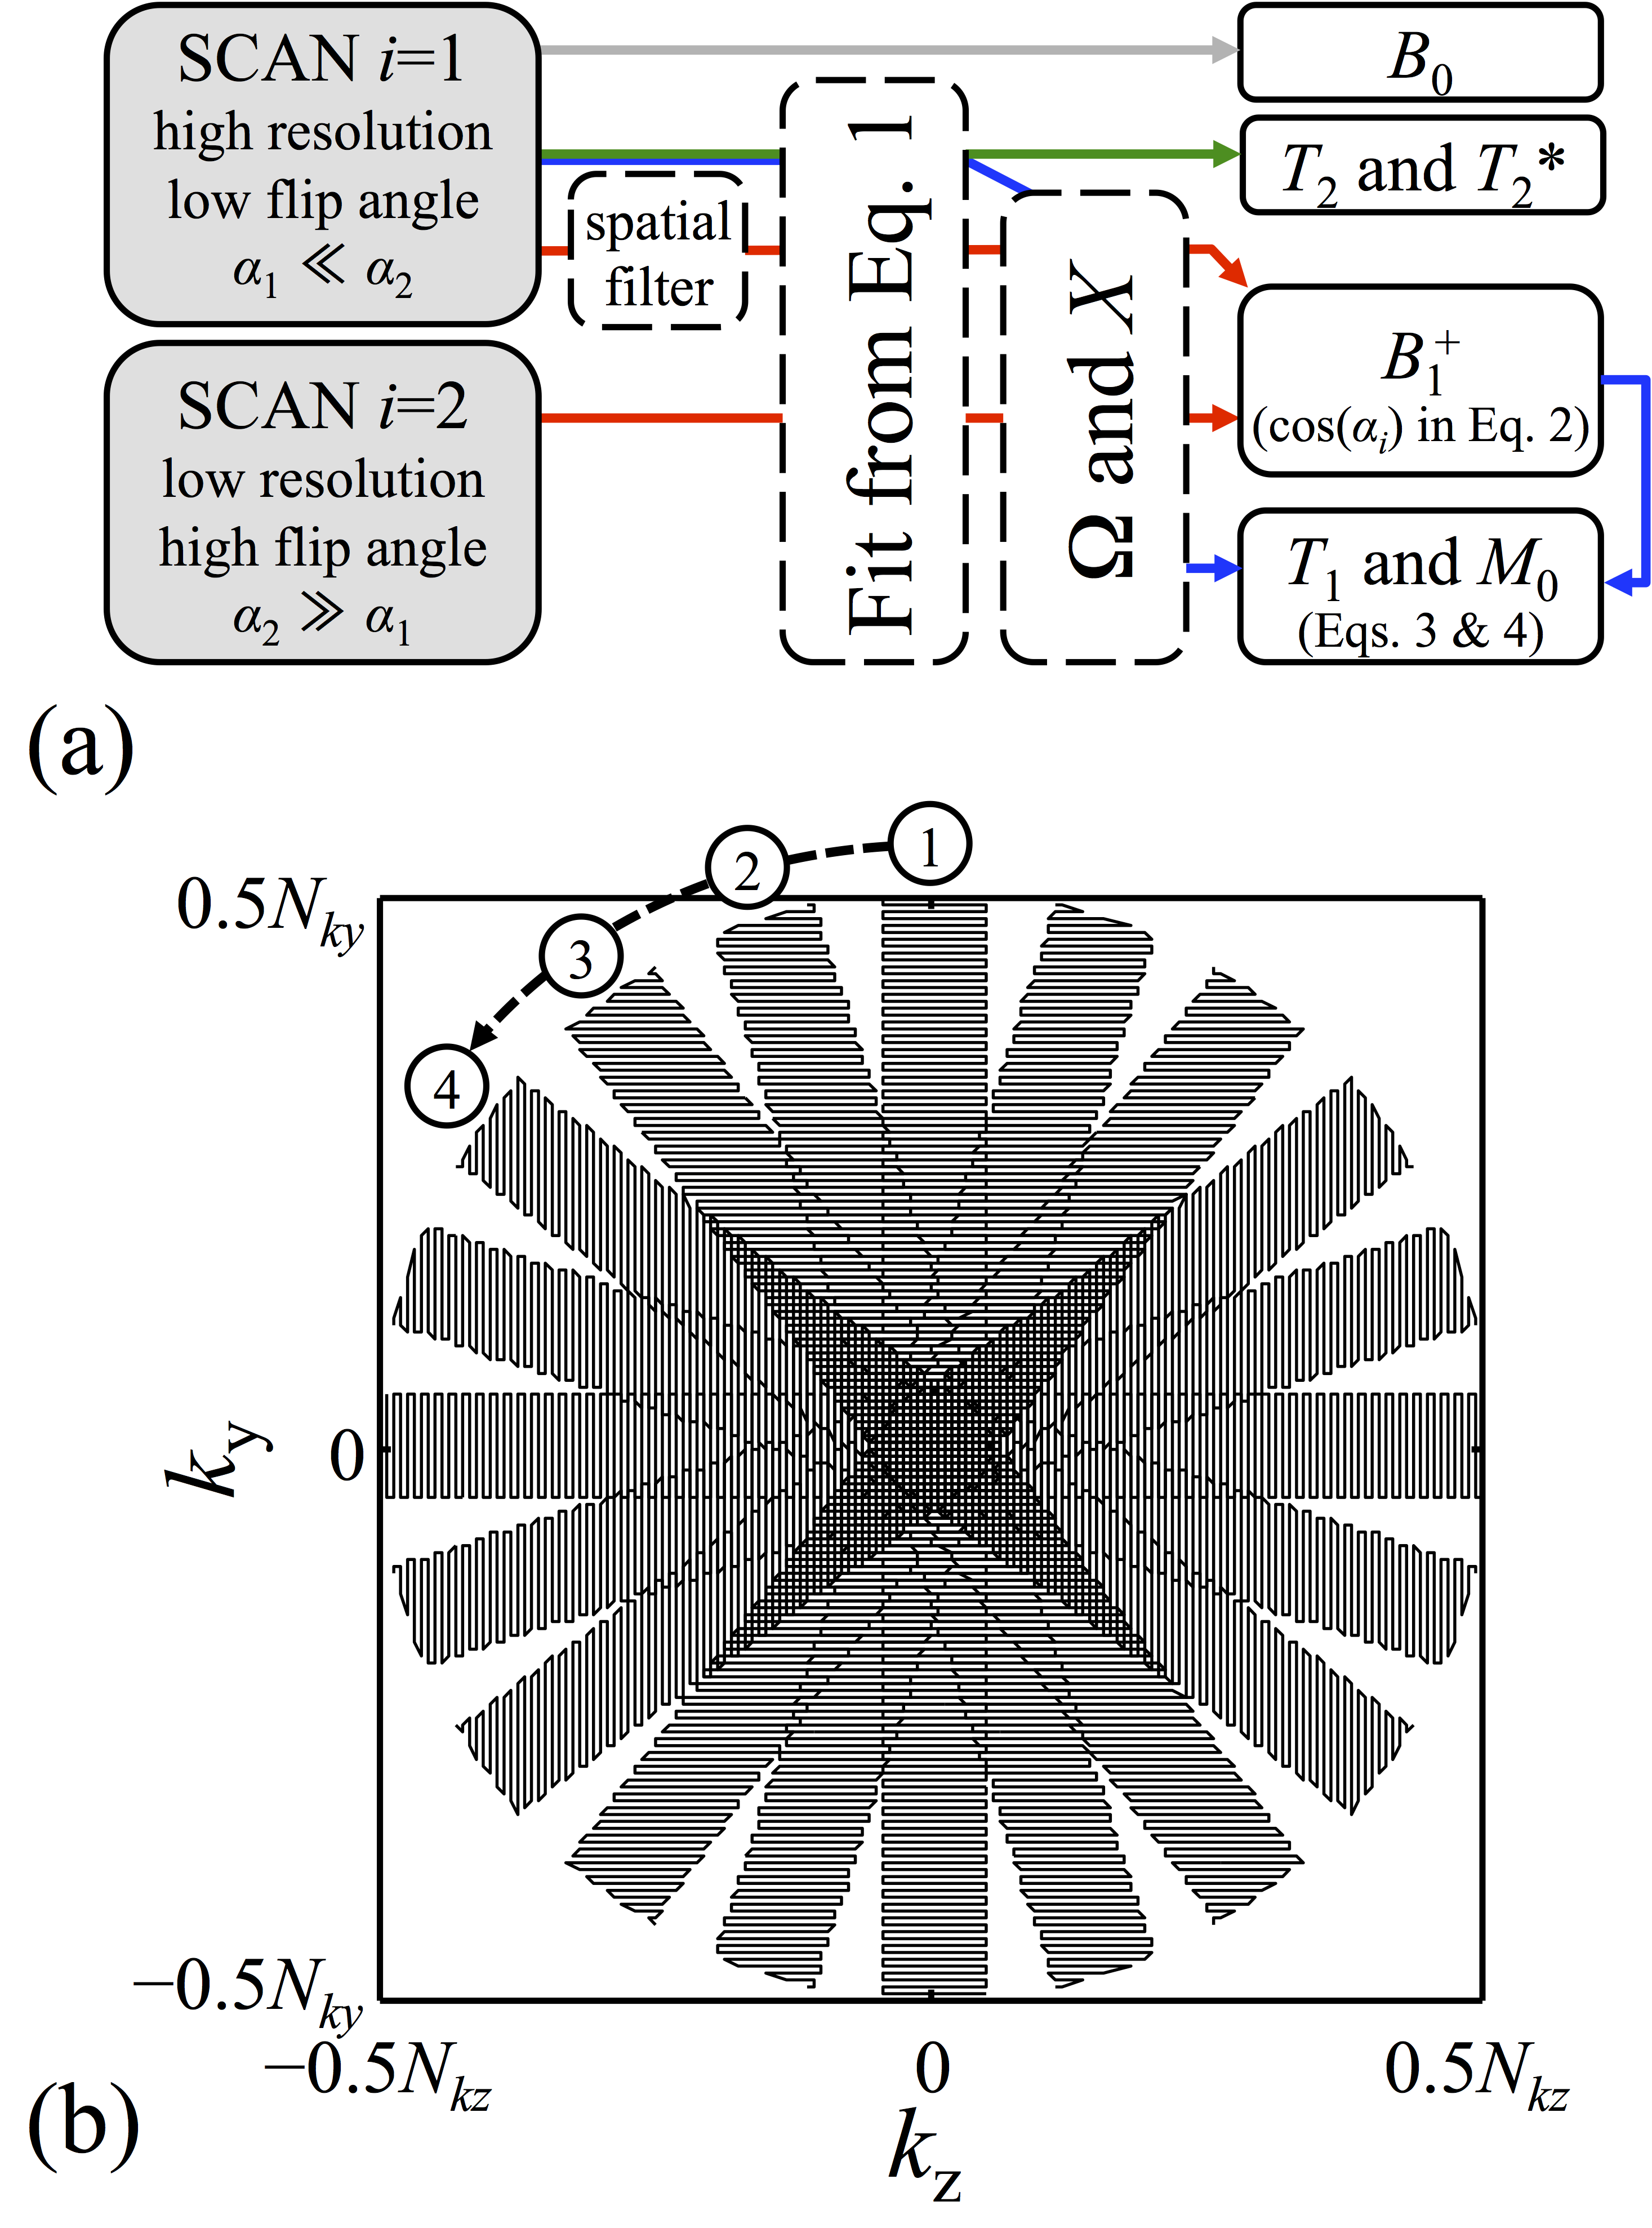
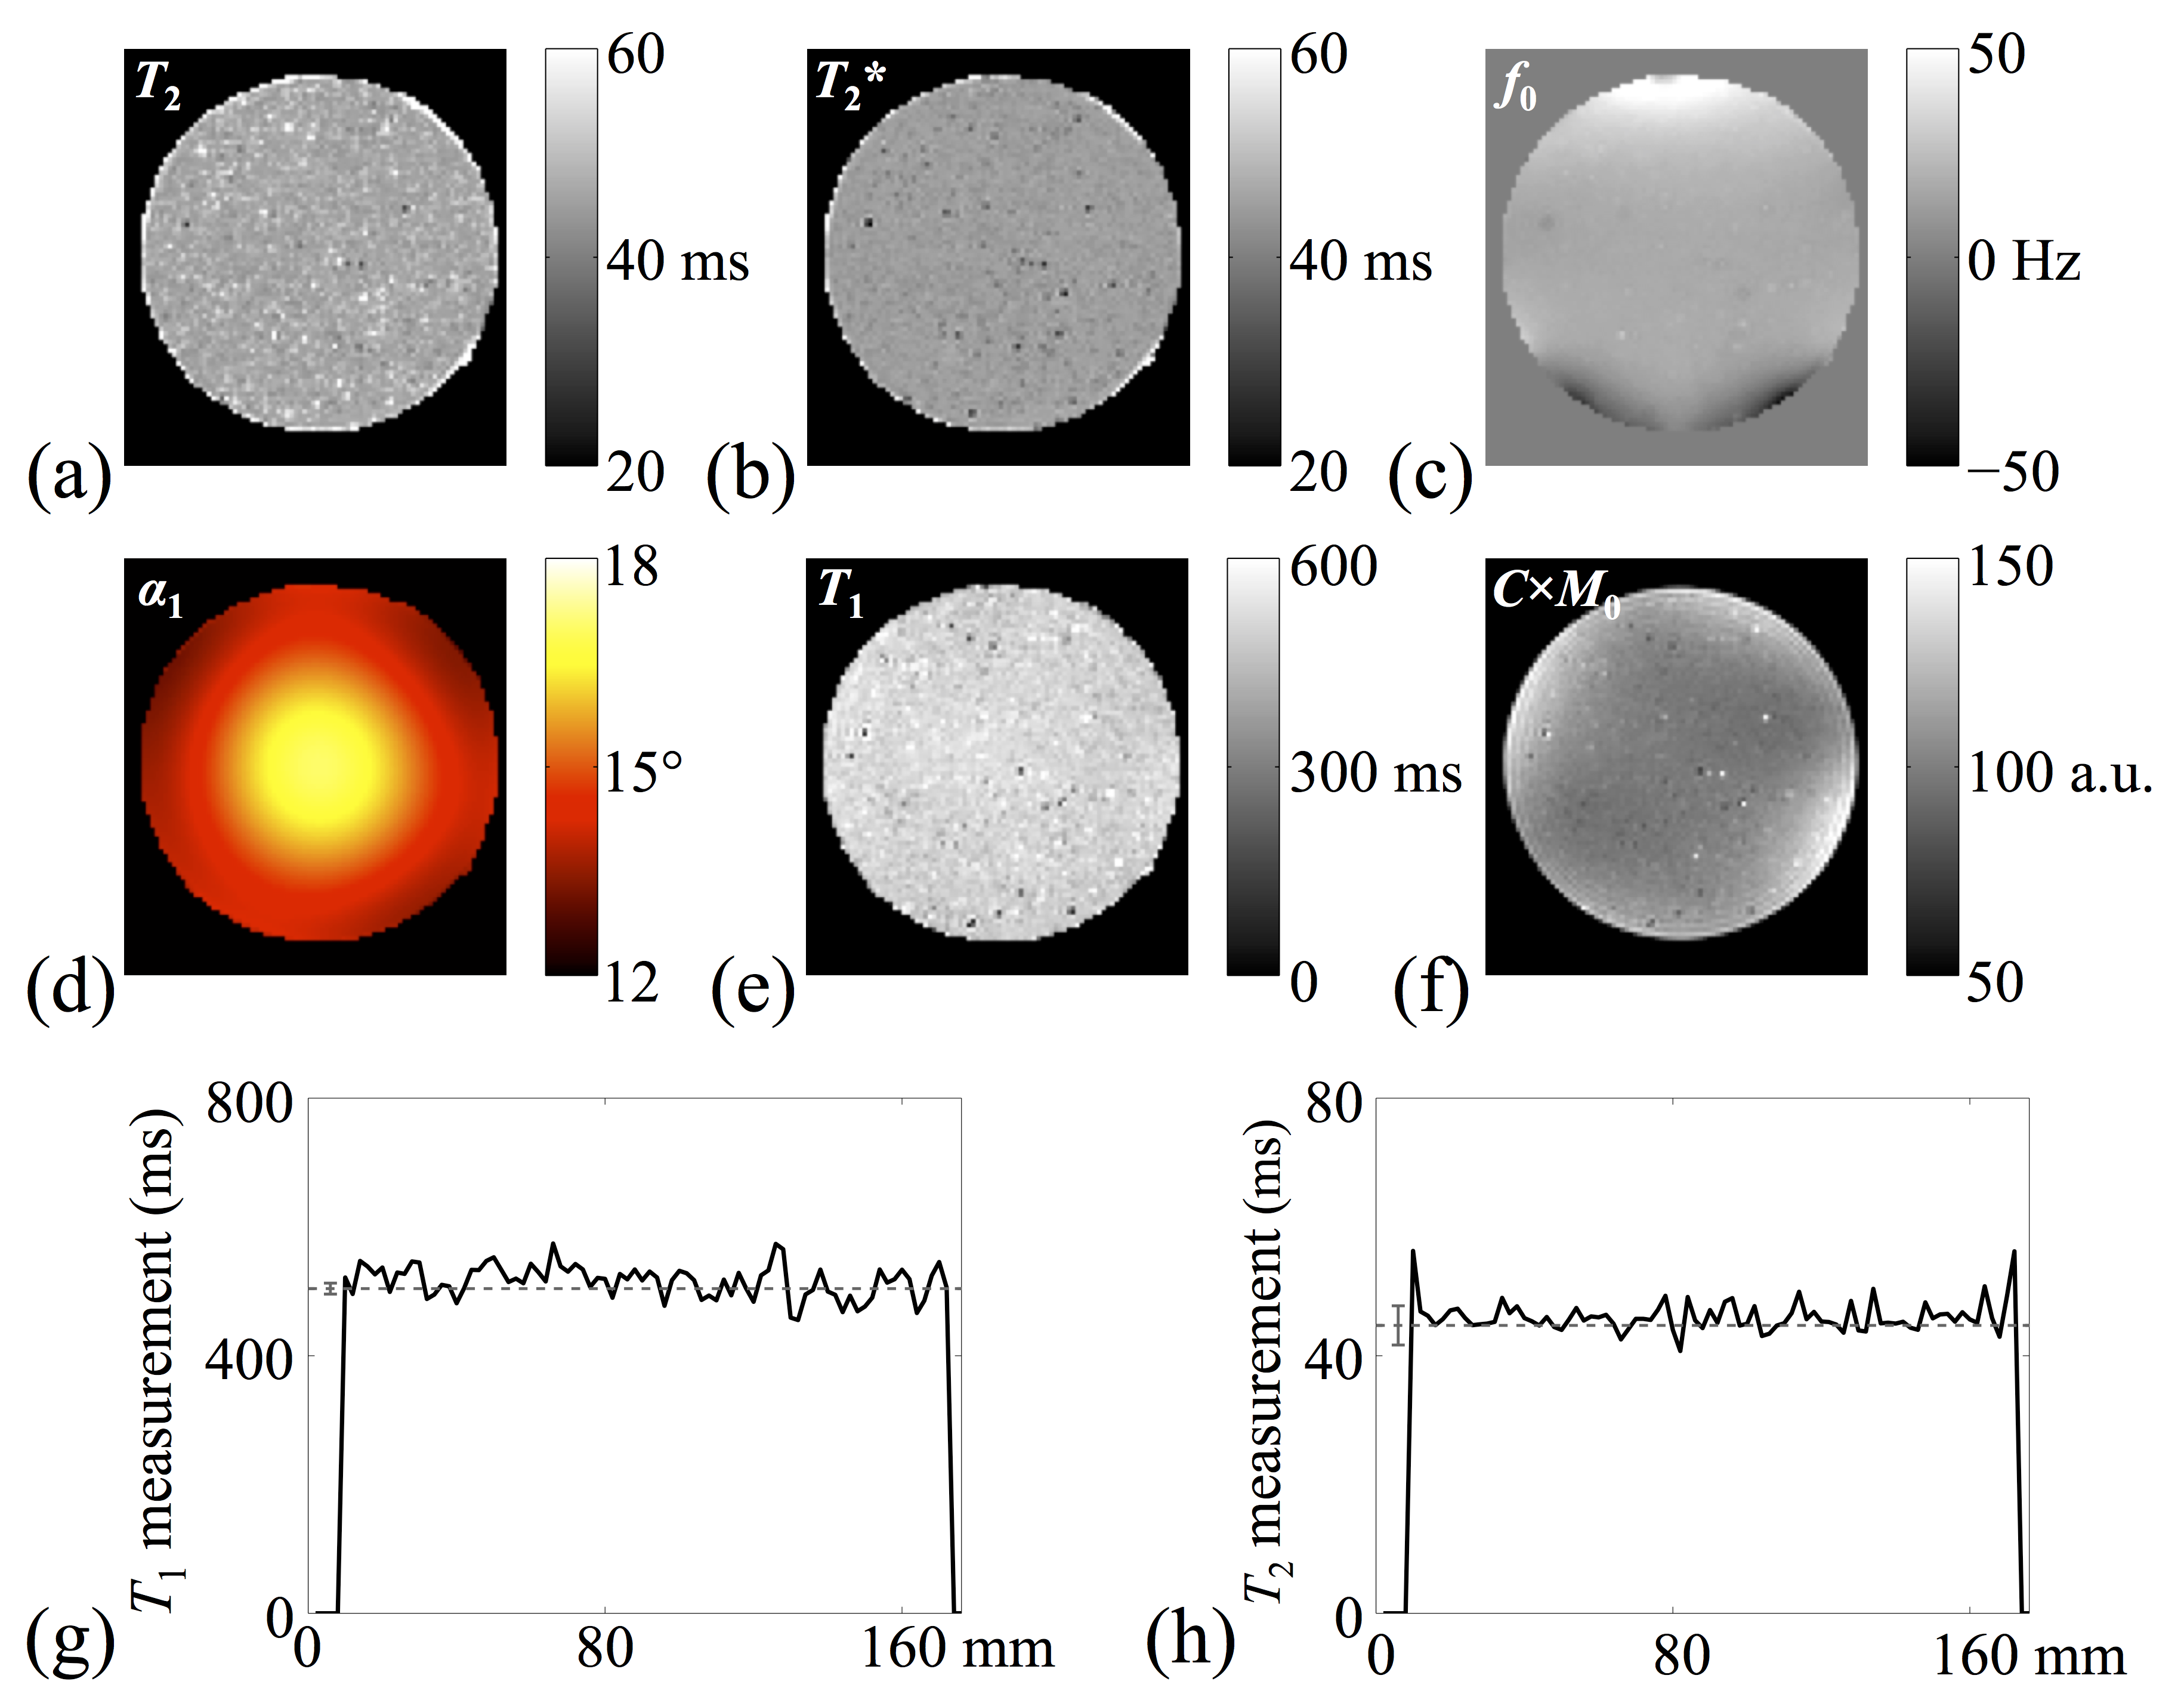
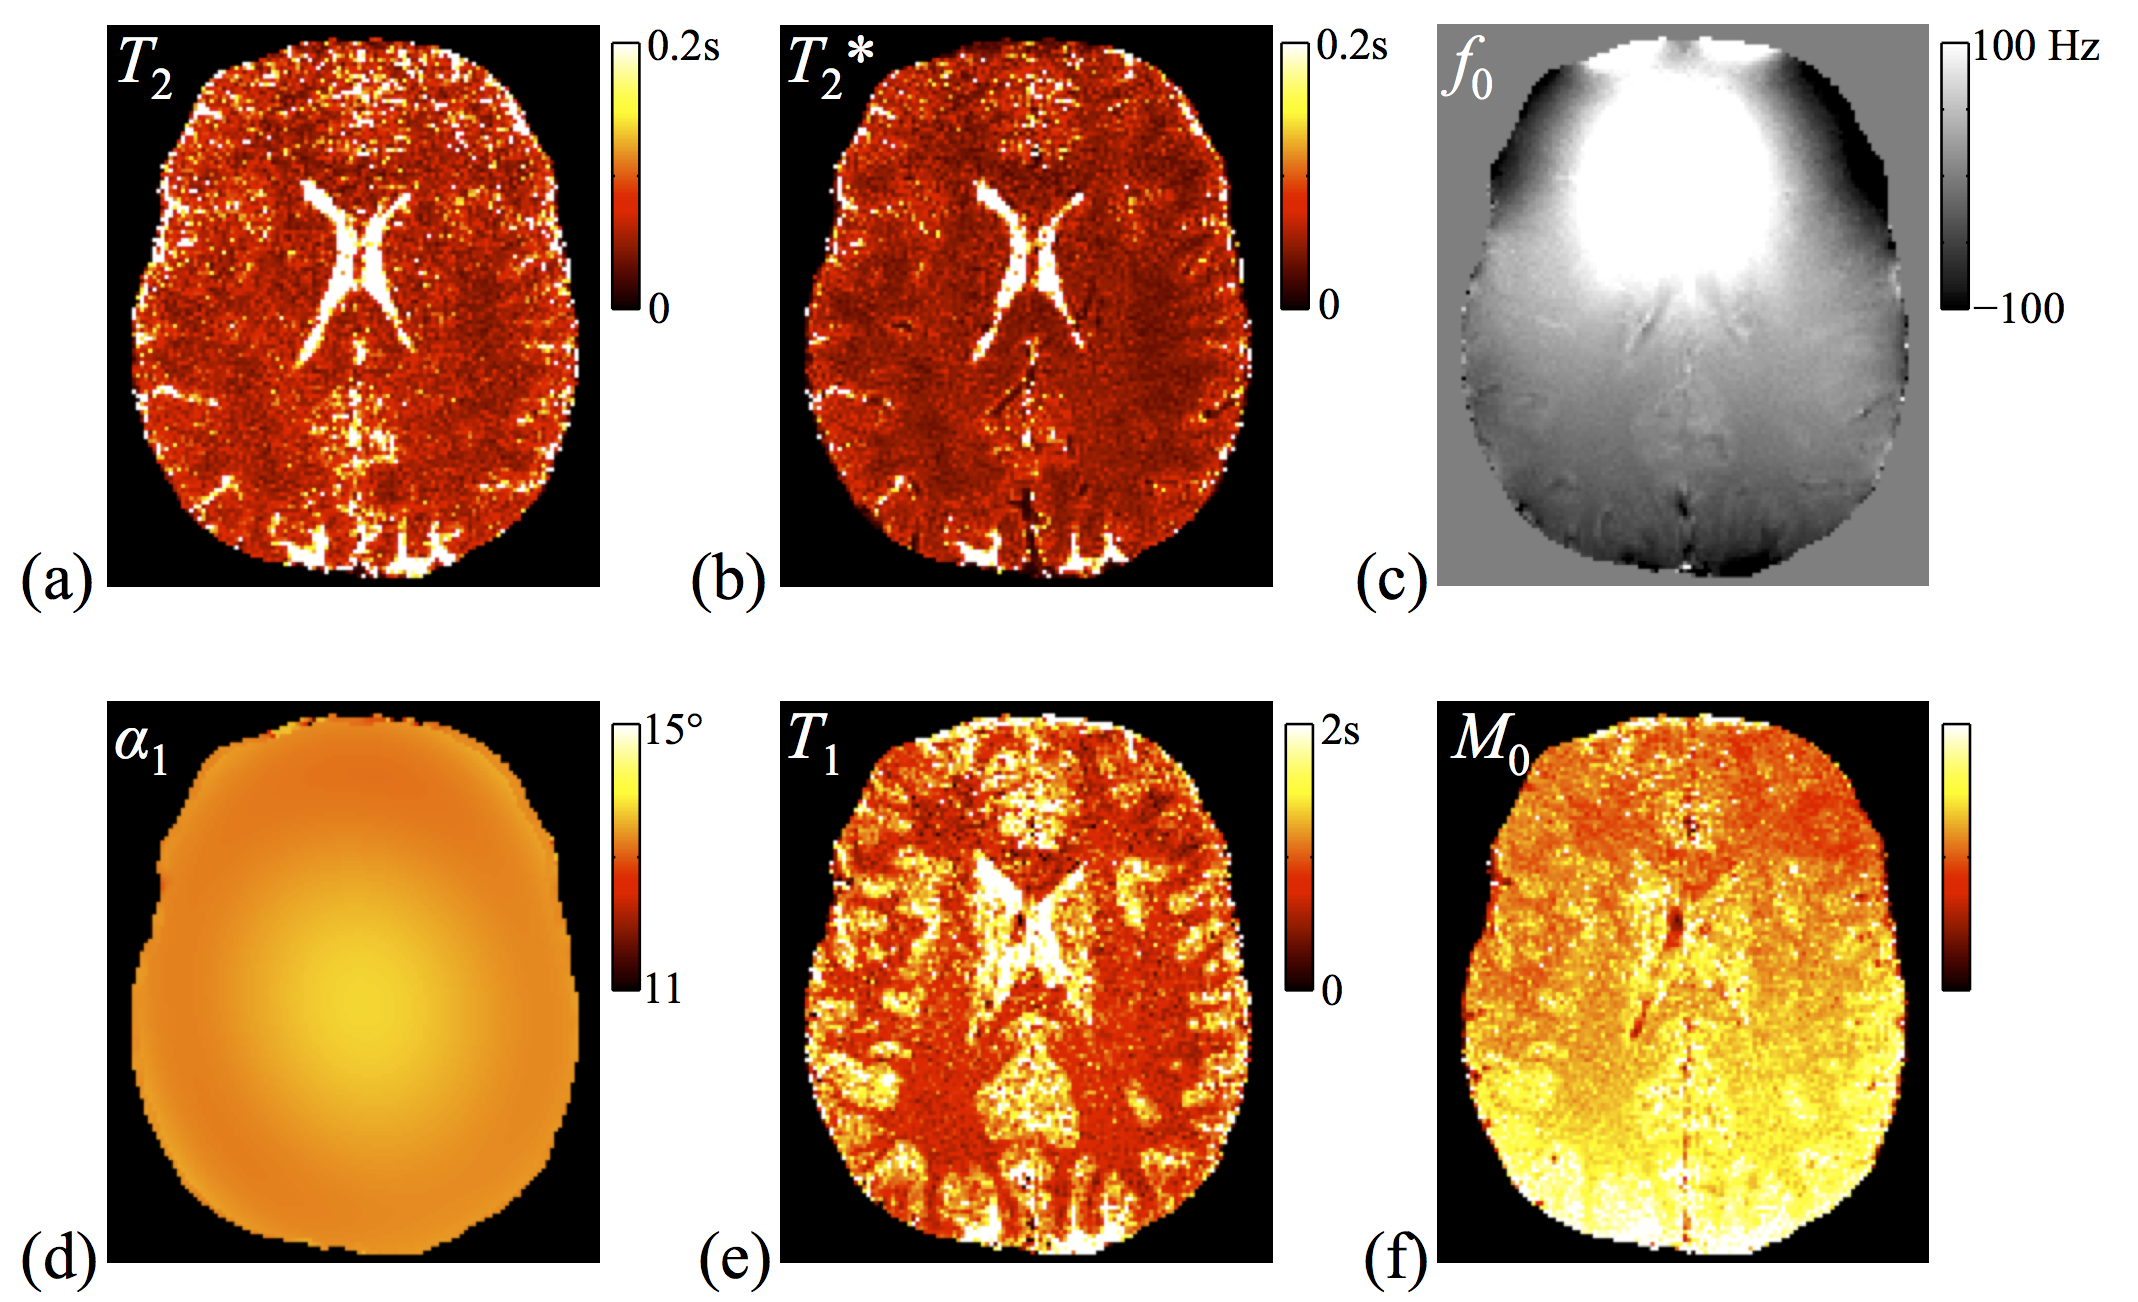
Fig. 5 Parameters maps are shown for one slice (out of 192) from one of four volunteers. More specifically, T2, T2*, f0, the flip angle, T1 and M0 are shown in (a) through (f), respectively.