5043
Quantitative Measures of Arteriole Flow in Human Perivascular Spaces1Department of Radiology and Biomedical Research Imaging Center, University of North Carolina at Chapel Hill, Chapel Hill, NC, United States
Synopsis
Pulsatility of blood flow in human perivascular spaces may play an important role in clearing metabolic waste from the brain. However, flow measurement within small arterioles using MRI are hampered by the limited spatial resolutions of MRI. We report an approach that can accurately measure flow in sub-voxel tubular structures such as arterioles by combining time of flight and phase contrast MRI. The accuracy of our method were first demonstrated in a flow phantom study. Then, flows of penetrating arterioles were obtained in human subjects. Our results demonstrate the importance of correction of partial volume effects in measuring arteriole flow.
Purpose
Pulsatility of blood flow within penetrating
arterioles in perivascular space (PVS) may play an important role in the clearance of
metabolic wastes from the brain1. However, accurate
measurement of flow within arterioles using MRI are hampered by the limited
spatial resolutions of MRI. We report an
approach that can accurately measure flow in sub-voxel tubular structures such as arterioles in
human PVS by combining time of flight (TOF) and phase
contrast (PC) MRI. Theory
In a PC scan, a voxel consisting of two
compartments of static and flowing spins with volume fractions of $$$(1-f)$$$ and $$$f$$$,
respectively exhibits a phase shift of $$$\phi_{\text{meas}}=\arctan(R_Mf\sin\phi/[(1-f)+R_Mf\cos\phi])$$$
where $$$R_M$$$ is the ratio of
transverse magnetizations per unit volume of flowing and static spins, $$$\phi$$$ is the flow induced phase shift and $$$v$$$ is the flow velocity. $$$R_M$$$
depends on $$$T_1$$$, $$$T_2^*$$$, water partition coefficient ($$$\lambda$$$), flip angle, TR, and slice thickness. In
a TOF scan, the signal of the same voxel normalized by that of a voxel fully
occupied by static spins is $$$S_{\text{TOF}}=fR_M+(1-f)$$$. Given $$$\phi_{\text{meas}}$$$ and $$$S_{\text{TOF}}$$$, the
above two equations can be simultaneously solved for $$$v$$$ and $$$f$$$. The flow can be calculated as $$$fv(\Delta x)^2$$$ , where $$$(\Delta x)$$$ is the voxel size. Methods
Experiments were performed using a 7T Siemens Magneton MRI scanner. A Nova RF coil with a single channel for transmitting and 32 channels for receiving was used. A flow phantom was constructed that consisted of a PE10 polyethylene tube with ID/OD of 0.28/0.61 mm penetrating through a cylindrical plastic bottle. The bottle and the tube were both filled with tap water. The flow within the tube was controlled by a syringe perfusion pump to achieve 5 mean velocities of 0.3, 0.6, 0.9, 1.2, and 1.5 cm/s, respectively. In vivo evaluation of the proposed approach was performed in two healthy volunteers (ages 21 and 25) to measure blood flow of penetrating arterioles in PVS. Both TOF and PC images were acquired using a single-slice gradient echo sequence. For PC MRI, a bipolar gradient was inserted between the RF pulse and readout to achieve VENC = 2 cm/s. Parameters for phantom scans were: voxel size $$$0.6\times0.6\times2$$$ mm3, TR = 27 ms, FA = $$$12^\circ$$$. Parameters for brain scan were: voxel size $$$0.3\times0.3\times2$$$ mm3, TR = 30 ms and FA = $$$30^\circ$$$ (TOF) or $$$12^\circ$$$ (PC). The flow direction was always perpendicular to the imaging plane.
Using the theory outlined above, $$$v$$$, $$$f$$$, and flow were numerically calculated using the measured TOF and PC signals,. For phantom study, a correction factor was applied to account for the lack of flow within the tube wall. For in vivo scans, voxels within white matter that showed both flow enhancement in TOF and phase shift in PC scans were identified. Such voxels were considered as the PVS, which consist of an arteriole and cerebral spinal fluid (CSF). $$$T_1$$$ for tap water and CSF were measured with a variable flip angle turbo-spin echo sequence while $$$T_1$$$ for arterial blood was taken from the literature.2 $$$T_2^*$$$ values were measured with a multi-TE gradient echo sequence and $$$\lambda$$$ is assumed to be 1.
Results
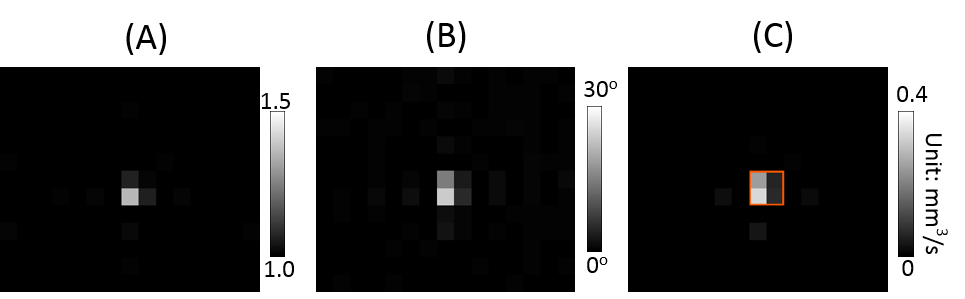
Figure
1 shows representative images of (a) $$$S_{\text{TOF}}$$$ (with correction for tube wall), (b) $$$\phi_{\text{meas}}$$$, and (c) calculated flow
in the flow phantom. $$$v$$$ and $$$f$$$ maps are not displayed as these two maps have much larger errors, consistent with error analysis (data not shown). Flow effects were
observed in 4 voxels although the tube ID is much smaller than the voxel size,
which may be caused by Gibbs ringing.
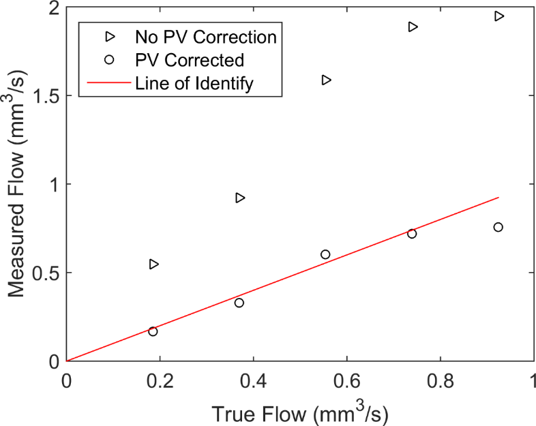
The total flow over the 4 voxels (in the box) matched very well with the
true flow, as shown in Fig. 2, except for the largest flow which may be
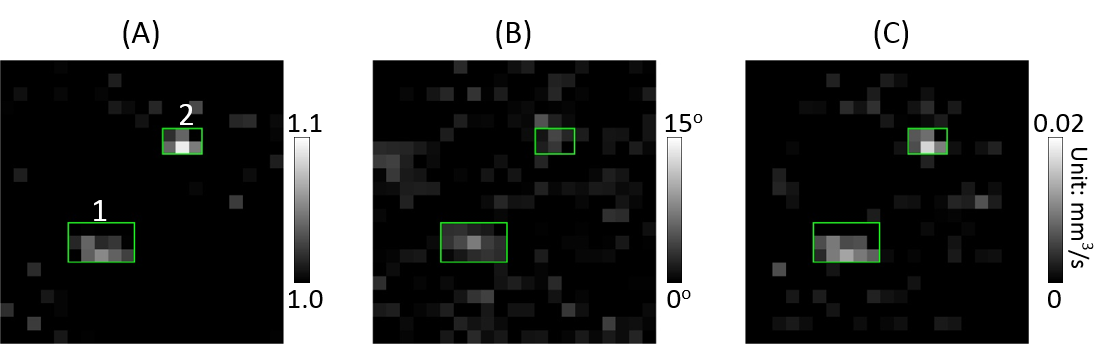
explained by the laminar velocity distribution and phase aliasing. In contrast, the flow calculated directly
from the phase shift is $$$\ge160\%$$$ larger than the true values. Figure 3 shows representative (a) $$$S_{\text{TOF}}$$$, (b) $$$\phi_{\text{meas}}$$$, and flow images of two nearby penetrating arterioles in vivo. The total flow within box 1 and 2 are 0.076
mm3/s and 0.041 mm3/s, respectively. A total of 20 vessels were identified in the two subjects. The mean flow over all vessels was $$$0.052\pm0.035$$$
mm3/s. In contrast, the mean flow
calculated directly from the phase shifts was $$$0.17\pm0.10$$$ mm3/s, again demonstrating the large partial volume effect in flow estimate and the importance of its proper
correction.Conclusions
We have developed a
method for accurate estimate of flow in sub-voxel structures. Phantom studies demonstrate that an accurate
measure of flow can be obtained. Acknowledgements
No acknowledgement found.References
1. J. Iliff, M. Wang, D. Zeppenfeld, et. el., Cerebral Arterial Pulsation Drives Paravascular CSF–Interstitial Fluid Exchange in the Murine Brain. J. Neurosci., 2013, 33(46):18190 –18199.
2. X. Zhang, E. T. Petersen, E. Ghariq, et. al., In Vivo Blood T1 Measurements at 1.5 T, 3 T, and 7 T, Magn. Reson. Med., 2013, 70:1082–1086.
Figures