5040
Insights from a combined study: Linking two modalities – total water content distribution and isotropic water fraction.1Medical Imaging Physics, Institute of Neuroscience and Medicine, Juelich, Germany, 2Faculty of Medicine, RWTH Aachen, JARA, Aachen, Germany
Synopsis
Two methods – distributions of total free water (FW) content and unrestricted, isotropic water fraction (IWF) were studied in order to establish a possible link between them. MRI protocols were set in order to obtain quantitative FW maps as well as IWF distributions, based on a free water elimination DTI method. Joint histograms reveal strong correlation and suggest the way FW can complement the information obtained from IWF. Combining both modalities (FW and IWF distributions) in presence of pathologies may help to define the pathophysiological basis of different disorders and identify predictors of clinical symptoms.
Purpose
Absolute water content measurements1 in vivo using quantitative MRI have been shown to be significant for the diagnosis, monitoring and study of various diseases and pathologies of the brain. A number of central nervous system diseases exhibit changes in free water (FW) content (i.e. loosely bound) and myelin content and, therefore, in the longitudinal (T1) and transverse (T2) relaxation times.1,2,3,4 Recently, an approach for the estimation of the isotropic, free water fraction using DTI has been proposed5,6, based on a multi-compartment model. In this context, the term “free” refers to water molecules whose diffusion is not constrained by their surroundings, such as cerebrospinal fluid (CSF) confined to the ventricles and subarachnoid space. More water molecules in the interstitial space may exhibit isotropic properties in case of vasogenic oedema due to processes such as tumours, brain trauma, or haemorrhage that cause disturbance in the blood–brain barrier.5
Combing these modalities may provide better insights towards understanding the relation between absolute FW content and relative isotropic water fraction (IWF) especially in case of pathologies or early diagnosis of disease development.
Methods
MRI protocols were set up to assess quantitatively in vivo T1, T2* and FW on a 3T Siemens (Erlangen, Germany) TIM TRIO system, using a 32-channel head coil for signal reception. After obtaining written consent from healthy participants, MR imaging was performed. The measurement protocol for the estimation of FW uses a 2D multi-echo multi-slice spoiled gradient echo sequence with subsequent correction of the influence of T1, T2* and RF non-uniformities.7 The FW maps were finally calibrated to the ventricular CSF signal as a reference.
The IWF map was assessed using the free-water elimination method based on DTI. We follow the model suggested elsewhere5,6, which assumes that the normalised, diffusion MRI signal originates from two pools in the slow-exchange limit:5,6
$$S\left(b,\mathbf{g}\right) = f_w\text{exp}\left(-bD_0\right)+\left(1-f_w\right)\text{exp} \left( - b\mathbf{g}^\text{T}\mathbf{Dg}\right)$$
where, $$$f_w$$$ and $$$D_0$$$ are the fraction and the diffusion coefficient of the free-water pool, $$$\mathbf{D}$$$ is the diffusion tensor for water in the tissue compartment and $$$b$$$ and $$$\mathbf{g}$$$ are the strength and direction of the diffusion weighting gradient, respectively. It should be noted that $$$f_w$$$ and (1- $$$f_w$$$) are the relative pool fractions contributing to MRI signal at echo time, i.e. uncorrected for between-pool differences in T2. The FSL8 toolbox was used to compensate for eddy currents and EPI distortions before data analysis. Data post-processing was performed with in-house MATLAB- scripts.
For further analysis, the T1 map was used for tissue segmentation into white matter, grey matter and for CSF compartments. Histograms and mean values in white matter and grey matter structures were analysed on co-registered volumes.
Results and Discussion
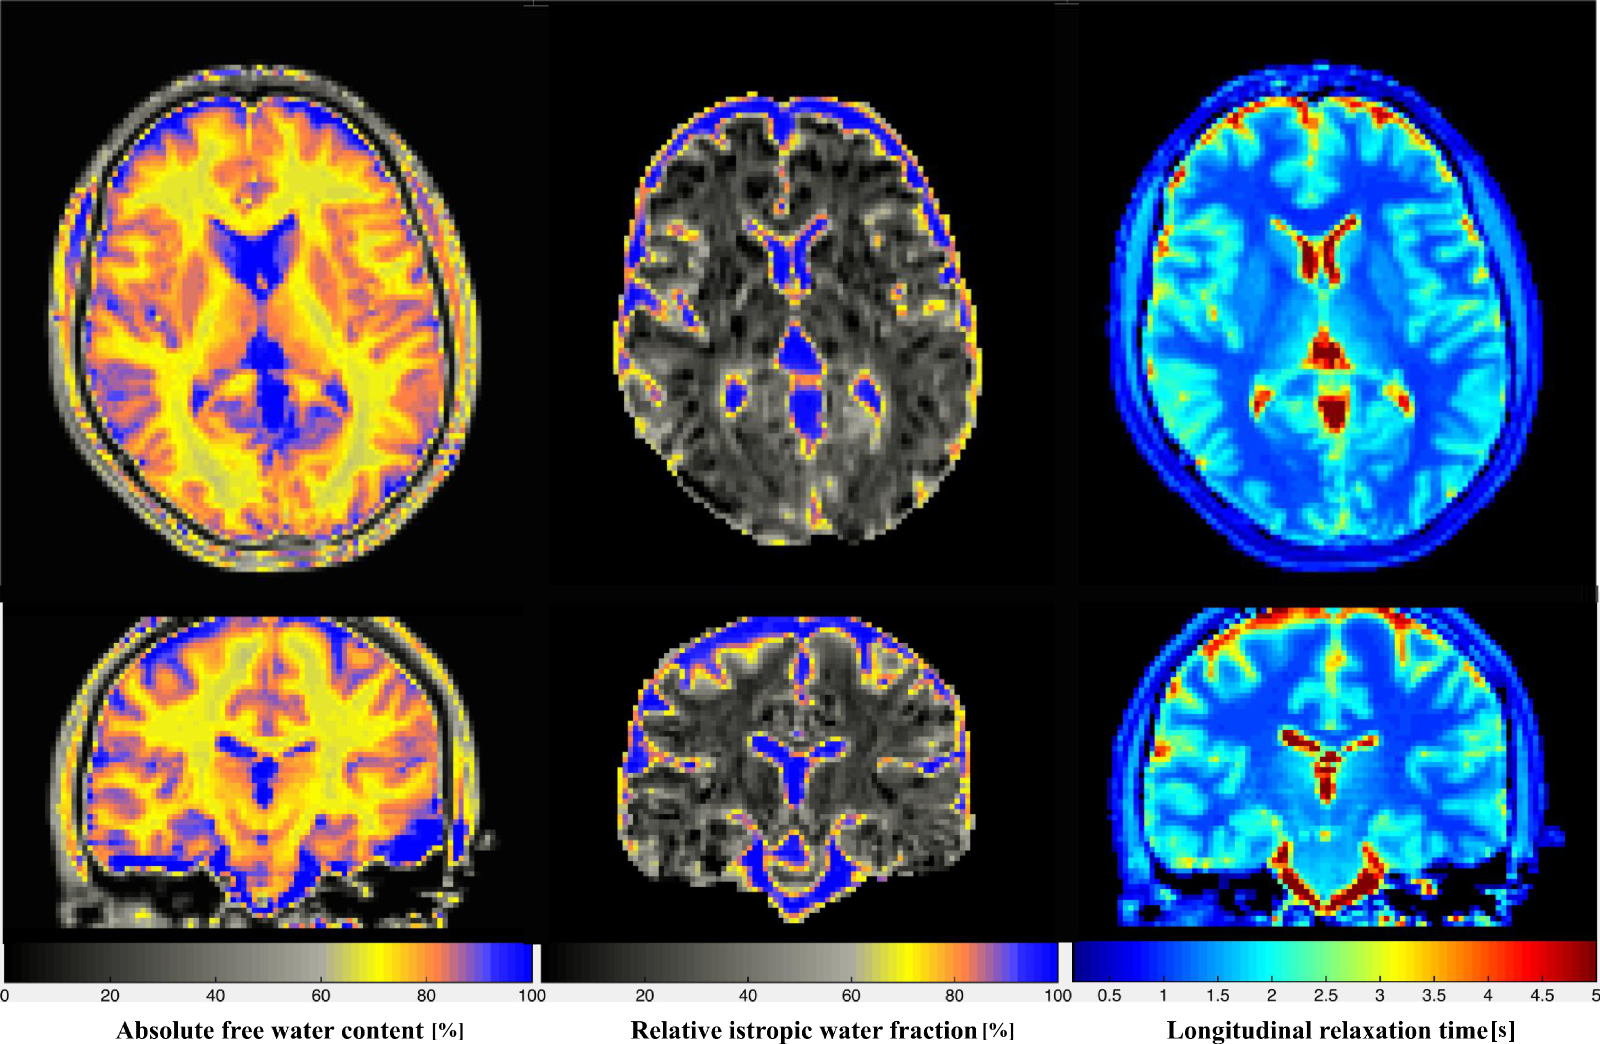
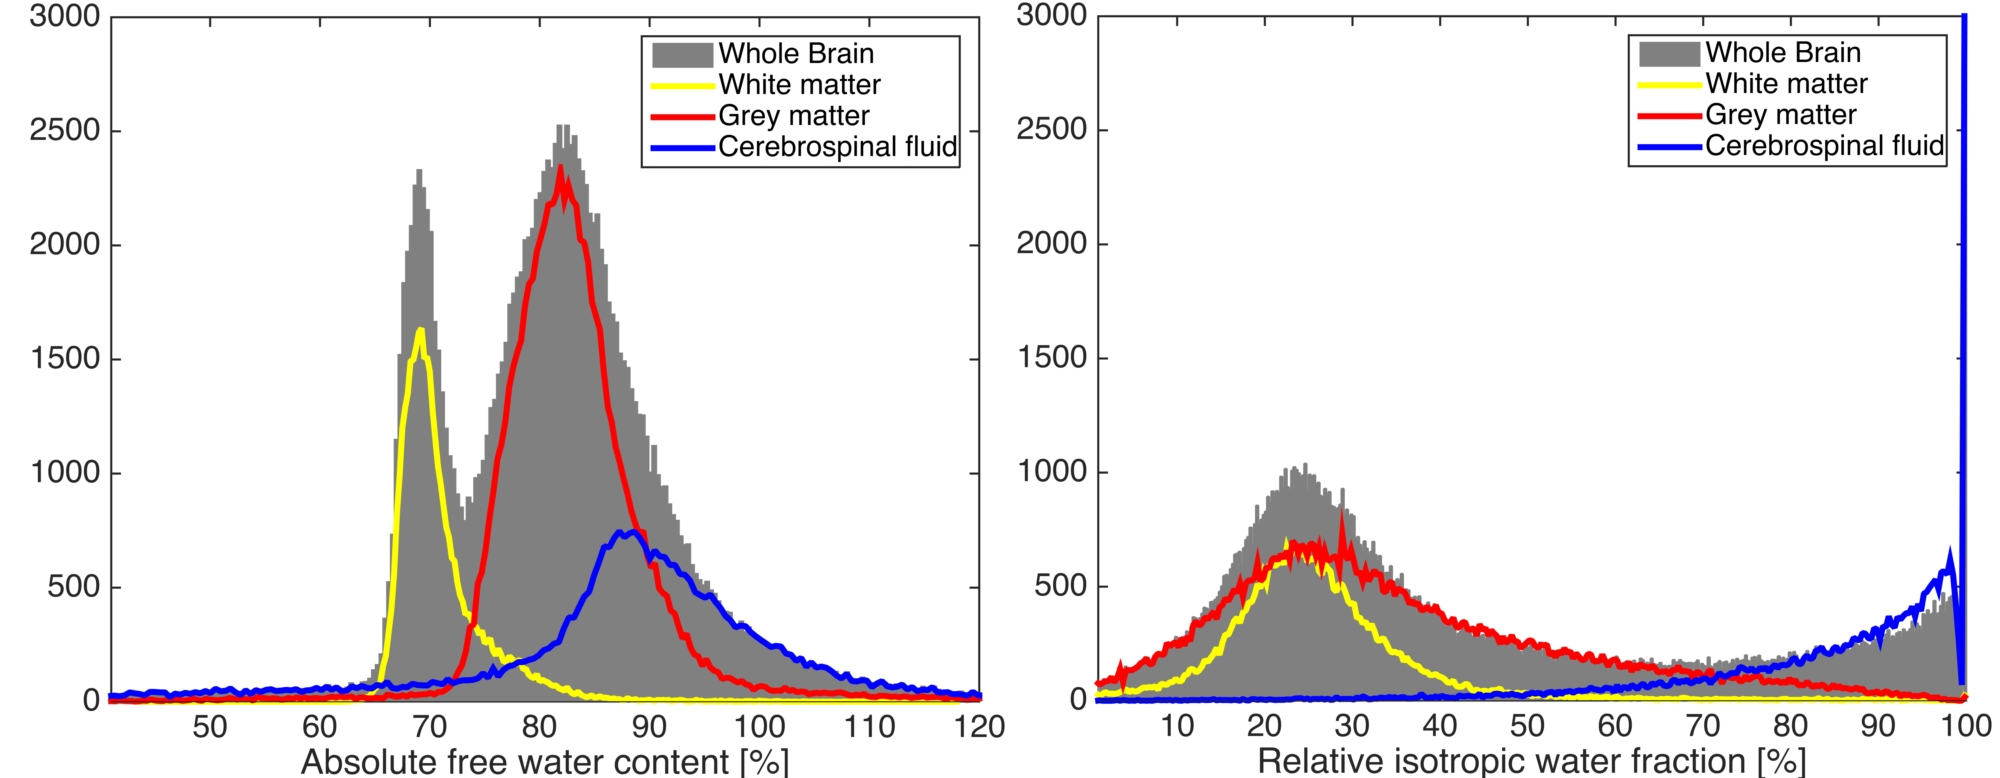
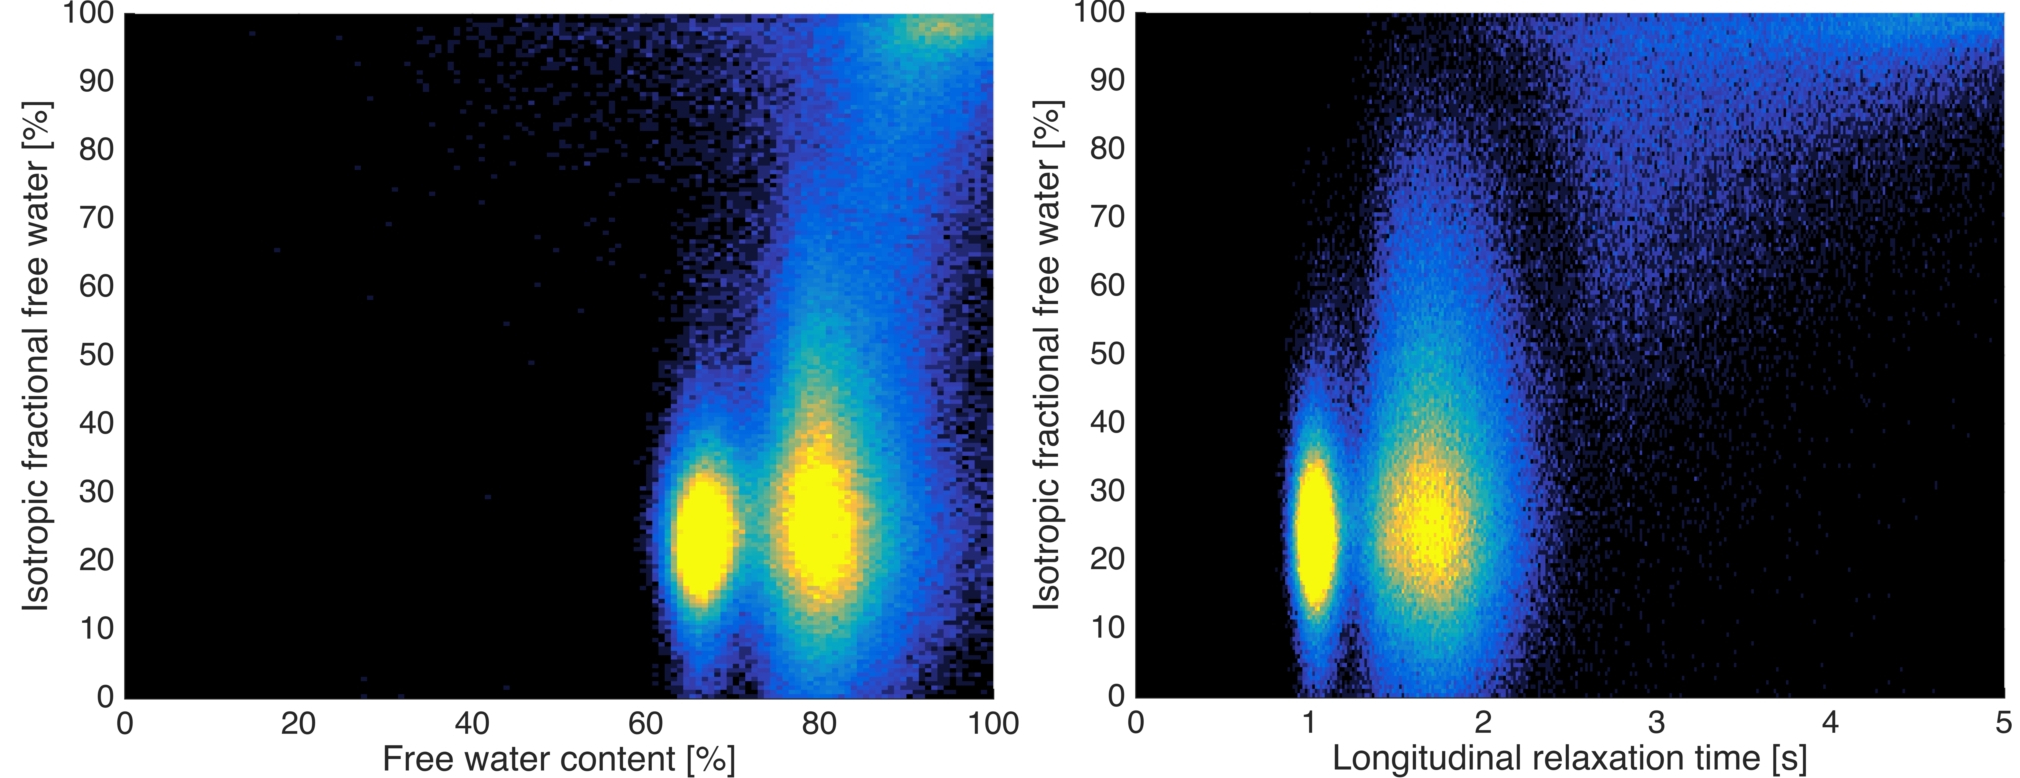
Axial and coronal FW, IWF and T1 maps for a representative subject are shown (from left to right) in Figure 1. Histograms of FW, IWF from whole brain, white matter, grey matter and CSF are displayed in Figure 2. The mean values obtained from FW map for white matter and grey matter were 71% and 83%, whereas the mean values for IWF were 24% and 26%, respectively. These values correspond well with reported literature values. Figure 3 shows the joint histograms of FW vs. IWF and T1 vs. IWF. The standard deviation on the horizontal axes is lower, showing relatively narrow distribution of FW compared to IWF. The IWF distribution is especially broad for GM tissue. Thus, the measurement of IWF in combination of FW can give better insights of water distribution within the tissue compartments. This would be especially important when investigating pathologies that may either cause oedema due to inflammation, or between-tissue water shift caused by tissue atrophy. In particular, it has been recently shown (Ofori et al. Figure. 2,3)9 that IWF is elevated in the posterior region of the substantia nigra in Parkinson’s disease patients compared with control subjects.9 However, it is not clear whether these changes in IWF are accompanied by increase of total FW, or is the result of water shift between the tissues caused by neuronal loss. Information regarding FW changes could infer valuable insights into underlying pathophysiological mechanisms of the disease.Conclusion
The study presented here is the first effort to link absolute free water content (FW) and isotropic water fraction (IWF). It is important to understand whether there is a link between changes in FW and IWF in the presence of pathologies, which may help to define the pathophysiological basis of different disorders and identify predictors of clinical symptoms.Acknowledgements
No acknowledgement found.References
[1] Neeb et al NeuroImage 42, 1094–1109, 2008.
[2] Shah et al. NeuroImage 41, 706-717, 2008.
[3] Reddy et al. AJNR 30,978-984, 2009.
[4] Reetz et al. PLoS ONE. 2015;10(3).
[5] Pasternak et al. Magn. Reson. Med. 2009; 62:717-730.
[6] Pasternak et al. Med Image Comput Comput Assist Interv. 2012; 15:305-312.
[7] Abbas et al. Magn Reson Med. 2014 Dec; 72(6): 1735–1745.
[8] Andersson et al. NeuroImage 2016, 125:1063-1078.
[9] Ofori et al. Neurobiol Aging. 2015; 36:1097–1104.
Figures