5036
Value of quantitative T2 mapping in detecting early joint changes in children with haemophilia1henan province people hosptial, zhengzhou, People's Republic of China, 2henan provice people hospital, 3henan provice people hospital, zhengzhou, People's Republic of China
Synopsis
T2 mapping imaging, as one of the MRI functional imaging, is sensitive to the changes of early cartilage components in the early stage of HA, hinting that T2 mapping imaging may be used as a tool to diagnose the cartilage disease in the early stage of HA.
Background and goal
Magnetic resonance imaging (MRI) is the most effective tools for detecting HA. But the conventional sequences of MRI is difficult to find early articular cartilage lesions and minor bleeding in the joints. Functional MRI, such as T2 mapping image can detect cartilage lesions at a molecular and biochemical level. The main purpose of this research is to explore the changes of early cartilage components in the early stage of HA by the method of T2 mapping imaging, and to preliminary evaluate the clinical value of the sequence for the patients with HA.Method
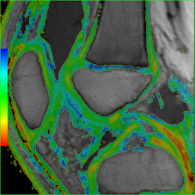
There ware 50 cases (78 knees) of hemophilia patients (ICRS grade 0-II) and 10 volunteers (18 knees) inrolled in our study. All the patients had knee bleeding experience. T1WI, T2WI, FS-PDWI, 3D-FS-SPGR, T2 mapping image ware performed in 3.0T MRI().The experimental group were further divided into group A (grade 0), group B (grade I-II) . The T2 mapping image is post-processed in order to obtain the pseudo-color images of cartilage. The region of interesting(ROI) of cartilage ware divided into 6 areas, including femoral condyle, patella, lateral femoral condyle, lateral tibia condyle, medial femoral condyle and the medial tibia condyle, in which the slice of most thick cartilage layer was selected and divided in to 3 layers to measure T2 value. The differences of T2 values between the experimental group and the control group and intra-experimental groups were analyzed with single factor variance analysis. P <0.05 for the difference was statistically significant. ResultsResults
The difference of T2 values of each ROI area cartilage were statistically significant between the control group and the experimental group, the control group and the 0 grade group, the 0 grade group and I-II grade group (p<0.05), Except for only one area of medial tibial condyle between control group and the experimental group (p=0.03). The surface layer cartilage were statistically significant between each group, middle and deep layer were no statistically significant.Conclusion
T2 mapping imaging, as one of the MRI functional imaging, is sensitive to the changes of early cartilage components in the early stage of HA, hinting that T2 mapping imaging may be used as a tool to diagnose the cartilage disease in the early stage of HA.Acknowledgements
References
[1] Widhalm H K, Apprich S, Welsch G H, et al. Optimized cartilage visualization using 7-T sodium (Na) imaging after patella dislocation[J]. Knee Surg Sports Traumatol Arthrosc, 2014.
[2] Madelin G, Poidevin F, Makrymallis A, et al. Classification of sodium MRI data of cartilage using machine learning[J]. Magn Reson Med, 2015,74(5):1435-1448.
[3] Zbyn S, Brix M O, Juras V, et al. Sodium magnetic resonance imaging of ankle joint in cadaver specimens, volunteers, and patients after different cartilage repair techniques at 7 T: initial results[J]. Invest Radiol, 2015,50(4):246-254.
[4] Zbyn S, Mlynarik V, Juras V, et al. Evaluation of cartilage repair and osteoarthritis with sodium MRI[J]. NMR Biomed, 2016,29(2):206-215.
Figures