5032
Chemical Shift Displacement and Recovery-based Simultaneous Water and Lipid Imaging for Quantitative Multiparametric MRI1Institute of Medical, Pharmaceutical and Health Sciences, Kanazawa University, Kanazawa, Japan, 2Department of Central Radiology, Nagoya City University Hospital, Nagoya, Japan, 3Department of Radiology, Kanazawa University Hospital, Kanazawa, Japan
Synopsis
In general, it is difficult to obtain functional information about water and lipid in tissues at the same time. We, therefore, developed a novel method using chemical shift displacement and recovery-based separation of lipid tissue (SPLIT) with different inversion times, echo times, and b-values to simultaneously acquire diffusion, perfusion, T1, T2, and lipid fraction in the calf. All parameters obtained with the SPLIT were consistent with previously reported values. This method enables simultaneous acquisition of functional information without special pulse sequence.
INTRODUCTION
Functional information about water and lipid in tissues, e.g., diffusion, perfusion, relaxation time, and lipid fraction (LF) obtained with magnetic resonance imaging (MRI), is useful to assess the physiological conditions, physical properties, and tissue metabolism.1-3 However, it is difficult to obtain all this information at the same time.4,5 Therefore, to simultaneously acquire these functional information, we developed a novel method using chemical shift displacement and recovery-based separation of lipid tissue (SPLIT) with different inversion time (TI), echo time (TE), and b-values. Additionally, diffusion, perfusion, T1, T2, and LF in the calf were evaluated.METHODS
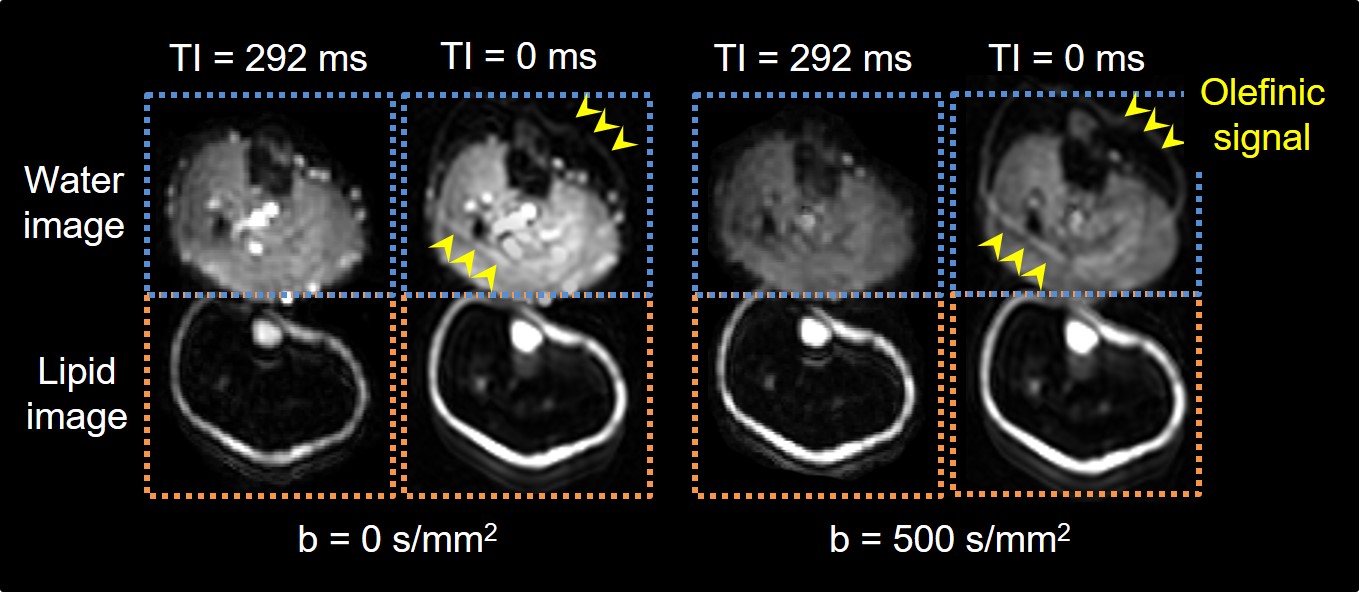
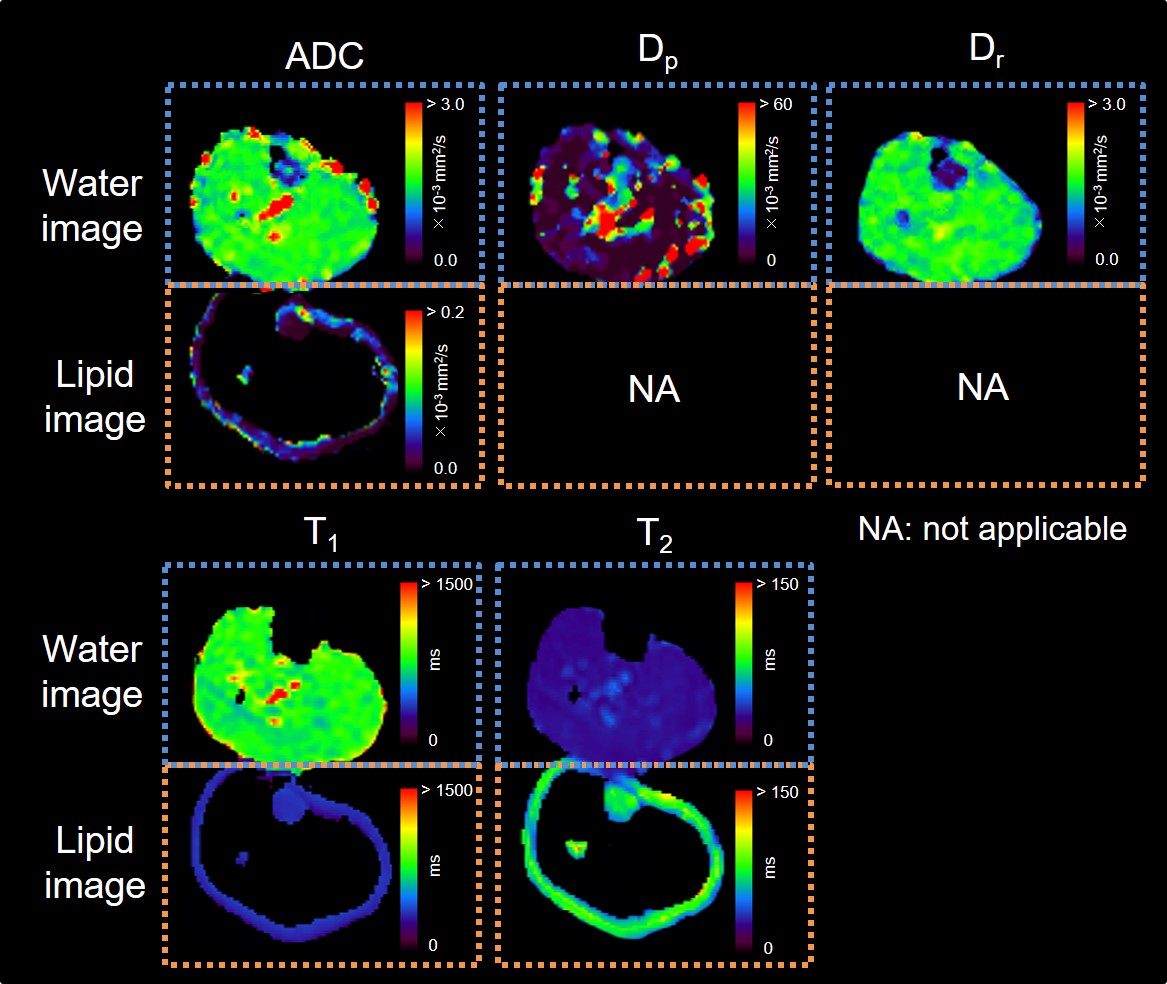
On a 3.0 T MRI, single-shot diffusion echo-planar imaging (SSD-EPI) without fat suppression was used, and the scan parameters were optimized to separate water and lipid images using the chemical shift displacement of lipid signals in the phase-encoding direction, ie., echo spacing, 524 μs; receiver bandwidth, 250 kHz; field of view, 430 mm; TE, 87.7 ms; and b-values, 0 to 3000 s/mm2 (7 points). Moreover, an inversion pulse (TI of 292 ms) was applied to SSD-EPI to remove olefinic signals, which overlaps water signals. Consecutively, SSD-EPI with a b-value of 0 s/mm2 was performed with TI of 0 ms (ie., without inversion pulse) and TE of 31.8 ms for T1 and T2 measurements, respectively. Under these conditions, transverse water and lipid images at the maximum diameter of the right calf were obtained in six healthy subjects. The total acquisition time was 3 min 36 s. Then, T1 and T2 values were calculated from different TI or TE images, and the apparent diffusion coefficient (ADC) was calculated from multiple b-values with a monoexponential fitting for the tibialis anterior muscle (TA), tibialis bone marrow (TB), and subcutaneous fat (SF). Furthermore, perfusion-related and restricted diffusion coefficients (Dp and Dr) with a biexponential fitting were calculated for the TA. The diffusion parameters of the TA were determined at b-values up to 1000 s/mm2 because the signal intensities reached the noise level at a b-value of 3000 s/mm2. Finally, the LF of the TA was determined after T1 and T2 corrections.RESULTS AND DISCUSSION
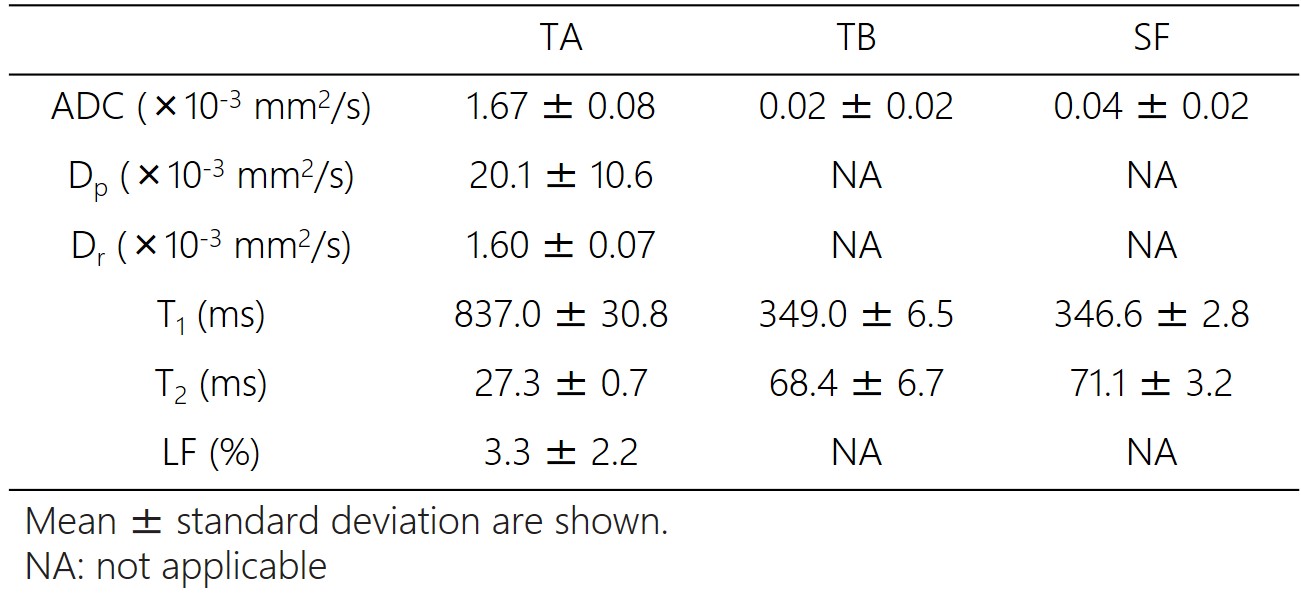
Figure 1 depicts examples of water and lipid diffusion-weighted images using the proposed SPLIT imaging with and without inversion pulse. The SPLIT method allowed sufficient separation of water and lipid images of the calf, and the SPLIT with inversion pulse effectively suppressed olefinic signals. Representative diffusion parameters, T1, and T2 maps for one subject are shown in Figure 2. In addition, the mean ADC, T1, and T2 in the TA, TB, and SF are presented in Table 1. The ADCs of the TB and SF (lipid diffusion) were 0.02 ± 0.02 × 10⁻³ mm2/s and 0.04 ± 0.02 × 10⁻³ mm2/s, respectively, which were much lower than that of the TA (water diffusion, 1.67 ± 0.08 × 10⁻³ mm2/s). Moreover, the Dp, Dr, and LF values of the TA were 20.1 ± 10.6 × 10⁻³ mm2/s, 1.60 ± 0.07 × 10⁻³ mm2/s, and 3.3 ± 2.2%, respectively. All these values were in general agreement with previously reported data obtained from water and lipid images scanned separately,6-9 supporting the validity of our method.CONCLUSION
With our proposed method, it is possible to simultaneously obtain quantitative values concerning diffusion, perfusion, relaxation time, and LF, thereby increasing the amount of functional information about water and lipid in tissues.Acknowledgements
No acknowledgement found.References
1. Liimatainen T, et al. NMR Biomed. 2009; 22: 272-279.
2. Cao P, et al. Magn Reson Med. 2015; 73: 59-69.
3. Biffar A, et al. Invest Radiol. 2011; 46: 601-609.
4. Burakiewicz J, et al. Magn Reson Med. 2015; 73: 964-972.
5. Hamilton G, et al. J Magn Reson Imaging. 2015; 42: 1538-1543.
6. Qi J, et al. J Magn Reson Imaging. 2008; 27: 212-217.
7. Varghese J, et al. NMR Biomed. 2015; 28: 998-1008.
8. Lehnert A, et al. Magn Reson Imaging. 2004; 22: 39-46.
9. Alizai H, et al. Eur Radiol. 2012; 22: 1592-1600.
Figures