5031
Imaging and Quantification of Grafted Mesenchymal Stem Cells in Rat Knee Joint1Radiology, UCSF, San Francisco, CA, United States, 2Center for Musculoskeletal Health, UC Davis, 3Radiology, University of Minnesota
Synopsis
Mesenchymal Stem Cells (MSCs) have high potentials for a treatment of bone diseases. T2*w-MRI in combination with iron labeling of MSCs has shown promising results for the detection of therapeutic cells. However, this method is not applicable for the detection of MSCs in knee joints because both the iron labeled cells and bones produce a hypointense signal. We have shown that the SWIFT sequence overcomes this limitation and generates a distinct and quantifiable signal from iron labeled cells in a knee joint in vivo. Proposed protocol opens new opportunities for in vivo monitoring of cell therapy of bone disorders.
Introduction
Stem cell therapy made a considerable progress for the treatment of neurological, cardiovascular and other disorders [1, 2]. It has been shown histologically that Mesenchymal Stem Cells (MSC’s) have high potentials for a treatment of bone loss diseases such as osteoporosis and osteoarthritis [3, 4]. An injection of MSCs directly into a knee joint has been suggested, as a potential delivery method of the therapeutic cells. Noninvasive technique to observe the delivery and quantification of grafted overtime cells is needed to facilitate the research. Conventional T2*-weighted MRI method was successfully implemented for the detection of grafted cells in brain, spine and muscle tissues. However, this method produces a hypointense signal from both bones and grafted cells, which make the detection and quantification of the grafted cells challenging. Our previous studies indicate that the SWIFT [5] pulse sequence enables to produce a hyperintense signal from iron labeled cells in muscle tissue [6]. In this project, we tested a feasibility of SWIFT sequence to image and quantify an amount of therapeutic cells after administration into a knee joint.Methods
Cell culture: Mouse MSCs were maintained on uncoated flasks in media with DMEM and 10% FBS and labeled with different concentration of Feraheme [7]. Phantoms: 250 µl tubes were filled 0,50, 75,100, 200 µg/ml of Feraheme. MSCs injection: 50 µl of iron-oxide labeled MSCs (incubated with 200 µg/ml of Feraheme overnight) were injected into the knee joint of rats high limbs. Imaging: Three-dimensional gradient echo (GE) TR=10ms, TE=3ms, flip 100 and radial SWIFT images with 2.6 µsec duration of segmented RF pulse with excitation bandwidth of 100 kHz were acquired.Results
Fig.1A
depicts a SWIFT image of a phantom with the different concentrations of the iron
oxide solutions. Distinct hyperintense signals
were detected from all iron concentrations. We implemented variable flip angle
method and generated a color-coded R1-map of the phantom (Fig.1B) [8].
The linear dependence of Feraheme concentration on the longitudinal
relaxivity was observed (Fig.1C).
Fig.2 shows in vivo SWIFT images of a rat knee joint
before (A) and after (B) injection of 107 iron labeled MSCs. A
distinct signal from grafted cells was detected on the SWIFT (B) but not on GE (C)
images. R1 mapping of the tissue enable
us to quantify the amount of iron oxide/grafted cells in the tissue.
Discussion and Conclusion
Bones appear dark on the conventional T2-weighed
MR images which are usually utilized for the detection of iron labeled cells. (Fig2.C).
We have shown that this limitation can be overcome with the SWIFT imaging protocol.
This sequence allowed us to generate a hyperintense MR signal from both iron
labeled cells and knee joint but with different contrast (Fig. 2A). The
labeling MSCs with 200 µg/ml of Feraheme permits
to distinguish grafted cells from surrounding tissue in rat knee joint (Fig.
2B). A linear dependence of iron oxide concentration on R1-relaxivity (Fig.1C) permitted us to quantify the distribution of iron in the knee joint after
administration of the iron labeled cells (Fig.2D), and even better visualize donor cells. In conclusion: the SWIFT sequence
will be very useful in all areas of stem cell therapy, especially for the bone
degenerative diseases where the detection and quantification of therapeutic
cells is particularly challenging.
Acknowledgements
This study was supported by NIH grants R21A06850 (SM), AR043052 (NL), P41 EB015894 (MG). We also would like to thank Sergio B Wong and Tony Huynh for the help with MRI acquisition and animal preparations.References
1. Snyder, E.Y., R.M. Taylor, and J.H. Wolfe, Neural progenitor cell engraftment corrects lysosomal storage throughout the MPS VII mouse brain. Nature., 1995. 374(6520): p. 367-70.
2. Boheler, K.R., et al., Embryonic stem cell-derived cardiomyocyte heterogeneity and the isolation of immature and committed cells for cardiac remodeling and regeneration. Stem Cells Int, 2011. 2011: p. 214203.
3. Guan, M., et al., Directing mesenchymal stem cells to bone to augment bone formation and increase bone mass. Nat Med, 2012. 18(3): p. 456-62.
4. Yao, W., et al., Reversing Bone Loss by Directing Mesenchymal Stem Cells to the Bone. Stem Cells, 2013.
5. Idiyatullin, D., et al., Fast and quiet MRI using a swept radiofrequency. J Magn Reson, 2006. 181(2): p. 342-9.
6. Magnitsky, S., et al., Imaging of Grafted Mesenchymal Stem Cells in Bone Tissue. Proc. Intl.Soc.Mag.Reson.Med., 2015. 15: p. 1020.
7. Frank, J.A., et al., Magnetic intracellular labeling of mammalian cells by combining (FDA-approved) superparamagnetic iron oxide MR contrast agents and commonly used transfection agents. Academic Radiology., 2002. 9(Suppl 2): p. S484-7.
8. Wang, L., et al., T(1) estimation for aqueous iron oxide nanoparticle suspensions using a variable flip angle SWIFT sequence. Magn Reson Med, 2013. 70(2): p. 341-7
Figures
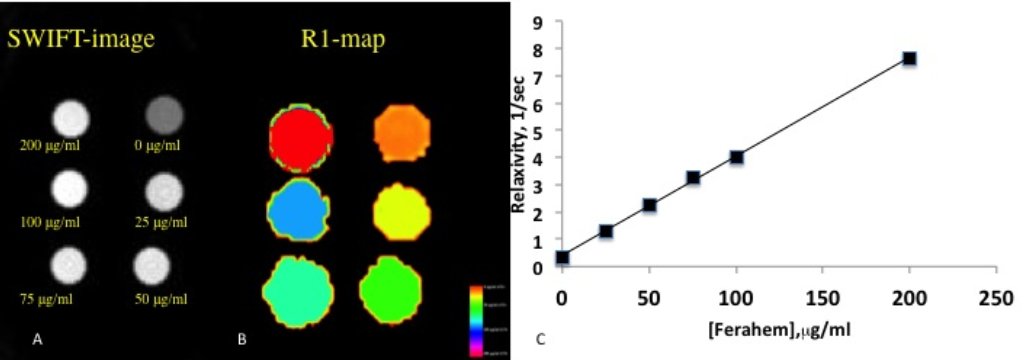
Figure1. Quantification of SWIFT MRI signal.
A– SWIFT MR image (flip angle-20) of the phantom with different concentrations of iron oxide solutions. B– R1 map of the phantom generated with variable flip angle method. C– Longitudinal relaxivity as a function of the iron oxide concentration.
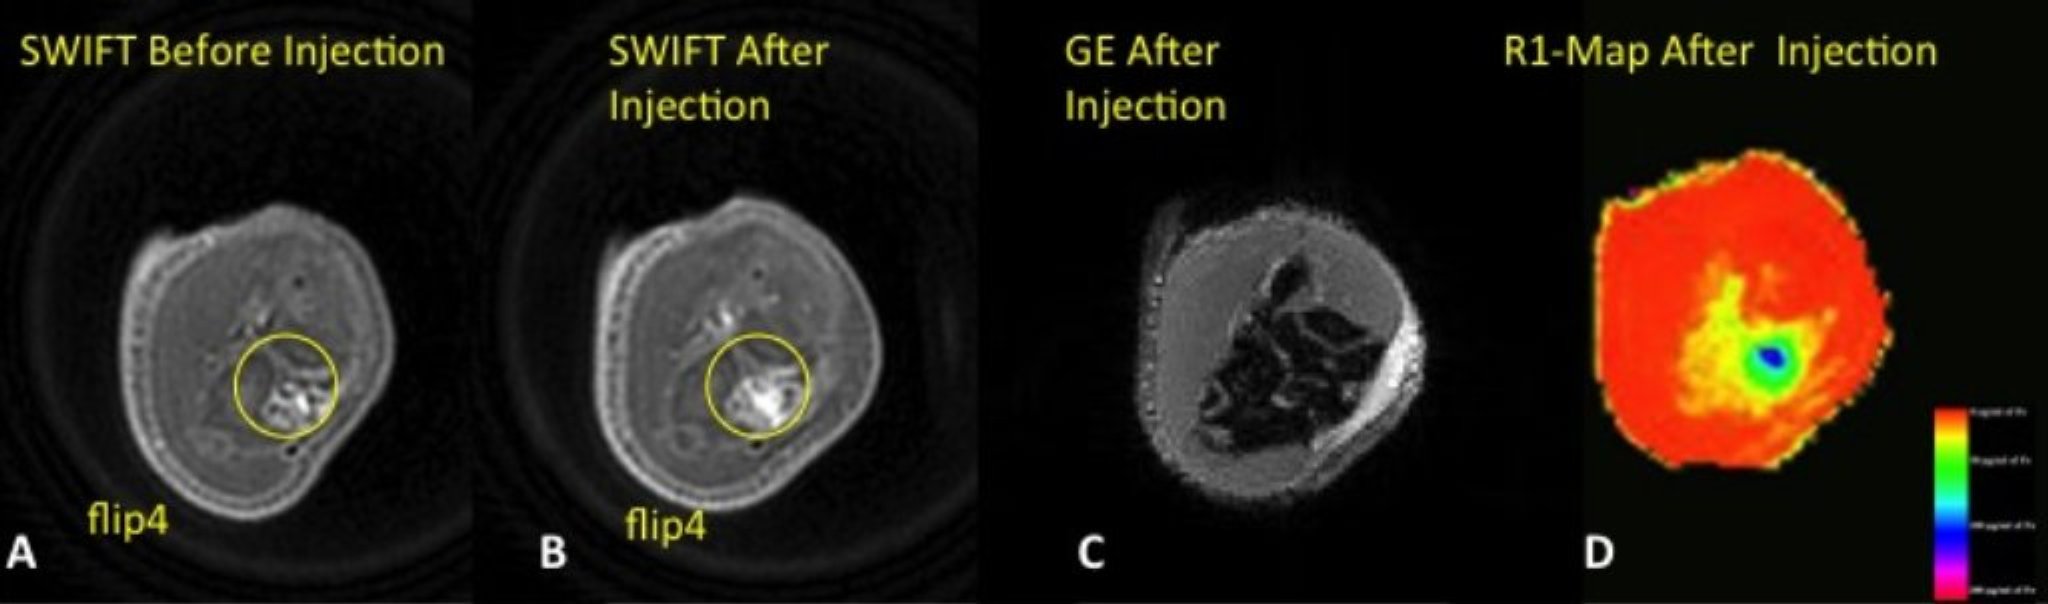
Figure 2. MRI detection and quantitation of grafted MSCs.
In vivo SWIFT MR images of rat knee before (A) and after (B) injection of 10e7 of iron labeled MSCs (200 µg/ml), C-GE image of knee after injection, D – R1-map of the knee after injection.