5030
Initial Experience of MAGiC of the knee at 3T MRI: comparison with conventional T1-weighted image and T2 mapping1Radiology, Ajou University School of Medicine, Suwon, Korea, Republic of, 2MR Applications and Workflow, GE healthcare, Korea, Republic of, 3MR, GE healthcare, Korea, Republic of
Synopsis
Synthetic MR is able to acquire T1-, T2-, proton density-weighted image and quantitative map simultaneously and has the potential to reduce the overall examination time. Synthetic MR image have comparable image qualities with that of conventional MR images for the knee joint.
Introduction
MAGiC (Magnetic Resonance Image Compilation) is a customized version of synthetic MR`s SyMRI IMAGE software, is a breakthrough productivity enhancement. The aim of this study was to compare image quality between synthetic and conventional MR in knee at 3T tesla
METHODS
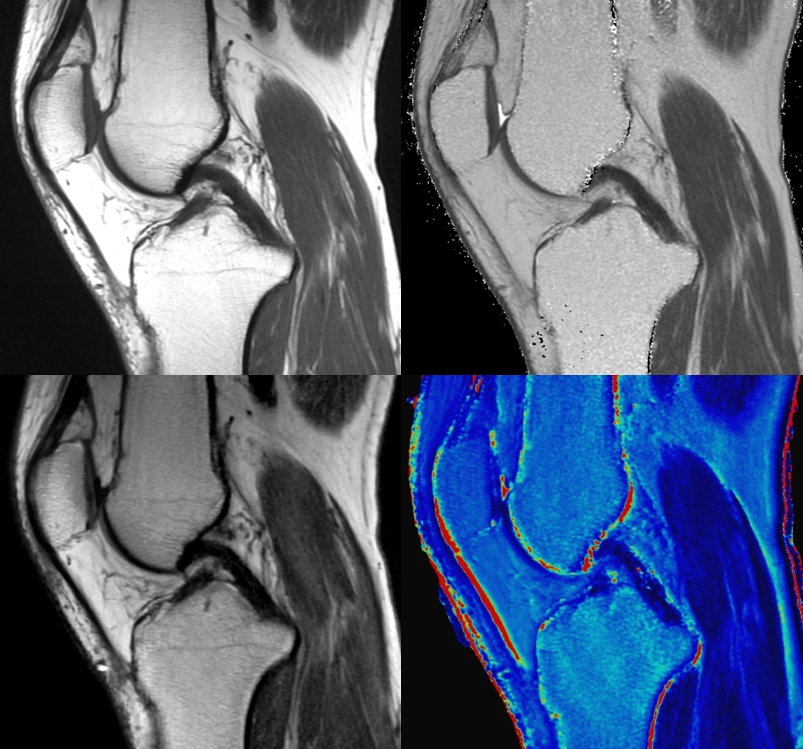
An MR examination was performed on the knee joints of 10 patients using 3T scanner (GE 750w, GE healthcare, Milwaukee, WI) and MAGiC sequence was added to standardized knee MR protocol. Conventional T1-weighted images and fast spin echo (FSE) multi-echo sequence for T2 quantification were acquired on the basis of the standard knee imaging protocol, with section thickness and resolutions matching of synthetic MR sequence. T2 quantification sequences were obtained using a sagittal FSE multi-echo acquisition with eight echo times (7.28, 14.56, 21.84, 29.12, 36.40, 43.68, 50.96, and 58.24 ms). MAGiC sequence was acquired using 2D FSE multi-dynamic, multi-echo sequence with four different delay times and two echoes. Slice thickness was 4 mm and 20 to 24 sagittal sections were collected to cover knee. The scanning time was about 6 minutes. Postprocessing was performed to create synthetic image sets and imaging parameters (TR, TE) were selected to provide similar visual image contrast to conventional T1-weighted image obtained at our institution. The mean relaxation values in T2 map and relative signal intensities of cartilage, subchondral bone, muscle, and the relative signal contrast between structures of the knee were quantitatively measured. The difference between synthetic and conventional sequences was statistically analyzed using the Wilcoxon signed-rank test. p ≤ 0.05 was considered significant.RESULTS
There was no significant difference of mean T2 relaxation values between conventional multi-echo T2 and synthetic T2 mapping, with the exception of subchondral bone. Synthetic T1-weighted images at cartilage and subchondral bone showed slightly higher relative signal intensity and contrast than conventional T1-weighted image, but there was no statistically significant difference, while the relative signal intensity of muscle and relative contrast between subchondral bone and muscle were higher than those of conventional MR.DISCUSSION
We were able to show the potential of synthetic MR in comparison to conventional MR at knee joint. Synthetic MR imaging can be an alternative to conventional MR imaging for generating diagnostic PD-, T1-, and T2-weighted images. Quantitative measurement of T2 relaxation value can be also obtained with a few seconds or processing without any extra scanning time. With further improvements for optimization, it can be able to take advantage of the image quality of musculoskeletal tissue with synthetic imaging.CONCLUSION
Synthetic MR images have comparable relative signal intensity and contrast of anatomic structures with those of conventional MR images for the knee joint.Acknowledgements
No conflicts of interestReferences
1. Granberg T, Uppman M, Hashim F, et al. Clinical Feasibility of Synthetic MRI in Multiple Sclerosis: A Diagnostic and Volumetric Validation Study. AJNR Am J Neuroradiol. 2016;37(6):1023-1029.
2. Betts AM, Leach JL, Jones BV, et al. Brain imaging with synthetic MR in children: clinical quality assessment. Neuroradiology. 2016;58(10):1017-1026.
3. Blystad I, Warntjes JB, Smedby O, et al. Synthetic MRI of the brain in a clinical setting. Acta Radiol. 2012;53(10):1158-63.
Figures
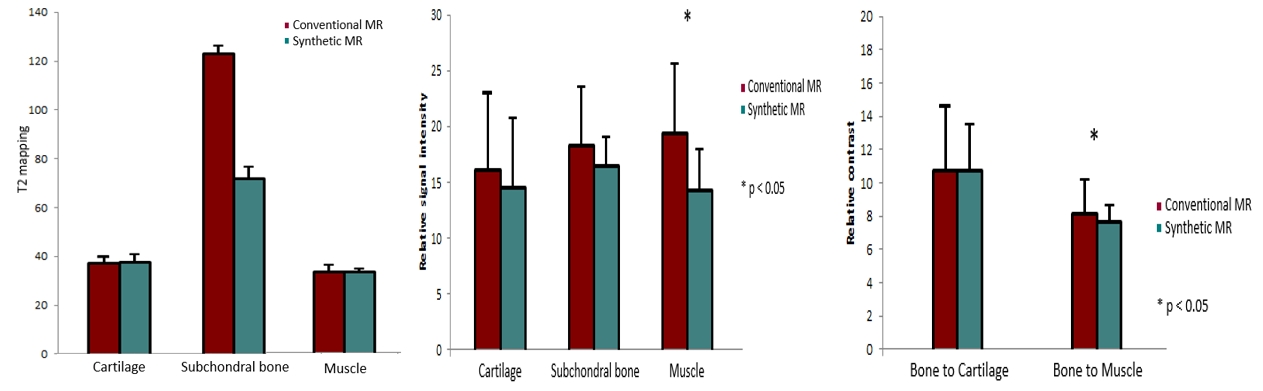
Comparison of T2 mapping, relative signal intensity, and relative contrast of each structures between synthetic and conventional MR images.