5026
Utilization of phase data to improve image contrast in UTE MRI at 3T1Mayo Clinical, Rochester, MN, United States
Synopsis
MR imaging with UTE/ZTE sequences has attracted significant clinical interest in recent years due to their many inherent merits, such as resilience to motion and flow artifacts, capability to achieve high acceleration factors and minimize acoustic noise, as well as capability to capture signal from tissues with ultra-short T2s/T2*s. However, ZTE acquisitions and many UTE acquisitions require the use of low flip angles and, as a consequence, deliver mostly proton density weighted contrast. Magnetization preparation such as fat suppression with UTE/ZTE is time consuming as k-space center data needs to be acquired every TR. Therefore, exploiting the other inherent information such as signal phase is important. In this work, we demonstrate that phase images obtained with UTE can be exploited to enhance the tissue contrast such as fat/water differentiation and enable improved cortical bone visualization, and generate susceptibility map in the volunteer knee on a clinical scanner at 3T.
Introduction
MR imaging with Ultra-short TE(UTE)/Zero TE(ZTE) sequences has attracted significant clinical interest in recent years due to their many inherent merits, such as resilience to motion and flow artifacts, capability to achieve high acceleration factors and minimize acoustic noise, as well as capability to capture signal from tissues with ultra-short T2s/T2*s. However, ZTE acquisitions and many UTE acquisitions require the use of low flip angles and, as a consequence, deliver mostly proton density weighted contrast. Magnetization preparation such as fat suppression with UTE/ZTE is time consuming as k-space center data needs to be acquired every TR. Therefore, exploiting the other inherent information, such as phase, is beneficial (1-4). In this work, we demonstrate that phase images obtained with UTE can be exploited to enhance the tissue contrast such as fat/water differentiation and enable improved cortical bone visualization, and generate susceptibility map in the volunteer knee on a clinical scanner at 3T.Results and Discussion
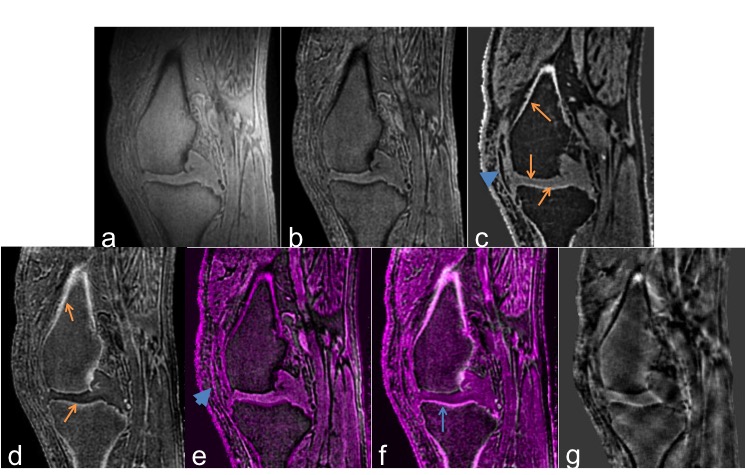
Representative reformatted knee images are shown in Fig. 1. Knee cartilage is depicted in great detail in all images except the intensity inverted image (Fig 1d). Signal intensity variation is clearly seen in the magnitude image (Fig. 1a), which is minimized with the ROI-based intensity correction (Fig 1b). Fat signal is slightly brighter than muscle due to its shorter T1 in the magnitude images and the visualization of the cartilage is obscured by the fat signal. The phase image (Fig. 1c) shows good differentiation between fat (dark) and water (gray) signals and better visualization of the structural features such as cortical bone, which appears bright in the phase image. Alternatively, the signal intensity can be inverted to better visualize the cortical bone structure with bright bone contrast (Fig. 1d). Anatomy details from both magnitude and phase images can be visualized in the composite image (Fig. 1e) simultaneously. Differentiation of fat/water-dominant voxels can be appreciated, which enables better visualization of the cartilage and ligament (arrow heads). Fig. 1f shows the composite image from the intensity inverted magnitude image and the phase image, which demonstrates the positive phase contrast matches the cortical bone well. From the phase image, susceptibility map (Fig. 1g) can be generated, which may potentially provide information on tissue properties such as iron deposition or charge density.Conclusion
Improved image contrast has been demonstrated from a single proton density-weighted human knee acquisition with a UTE sequence by exploiting the phase information. The combination of magnitude and phase images allows complementary anatomical information to be visualized at better contrast. In addition, other tissue properties such as susceptibility can be obtained. The proposed approach could potentially widen the usage of UTE/ZTE MRI in a clinical setting.Acknowledgements
No acknowledgement found.References
1. Haacke et al., AJNR Am J Neuroradiol 2009, 30:19-30. 2. Lu. et al., Magn Reson Med. 2011 66:1582-9 3. Carl et al., Magn Reson Med 2012. 67:991-1003. 4. Lu et al.,in Proc. 22nd ISMRM 2014, P4233. 5. Lu et al.,J Magn Reson Imaging 2008. 28: 190-8. 6. Wiesinger et al., Magn Reson Med 2016; 75:107–114.Figures