5015
Type 2 diabetes alters bone marrow fat content and marrow blood flow as seen by IDEAL-IQ and DCE MRI1Renmin Hospital of Wuhan University, wuhan, People's Republic of China, 2GE healthcare, wuhan, China
Synopsis
To explore the effect of type 2 diabetes on bone marrow fat contnent(BMF) and marrow blood flow, as well as the association of the bone marrow fat contnent and marrow perfusion in type 2 diabetes mellitus (T2DM) patients. 26 healthy nondiabetic subjects and 24 T2DM patients underwent lumbar IDEAL-IQ and DCE-MRI. The marrow fat content(BMF) and the marrow perfusion parameters (Ktrans, Kep, Ve) of lumbar vertebra all showed significant difference between T2DM patients and the healthy individuals. In addition, transfer constant (Ktrans) was negatively correlated with BMF in T2DM patients.
Purpose
Type 2 diabetes mellitus (T2DM) is becoming worldwide issue, it is known that. bone health, vascular and micro-vascular functions are compromised in T2DM patients[1]. However it is desirable to be able to detect the pathological alternations in individual T2DM patients as compared to healthy people in order to assess their health being. In this study, the bone marrow fat content (BMF) and marrow perfusion, as well as their association, are studied using water and fat with echo asymmetry and least-squares estimation (IDEAL-IQ) and Dynamic Contrast Enhance Magnetic Resonance Imaging (DCE-MRI).Methods
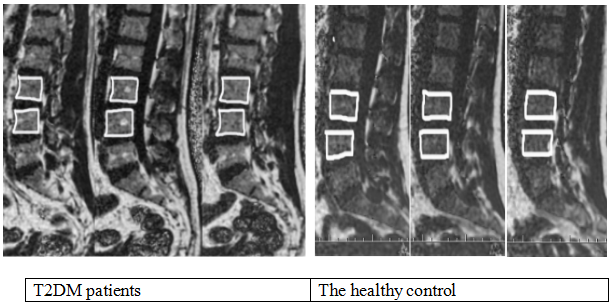
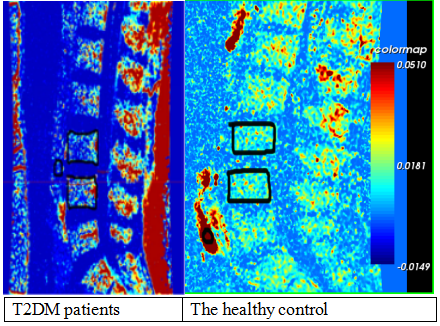
Twenty four T2DM patients diagnosed by clinical assessments (11 male, 13 female, age: 63.83±7.88 years) and 26 healthy non-diabetic subjects(16 male, 10 female, age: 62.27±6.69 years) were enrolled in this study, consent forms were obtained . All the participants underwent MRI scans on a 3.0T whole body scanner. The scans included iterative decomposition of water and fat with echo asymmetry and least-squares estimation (IDEAL-IQ) and Dynamic Contrast Enhance Magnetic Resonance Imaging (DCE-MRI). 48 lumbar vertebral bodies were assessed on T2DM patients and 52 lumbar vertebral bodies were assessed on healthy controls. Final BMF values were obtained by averaging values from the three raw consecutive maps in the center (Figure 1); DCE-MRI parameters (Ktrans, Kep, Ve) were derived using the Tofts pharmacokinetic model [2] in the Omni Kinetics software(Figure 2). The difference of BMF, Ktrans, Kep, Ve between T2DM patients and the healthy individuals were analyzed using two independent sample t test. Bivariate correlation coefficients were used to evaluate the relationship between BMF and Ktrans, Kep, Ve of T2DM patients.Results
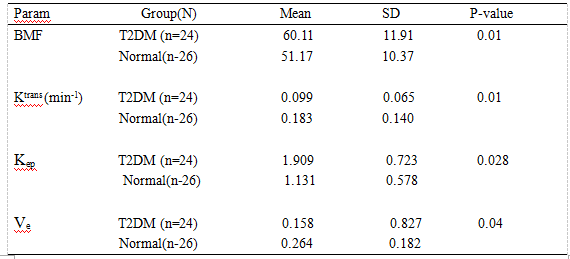
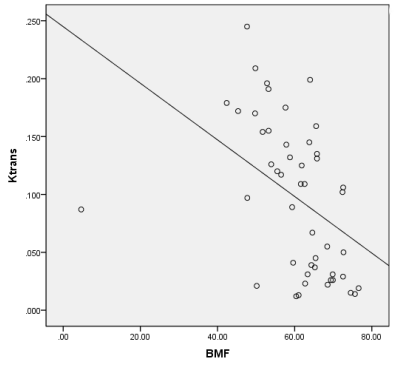
A typical set of the BMF map and the parametric maps from DCE MRI in Fig.1 and Fig.2 respectively. The mean±SD values of BMF and Ktrans, Kep, Ve from 48 lumbar vertebral bodies in T2DM group and 52 lumbar vertebral bodies in healthy nondiabetic group are shown in Table 1. It is seen that The BMF and the parameters of perfusion constant (Ktrans), efflux rate constant (Kep), extravascular extracellular space (Ve) of lumbar vertebra all showed significant difference between T2DM patients and the healthy individuals. Correlation analysis showed that there was a negative correlation between the BMF and Ktrans (r=-0.441, P=0.02), but no correlation was observed with Kep and Ve (P>0.05). The plot showing the correlation between measurements from BMF and is shown in Fig.3.Discussion
Previous work has shown a deterioration of both bone health and general vascular, micro-vascular function during the progression of T2DM. The the hyperglycemia and hyperlipidemia associated with T2DM can stimulate mitochondrial free radical production and alter redox balance to promote endothelial dysfunction in the vasculature[3], which can result in bone marrow perfusion diminishing as well as impaired vascularization and aberrant angiogenesis. This is supported in this study: both Ktrans and Ve, which respectively represents blood flow per unit volume and the volume of extravascular extracellular space(EES) per unit volume, decreased in T2DM patients; kep is the flux rate constant between EES and plasma, which estimates vessel permeability, increased in T2DM patients. A correlation between the BMF and Ktrans in T2DM patients was also seen in this study, which indicated that bone marrow fat abnormality and vascular, micro-vascular dysfunction might be exacerbated by the presence of the other.Acknowledgements
I would like to thank Yunfei Zha professor and study participants for their help and participation on this study.References
[1] Stabley J N, Prisby R D, Behnke B J, et al. Type 2 diabetes alters bone and marrow blood flow and vascular control mechanisms in the ZDF rat[J]. Journal of Endocrinology, 2015, 225(1): 47-58.Paccou J, Hardouin P, Cotten A, et al. The role of bone marrow fat in skeletal health: usefulness and perspectives for clinicians[J]. The Journal of Clinical Endocrinology & Metabolism, 2015, 100(10): 3613-3621.
[2] Tofts P S, Brix G, Buckley D L, et al. Estimating kinetic parameters from dynamic contrast-enhanced T 1-weighted MRI of a diffusable tracer: standardized quantities and symbols[J]. Journal of Magnetic Resonance Imaging, 1999, 10(3): 223-232.
[3] van den Oever IA, Raterman HG, Nurmohamed MT, Simsek S. Endothelial dysfunction, inflammation, and apoptosis in diabetes mellitus. Mediators of inflammation. 2010; 2010:792393.
Figures