5014
Bi-exponential T2* mapping of peripheral nerve from in-vivo human scans with a 3D UTE cones sequence.1Department of Radiology, Stanford university, Palo Alto, CA, United States
Synopsis
Previous studies with nerve samples have demonstrated the existence of multiple signal components with different T2 or T2* relaxation times in peripheral nerves. The short- T2* signal component has received significant research attention, based on its correlation with myelin health of nerve fiber in many neurological diseases. However, little research has been conducted with in vivo human scans to separate the short-T2* component and the long-T2* component in peripheral nerves. Using a 3D ultra-short echo time (UTE) cones sequence, we demonstrate the feasibility of capturing and separating both bi-exponential T2* signal components from in vivo human nerve scans
Purpose
To demonstrate bi-exponential $$$T_2^*$$$ mapping of peripheral nerve with in vivo human scans using a 3D ultra-short echo-time cones sequence.Introduction
Peripheral nerve is composed of layers of connective sheaths surrounding nerve fiber as shown in Figure 1A. Water molecules trapped in these layers and the myelin sheath of nerve fiber may exhibit different $$$T_2/T_2^*$$$ relaxation properties. In fact, previous studies demonstrated the existence of multiple $$$T_2/T_2^*$$$ signal components in in vitro nerve samples and in vivo animal nerves1-4. In particular, the short-$$$T_2^*$$$ component has received considerable attention because of its correlation with the health of myelin sheath, which is very important in evaluating many neurological diseases. However, to our knowledge, few in vivo human studies have been conducted to separate short and long $$$T_2^*$$$ signal components in peripheral nerves. In this abstract, we demonstrate the result of bi-exponential $$$T_2^*$$$ mapping with in vivo human nerve scans using a 3D UTE cones sequence5.Methods
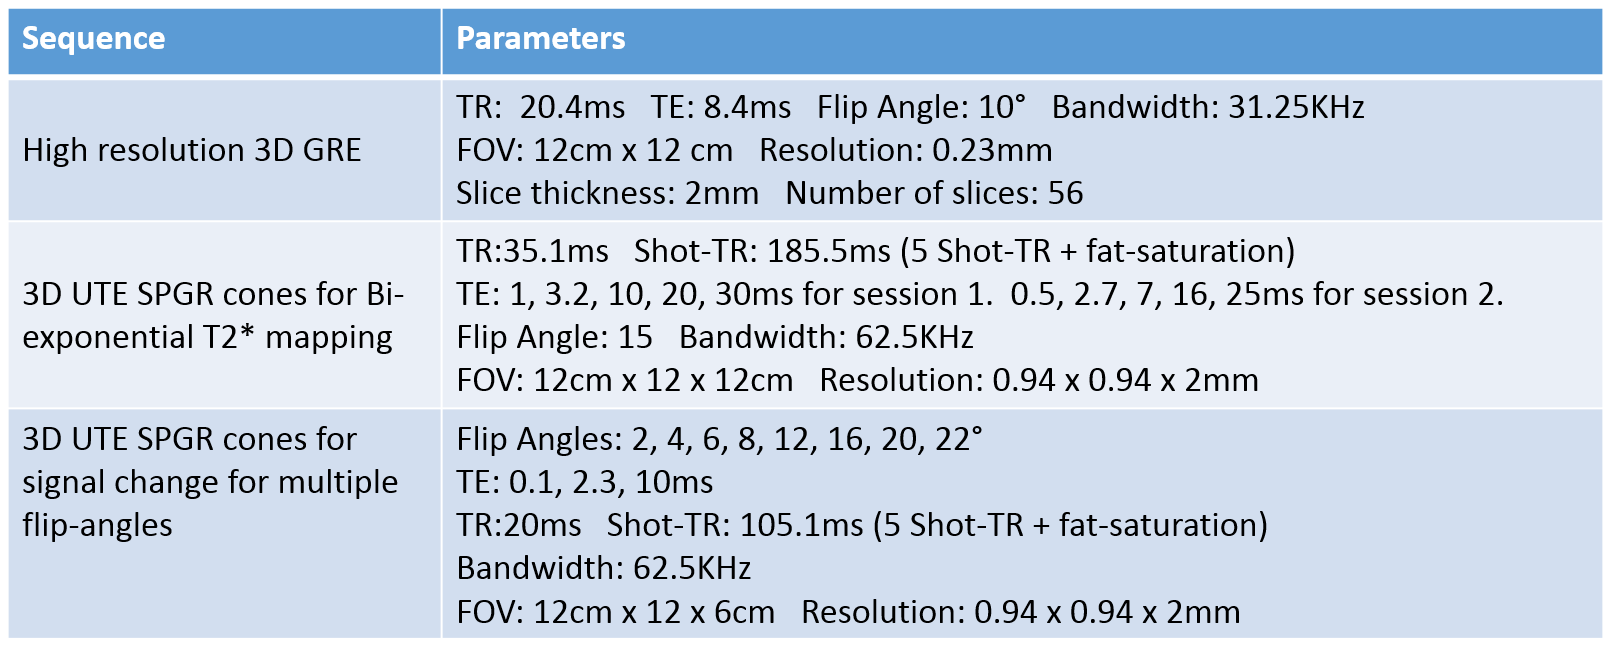
We conducted bi-exponential $$$T_2^*$$$ mapping on tibial nerve in human ankle. We scanned a normal volunteer on a 3T GE Discovery 750 MRI scanner with a 16 channel flex coil. For anatomic information, we collected high resolution 3D GRE images.
We performed two sessions of the 3D UTE cones sequence where each session collected signal at 5 different TEs. For fitting with the resulting magnitude images, we adopted a bi-exponential model, $$$y(n) = A_se^{-TE(n)/T_{2,s}^*}+A_le^{-TE(n)/T_{2,l}^*}+C$$$. TE(n) and y(n) are the n-th echo time and the magnitude signal at the n-th echo time, the $$$T_{2,s}^*$$$and $$$T_{2,l}^*$$$ are the short and long component of $$$T_2^*$$$. As and Al are the amplitudes of short and long $$$T_2^*$$$ decay components, and C is the noise offset in the magnitude signal. To estimate these parameters, we first used later echoes to fit the long-$$$T_2^*$$$ component where we can assume the short-$$$T_2^*$$$ component decayed sufficiently to be negligible. Next, we subtracted the estimated long-$$$T_2^*$$$ component from early echoes, and used these processed echoes to fit the short-$$$T_2^*$$$ component. This segmented fitting approach was previously performed in bi-exponential decay fitting for IVIM6. A non-negative least squares method was adopted for all parameter fitting, and it was performed on the averaged magnitude signal on the ROI of tibial nerve. Figure 2 summarizes the scan parameters of the high-resolution GRE sequence, and the multi-echo UTE cones sequence.
In addition, we repeated the 3D UTE cones sequence with different flip angles to investigate how the amplitude of each $$$T_2^*$$$ component changes. For this experiment, we only acquired 3 echoes in each sequence, and used the values estimated in the previous experiment to determine only the amplitudes (As and Al) and the noise offset (C).
Results and Discussion
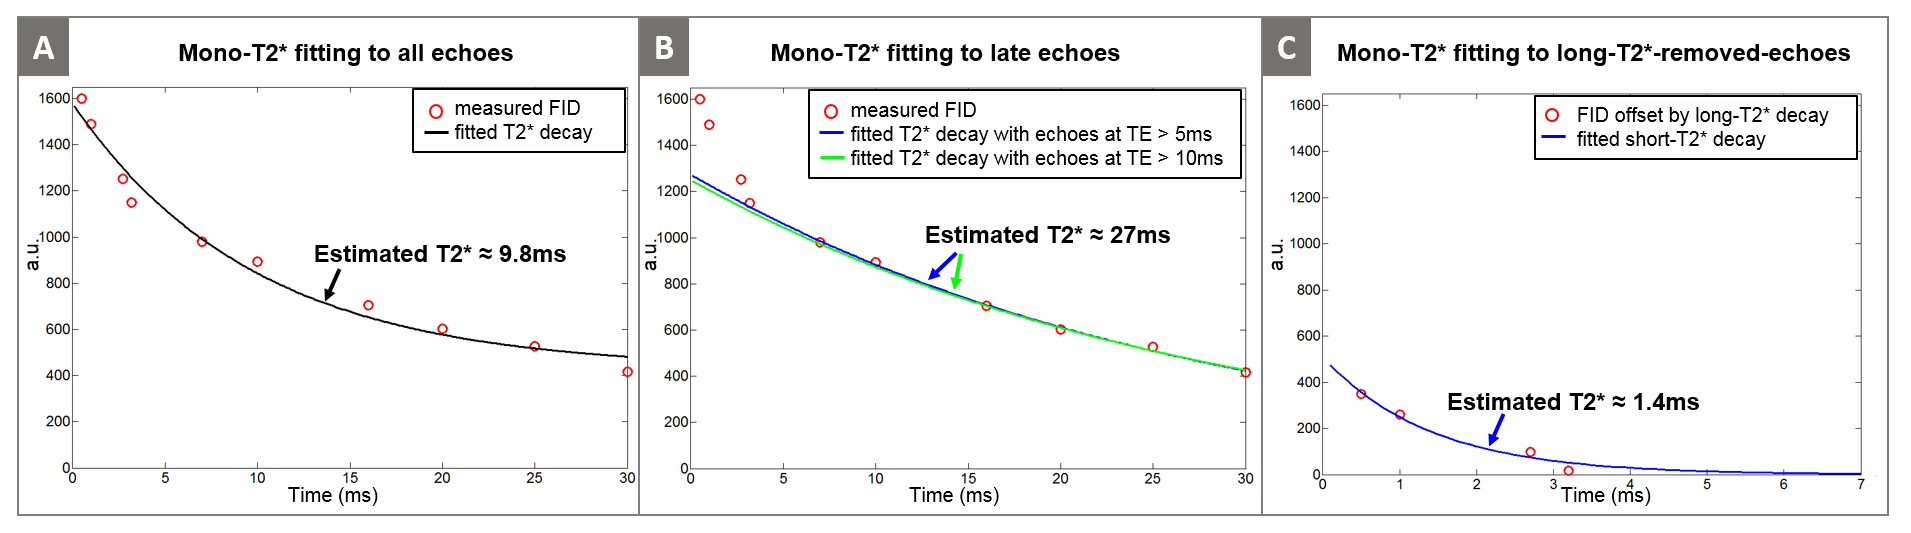
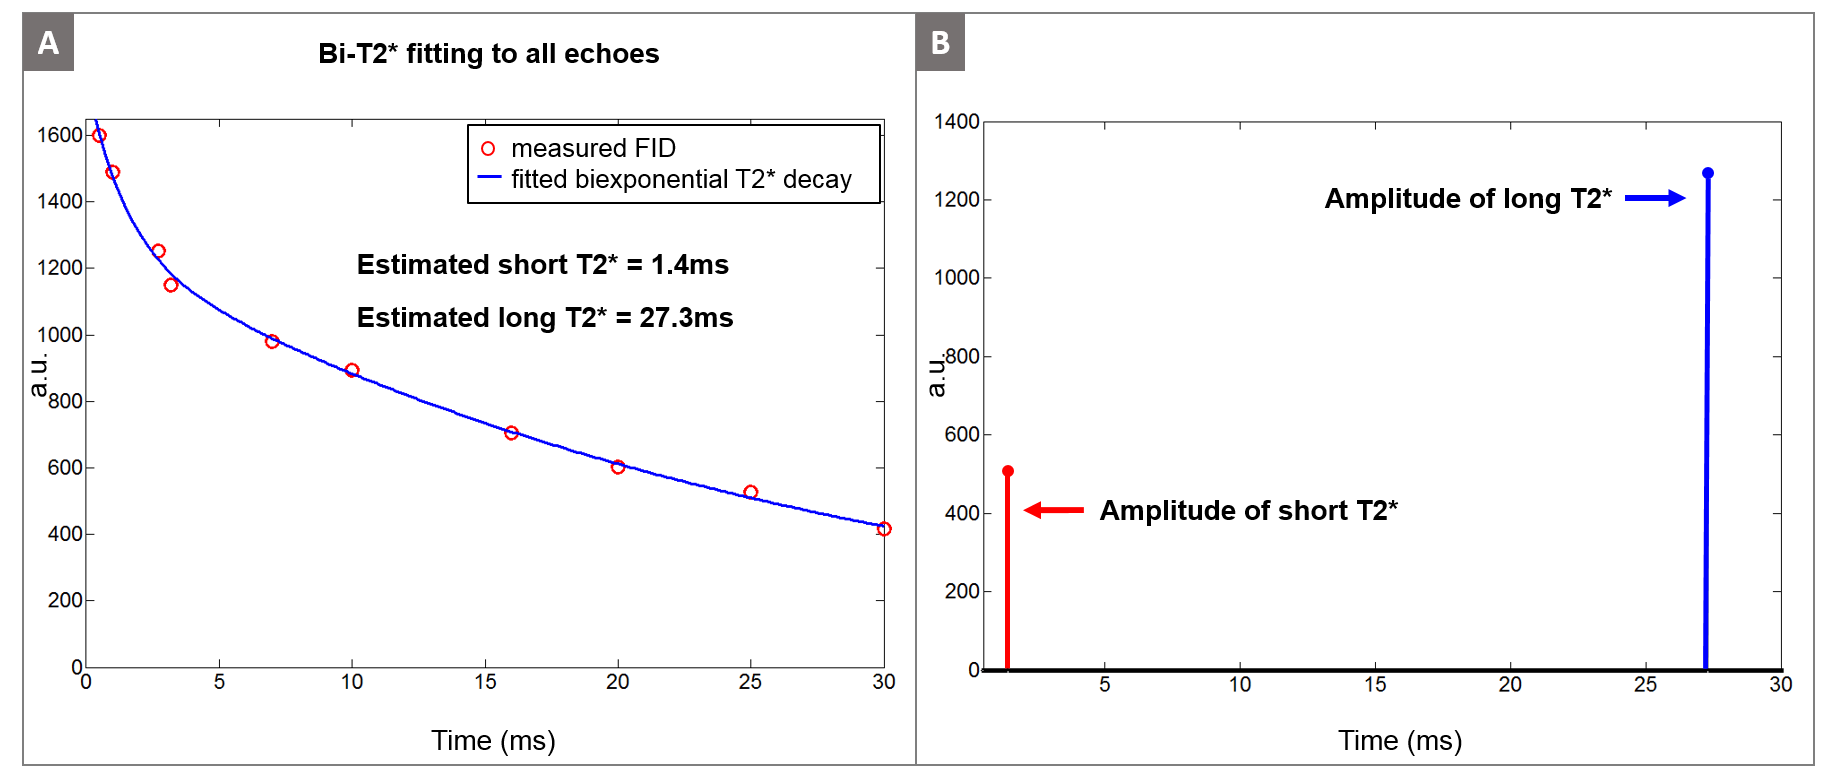
The high resolution GRE image in Figure 1B shows the tibial nerve in the yellow box, where we performed the bi-exponential $$$T_2^*$$$ mapping. Figure 3A shows the mono-exponential $$$T_2^*$$$ fitting result using all 10 echoes, yielding $$$T_2^*$$$ of 9.8ms. However, the mono-exponential $$$T_2^*$$$ fitting with later echoes (TE > 5ms and TE > 10ms) yields $$$T_2^*$$$ of about 27ms, suggesting the existence of very short-$$$T_2^*$$$ decay signal in the early echoes. Figure 3C illustrates the mono-exponential $$$T_2^*$$$ fitting with early echoes (TE < 4ms) where we subtracted the long-$$$T_2^*$$$ component ($$$T_2^*$$$= 27ms) before fitting. The short-$$$T_2^*$$$ estimated from these processed early echoes was 1.4ms. The estimated short-$$$T_2^*$$$ value (1.4ms) indicates that signal sampling at ultra-short echo time with the UTE sequence is very important in robust separation of short and long $$$T_2^*$$$ components. Figure 4A illustrates the estimated bi-exponential $$$T_2^*$$$ decay curve, which is a simple sum of short and long $$$T_2^*$$$ decays determined in the previous step. Figure 4B shows the amplitude of the estimated $$$T_2^*$$$ components (As and Al), where the long-$$$T_2^*$$$ component was the more dominant of the two.
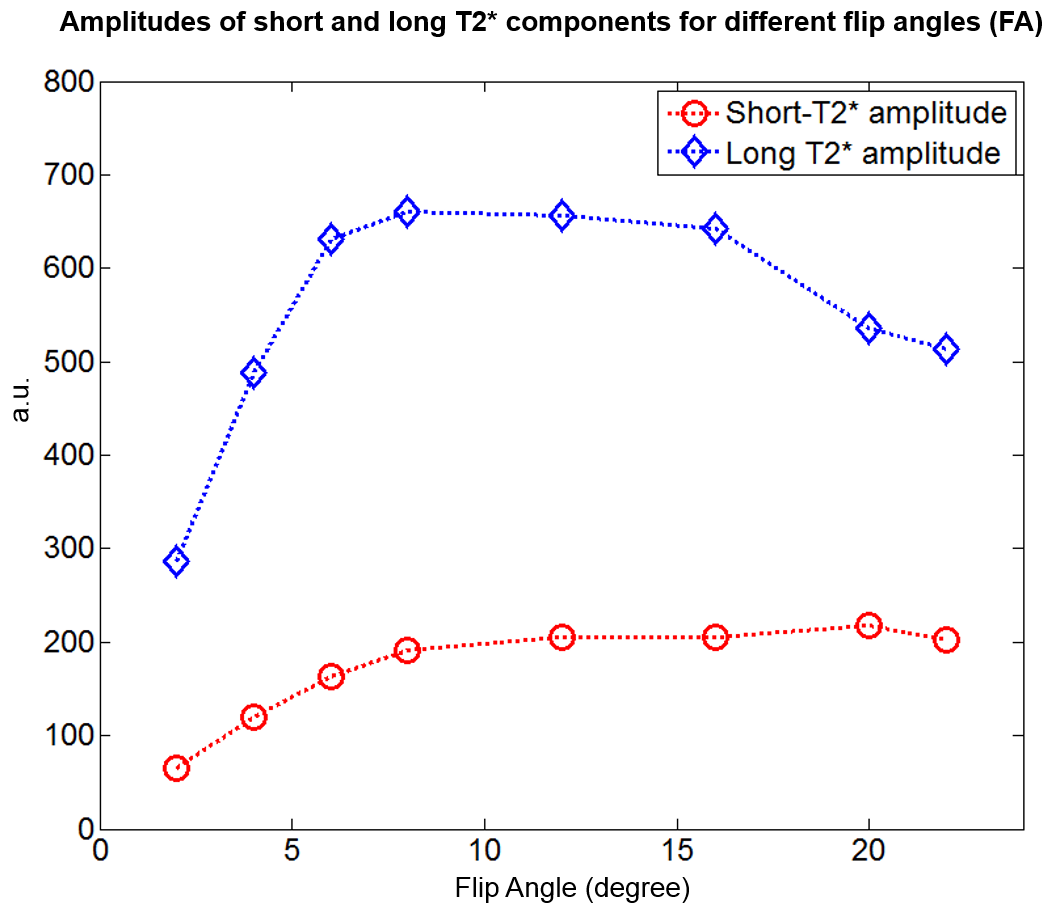
Finally, Figure 5 demonstrates the amplitude of each $$$T_2^*$$$ component for different flip angles. The peak of the long-$$$T_2^*$$$ component was between 8° and 12° while the peak of the short-$$$T_2^*$$$ component was at 20°. This suggests a noticeable difference in T1 between these two $$$T_2^*$$$ components and the possibility of selectively suppressing the long-$$$T_2^*$$$ component with inversion recovery methods5,7.
Conclusion
In this abstract, we have demonstrated the feasibility of bi-exponential $$$T_2^*$$$ mapping for peripheral nerves with in vivo human scans using a 3D UTE cones sequence to separate the short-$$$T_2^*$$$ signal component ($$$T_2^*$$$ = 1.4ms) and long-$$$T_2^*$$$ signal component ($$$T_2^*$$$ = 27.3ms).Acknowledgements
NIH R01 AR0063643, NIH P41 EB015891, GE HealthcareReferences
1. C. Beaulieu, F. R. Fenrich, and P. S. Allen. Multicomponent water proton transverse relaxation and T2-discriminated water diffusion in myelinated and nonmyelinated nerve. Magn. Reson. Imaging., 16:1201–1210, 1998.
2. M. D. Does, and R. E. Snyder. T2 relaxation of peripheral nerve measured in vivo. Magn Reson Imaging., 13:575–580, 1995.
3. S. Webb, C. A. Munro, R. Midha, and G. J. Stanisz. Is Multicomponent T2 a Good Measure of Myelin Content in Peripheral Nerve? Mag. Res. in Med., 49:638–645, 2003.
4. R. A. Horch, J. C. Gore, M. D. Does. Origins of the Ultrashort-T21H NMR Signals in Myelinated Nerve: A Direct Measure of Myelin content? Magn. Res. Med., 66:24-31, 2011.
5. J. Chen, M. Carl, Y. Ma, H. Shao, X. Lu, B. Chen, E.Y. Chang, Z. Wu, and J. Du. Fast volumetric imaging of bound and pore water in cortical bone using three-dimensional ultrashort-TE (UTE) and inversion recovery UTE sequences. NMR. Biomed., 10:1373-80, 2016.
6. E. E. Sigmund, G. Y. Cho, S. Kim, M. Finn, M. Moccaldi, J. H. Jensen, D. K. Sodickson, J. D. Goldberg, S. Formenti, and L. Moy. Intravoxel incoherent motion (IVIM) imaging of tumor microenvironment in Locally Advanced Breast Cancer. Mag. Res. Med., 65(5):1437-1447, 2011.
7. S. Oh, M. Bilello, M. Schindler, C. E. Markowitz, J. A. Detre, and J. Lee. Direct Visualization of Short Transverse Relaxation Time Component (ViSTa). Neuroimage., 83:485-492, 2013.
Figures