5010
Quantitative NMR imaging of short and long T2 components in the SKM tissue by 1H T2- relaxometry study1Institute of Myology, NMR Laboratory, Paris, France, 2CEA, DRF, I²BM, MIRCen, Paris, France, 3CRIS, Tournai, Belgium
Synopsis
Muscle water T2 is currently being used to assess and monitor the pathology of neuromuscular disorders. The vascular signal of water T2 is close to the one of fat, which might have an impact on the fat fraction quantification using a 2-component fitting approach on MSME data. Here, we examined the impact of long water T2 variations during exercise on fat quantification using the 2-component extended phase graph (EPG) model. Exercise increased the short T2 and the ratio between the amplitudes of short and long T2 signals suggesting an impact of the vascular space on the fat fraction quantification.
Purpose
Muscle water T2 is currently being used to assess and monitor pathological conditions like necrosis, inflammation, oedema and membrane integrity, all characteristics of neuromuscular disorders1. Measurements are often derived from a standard multi-slice multi echo (MSME) sequence. However, in the presence of fatty degenerative changes within the muscle, the longer T2 of fat compared to the one of water leads to the measurement of a global T2 that only reflects the fat content in tissue if a single-component fit is applied on non-fat suppressed echo trains. As a consequence, potential alterations in the muscle water T2 are masked. Recently, novel approaches was proposed to simultaneously assess water T2 and fat fraction (FF) in skeletal muscle using either a tri-exponential fit of water and fat T2 decay or a 2-component extended phase graph (EPG) algorithm that models the signal evolution during a multi-echo acquisition in the presence of fat2,3. The latter approach also considered the B1 variations present at high field across large fields of view. It is also known that water T2 in skeletal muscle also has a multi-component behaviour with a long T2 of about 130ms, supposedly arising from the vascular compartment4,5. Because this vascular signal is a T2 value close to the one of fat, it might confound fat fraction quantification when the 2-component fitting approach is performed on MSME data. In this study, we examined the impact of long water T2 variations on fat quantification using the 2-component EPG model previously proposed.Methods
All examinations were performed at 3T (Prisma, Siemens), with the body transmitter coil and one phased array coil wrapped around the right lower leg. Eight healthy volunteers were scanned at rest and after an exercise protocol consisting of an 8-minute dorsiflexion bout realized inside the scanner on an amagnetic ergometer. An MSME sequence was acquired with the following parameters: TR=3000ms; nominal FAs of 90° and 180°, a train of 32 echoes with TEs ranging from 15ms to 480ms, Tacqu: 3min41sec. The signal evolution was modelled using an EPG algorithm as previously proposed with a 2-component model. For each pixel, long and short T2 values, and corresponding proton densities were estimated. From these, the long T2 fraction was calculated. A 3-D gradient echo sequence with three TEs (TE1/TE2/TE3/TR=2.75/3.95/7.55/6.95ms and FA 12°, Tacq=2min48s) was also acquired to measure FF with a standard 3-pt Dixon method6. On two volunteers, a SATIR sequence with a radial FLASH readout (ES=5.22ms, evolution time=820ms, FA 12°, 8NEX, Tacqu=16sec) was acquired at different time points after exercise in order to monitor muscle perfusion7. NMR parameters were measured in ROIs manually drawn in the soleus (SL) and tibialis anterior (TA) muscle.Results
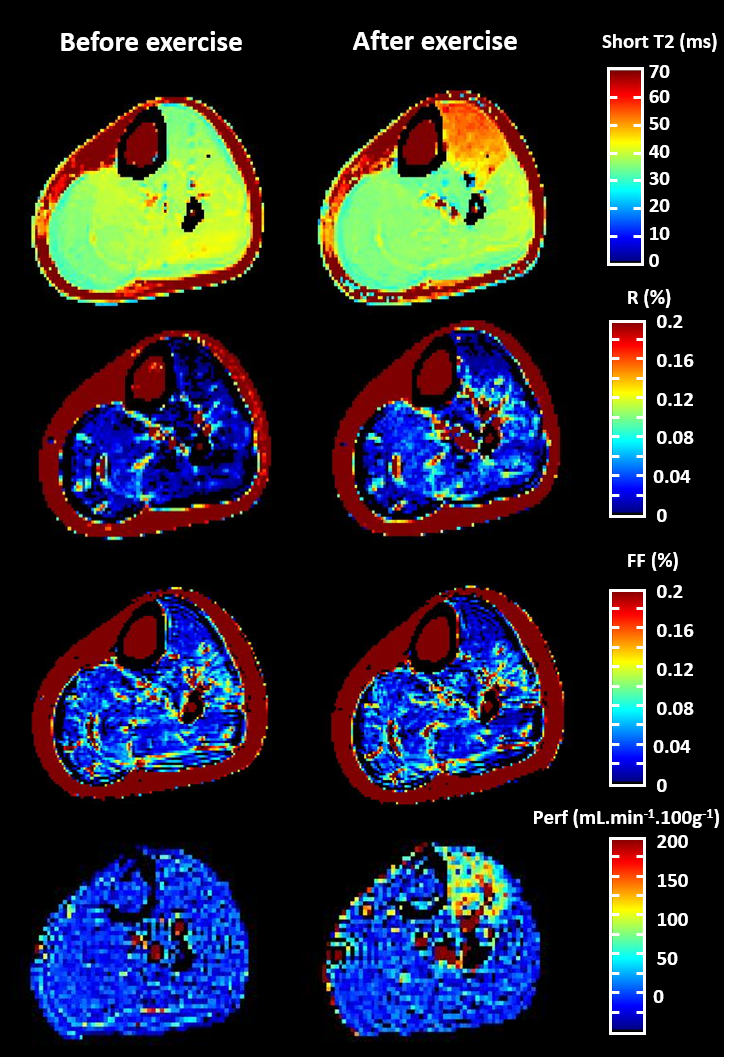
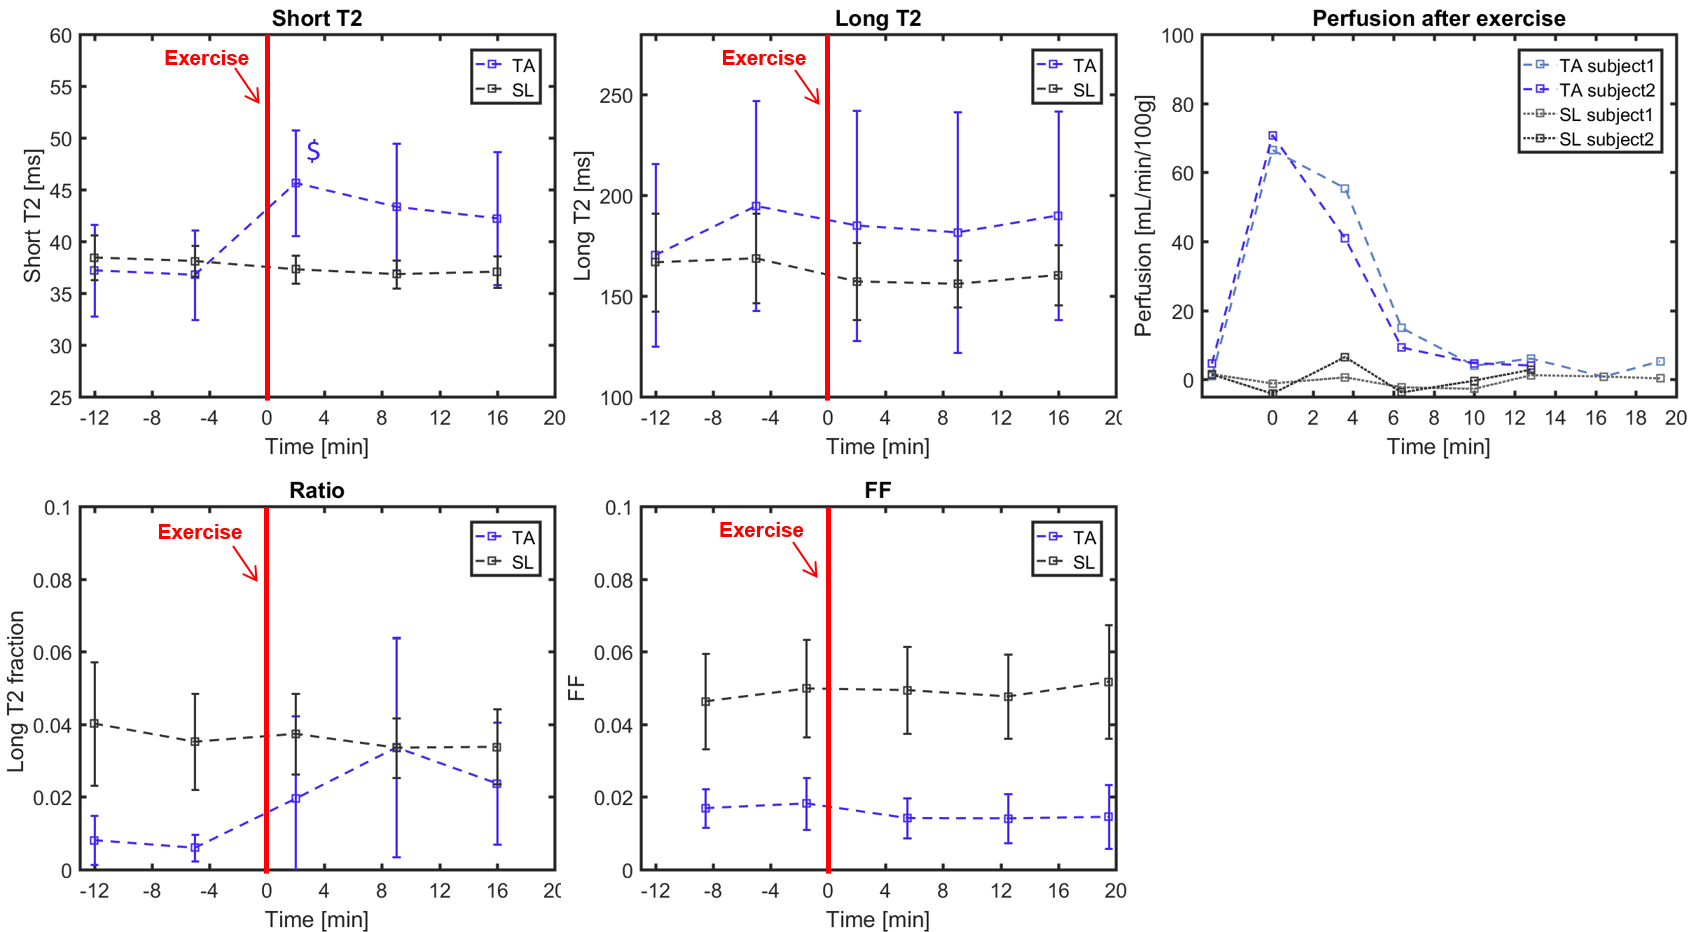
Figure 1 displays the different parametric maps obtained for one volunteer (short T2, long T2 fraction, Dixon FF and perfusion). They showed increased short T2 and perfusion values in the exercised muscle. On this subject, a slight increase in long T2 fraction and a more subtle decrease in FF derived from the DIXON approach were also observed. On the 8 subjects, the maximum short T2 increase was measured immediately after the end of the bout (Figure 2). A high variability on the long T2 values was observed between subjects, without specific trend. The Dixon FF seemed to slightly decrease in the TA after exercise. In contrast, the long T2 fraction was increased by exercise and reached a maximum at the second time point (about 7 minutes after the end of exercise). The perfusion was highly increased right after the exercise and resumed baseline within about 8 minutes, much more rapidly than short T2 values.Discussion and conclusion
In this study, a 2-component EPG approach was used to fit long and short T2 of healthy muscle during exercise. We observed an increase in short T2 values and in the long T2 fraction in the recruited muscles. These two observations might be explained by a concomitant expansion of intracellular and vascular space. The increase in perfusion was only observed for some minutes after exercise while long T2 fraction remained high for a longer period. These variations in vascular water content might confound fat fraction quantification if a 2-component EPG model is used in fatty infiltrated muscles, but we showed that the effects remain relatively low. On the other side, the concurrent method are not free from this phenomenon: we observed in this study that FF derived from Dixon acquisitions decreases after the exercise. This had also been demonstrated in Duchenne patients8.Acknowledgements
No acknowledgement found.References
1. Carlier PG, Azzabou N, de Sousa PL, et al. Skeletal muscle quantitative nuclear magnetic resonance imaging follow-up of adult Pompe patients. J Inherit Metab Dis. 2015;38(3):565-572.
2. Azzabou N, Loureiro de Sousa P, Caldas E, Carlier PG. Validation of a generic approach to muscle water T2 determination at 3T in fat-infiltrated skeletal muscle. J Magn Reson Imaging. 2015;41(3):645-653.
3. Marty B, Baudin P-Y, Reyngoudt H, et al. Simultaneous muscle water T 2 and fat fraction mapping using transverse relaxometry with stimulated echo compensation. NMR Biomed. 2016;29(4):431-443.
4. Araujo ECA, Fromes Y, Carlier PG. New Insights on Human Skeletal Muscle Tissue Compartments Revealed by In Vivo T2 NMR Relaxometry. Biophys J. 2014;106(10):2267-2274.
5. Saab G, Thompson RT, Marsh GD. Multicomponent T 2 Relaxation of In Vivo Skeletal Muscle. Magn Reson Med. 2000;157(1999):150-157.
6. Glover GH, Schneider E. Three-point Dixon technique for true water/fat decomposition with B0 inhomogeneity correction. Magn Reson Med. 1991;18(2):371-383.
7. Raynaud JS, Duteil S, Vaughan JT, et al. Determination of skeletal muscle perfusion using arterial spin labeling NMRI: Validation by comparison with venous occlusion plethysmography. Magn Reson Med. 2001;46(2):305-311.
8. Fischmann A, Kaspar S, Reinhardt J, Gloor M, Stippich C, Fischer D. Exercise might bias skeletal-muscle fat fraction calculation from Dixon images. Neuromuscul Disord. 2012;22:S107-S110.
Figures