5008
Heterogeneity of Quadriceps Muscle Activation during Isometric Contractions as revealed by Velocity Encoded Phase Contrast (VE-PC) Imaging.1Hyogo University of Teacher Education, Katō, Hyōgo, Japan, 2Physics, UC San Diego, San Diego, CA, United States, 3The University of Jyväskylä, Jyväskylä, Finland, 4Radiology, UC San Diego, San Diego, CA, United States
Synopsis
The relative contributions of the four compartments of the quadriceps to force production are clinically very important information. The spatial and temporal heterogeneity of velocity and strain, (surrogate biomarkers of neural activation) was determined, within and between different compartments of normal quadriceps and along the proximo-distal (Z) axis, during isometric contraction using gated VE-PC imaging. Statistically significant differences were determined, within the same muscle compartment, across compartments and between different Z axis positions. Determining how these change in the diseased state e.g. post-ACL tear will be important in tailoring rehabilitative strategies, with particular relevance to preventing early onset of osteoarthritis.
Introduction
The main knee extensor muscle, the quadriceps, plays an extremely critical role in various aspects of human locomotion. Changes in its function from various disease such as aging, muscular disuse or modified gait after ACL injury can severely degrade mobility and quality of life1. Clinically it is important to elucidate the relative contributions of its four different compartments, the Vastus Lateralis (VL), vastus medialis (VM), vastus intermedius (VI) and rectus femoris (RF), to force production in normal and diseased conditions.Aim
To quantify the spatial and temporal heterogeneity of velocity and strain, which are surrogate biomarkers of neural activation, within and between the different compartments of the normal quadriceps, during isometric contraction using gated VE-PC imaging.Methods
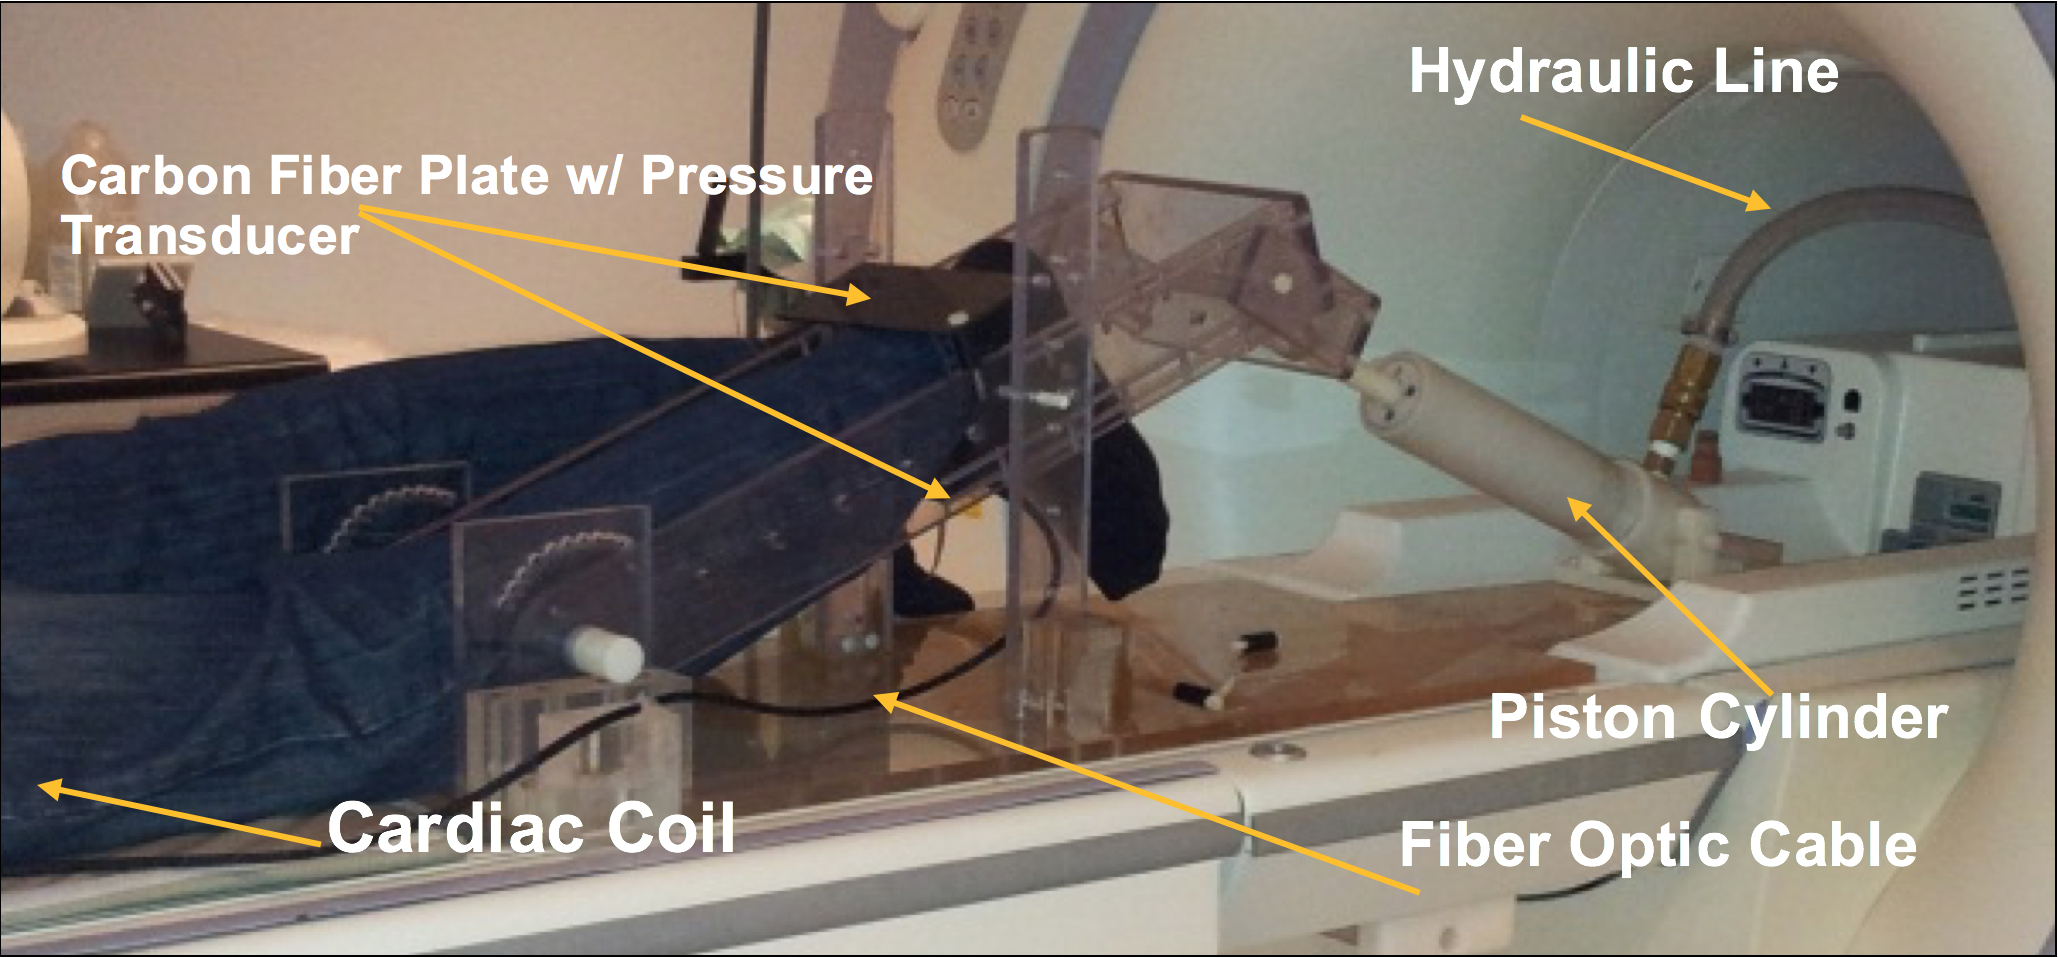
Seven healthy male subjects (Mean Age: 27.0+7.1yr), were scanned on a 1.5T GE scanner, after signing an IRB consent form. A earlier version of our apparatus used for the lower leg was modified2 (Fig.1), to image the thigh during isometric contractions, with the subject lying feet-first, prone, and a multi-channel cardiac coil positioned on the center of the femur. The tibia rested on a carbon-fiber plate held by acryclic arms whose inclination could be changed to vary the knee joint angle, held at 19.5o for these experiments. A fiber-optic pressure sensor glued on its lower side sensed the pressure exerted by the subject, who followed a visual target-force-level cue, as well as the actual force he exerted in real-time for visual feedback, in order keep force level consistent through the ~78 cycles, all executed at 40% Maximum Voluntary Contraction. VE-PC scans were collected at the middle of thigh, and 17.5% proximal and distal to the mid-point. The VE-PC scans were velocity encoded in all 3 directions to 10cm/s, with TE/TR: 6.3/24.2ms, 256x256 matrix, 4 views per segment, 5 mm slice thickness, 20x14cm FOV, gated with 22 phases per cycle of ~3 sec. The phase-contrast images were post-processed2 for phase-shading artifacts, ROI’s placed on different muscle compartments (VL, RF, VI, VM). Data are reported as means+SD, with one-way ANOVA with repeated measure and a Bonferroni post-hoc test performed to test for significant differences of displacement between muscles and between positions.Results
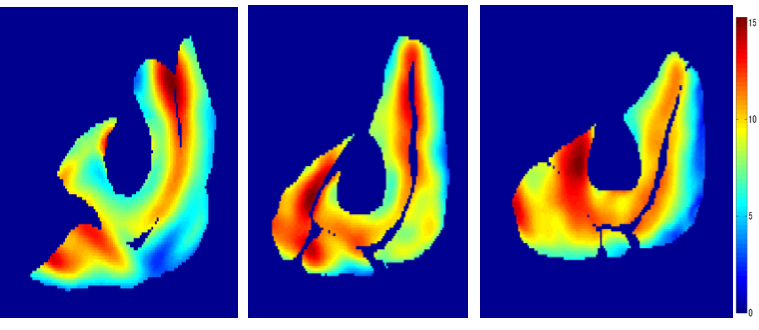
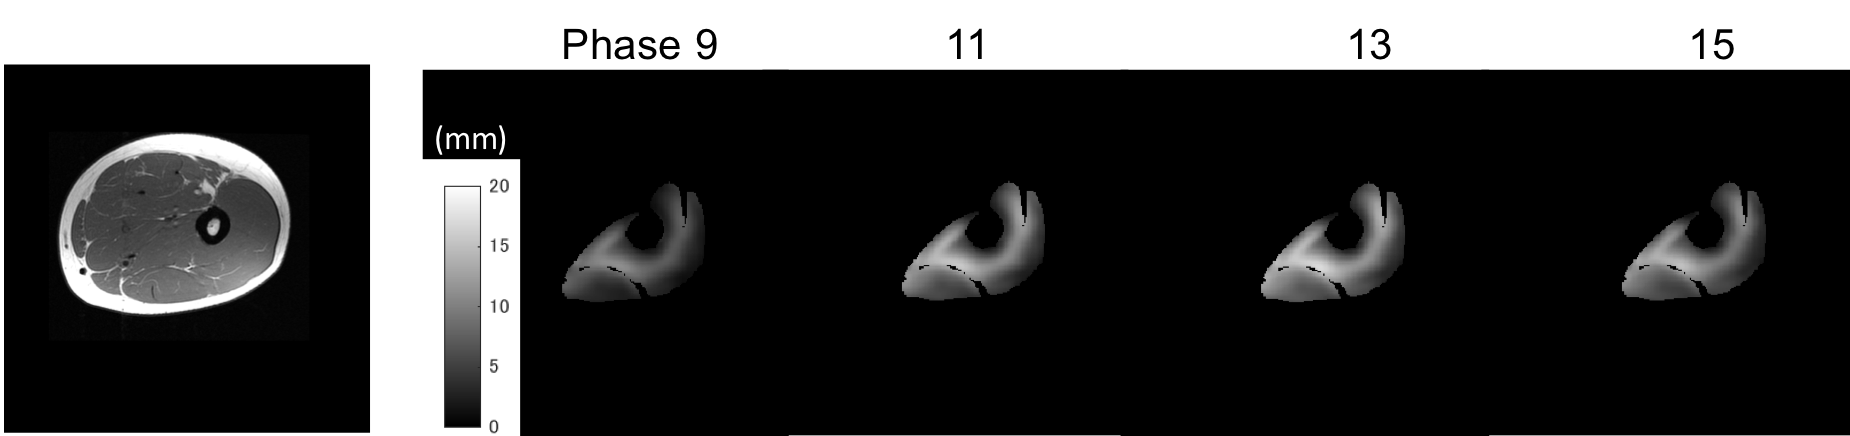
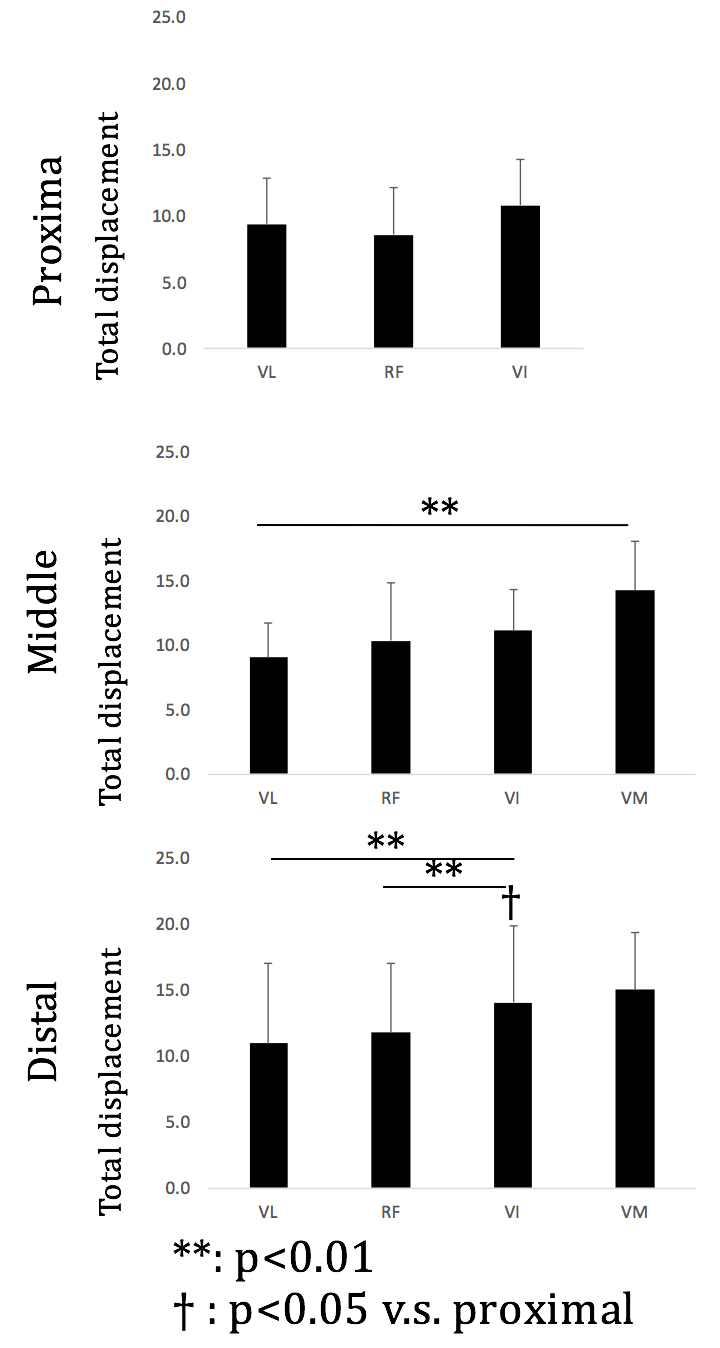
The heterogeneity of displacement of muscles tissues was clearly observed both within and across the four compartments, as well as along the proximo-distal axis. Within slices, large total displacements of ~20 mm were observed around the aponeuroses such as that between VI and other surrounding muscles, as well as between VM and RF (Fig. 2). Difference was also seen in the time-course of contraction (Fig. 3). Between muscle compartments, no significant statistical difference was observed in the proximal region, (Fig.4), in contrast to the middle region where the VM displacement was significantly larger than that of VL (p=0.005). Also, in distal portion the total displacement of VI was significantly larger than VL and RF (p=0.004 and p=0.002). Across slices along the proximo-distal axis, heterogeneity in displacement was also observed along the proximo-distal axis, with the total displacement of only VI in distal portion being statistically larger than that in proximal (p=0.016).Discussion and Conclusion
This important observation of heterogeneity of strain, both spatial and temporal, during sub-maximal contractions of quadriceps muscles reveals in this study differences as well as isolation of function between, as well as within, these muscle compartments. One of the main roles of muscle tendon complex in executing physical movements is to generate and transfer mechanical work, which is quantified by multiplying force by displacement. The larger displacements in some muscles imply higher contribution to work generation from that region compared to others. The ability to study velocity and strain profiles at such anatomical depth, field-of-view and spatial and temporal resolutions enables assessment of the functional status of the individual compartments of the normal quadriceps. To what extent these compartments are differentially affected in the diseased state as when recovering from an ACL tear can be revealed by this methodology, with the potential of guiding tailor-made rehabilitative strategies in the future. Also, strain rate (SR) maps derived from the velocity maps can identify the direction of principal shortening or lengthening3. Our studies of SR tensor in the gastrocnemius have shown that the SR orientation deviates from the fiber direction. Since these deviations may be related to lateral transmission of force, alterations in the fiber and SR orientations may potentially help identify altered muscle function from remodeling of the extracellular matrix as in patients with limb disuse or recovering from repaired ACL.Acknowledgements
This work was supported by National Institute of Arthritis and Musculo- skeletal and Skin Diseases Grant 5RO1-AR-053343-08.References
[1] Williams GN, et al, J Ortho Res 21 (2003) 1131.
[2] Csapo R et al, J Appl Physiol 2015; 119(5):558-68. PMID:26112239.
[3] Sinha U et al Mag Res Med 2015; 73 (5):1852-63 PMID: 25046255.
Figures