5007
Magnetic Resonance Methods for Quantitative Evaluation of Intramuscular Adipose Tissue1Institute of Medical Physics, University Erlangen-Nuremberg, Erlangen, Germany, 2Product Definition & Innovation, Siemens Healthcare GmbH, Diagnostic Imaging, Magnetic Resonance, Erlangen, Germany, 3Institute of Radiology, University Hospital Erlangen, Erlangen, Germany, 4Erwin L. Hahn Institute for Magnetic Resonance Imaging, University Duisburg-Essen, Essen, Germany, 5High Field and Hybrid MR Imaging, University Hospital Essen, Essen, Germany
Synopsis
Intramuscular adipose tissue directly affects physical performance. 56 subjects (80 ± 5 yrs) with sarcopenia and 23 physically well-trained subjects (28 ± 4 yrs), all male, were examined at the thigh on a 3T MR system using quantitative MRI and MRS sequences. The results show that the use of spectroscopy involves challenges with regard to representative assessment of the entire muscle and might overestimate fat in low-fat tissues as muscle tissue. Furthermore, 2pt in comparison to 6pt Dixon sequences should be used with caution for quantitative evaluation, while multi-echo Dixon sequences are capable of quantifying intramuscular adipose tissue.
Purpose
Structural muscle composition is a crucial factor contributing to muscle function1. In elderly, muscle mass deterioration declines at a slower rate than strength, implying that factors other than decreased muscle mass contribute to strength loss2. A direct effect of intramuscular adipose tissue (IMAT) on muscular strength and power has been shown3. The purpose of our study was to evaluate precision (repeatability and reproducibility) of MR methods potentially suitable for quantifying IMAT and its distribution within the muscle.Methods
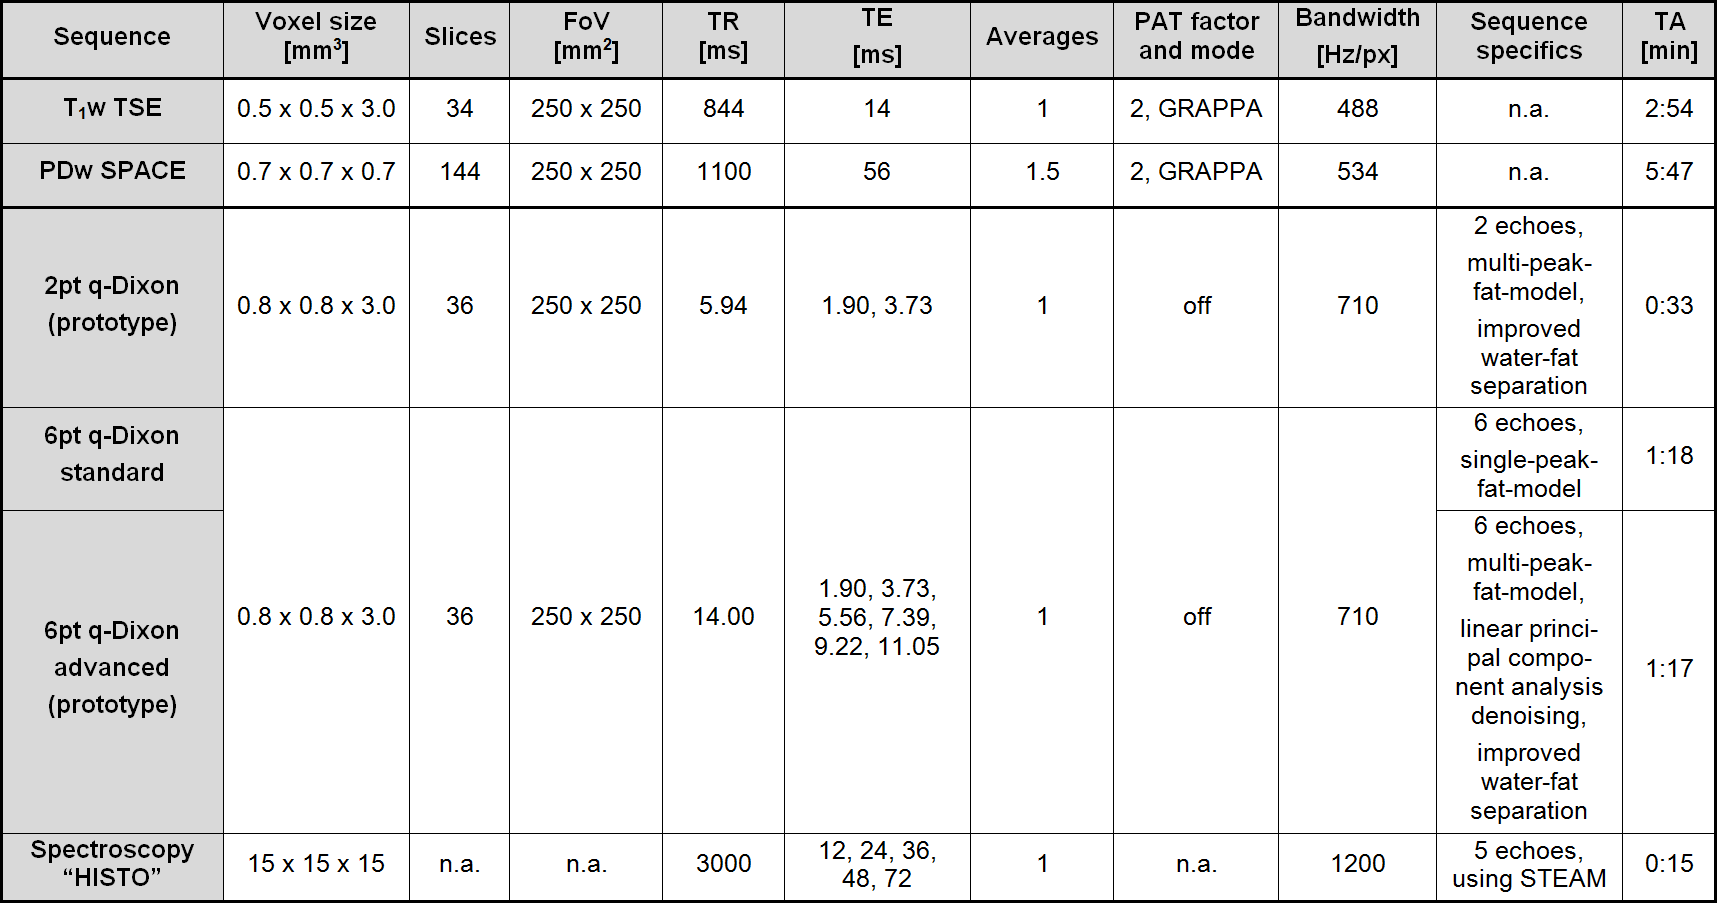
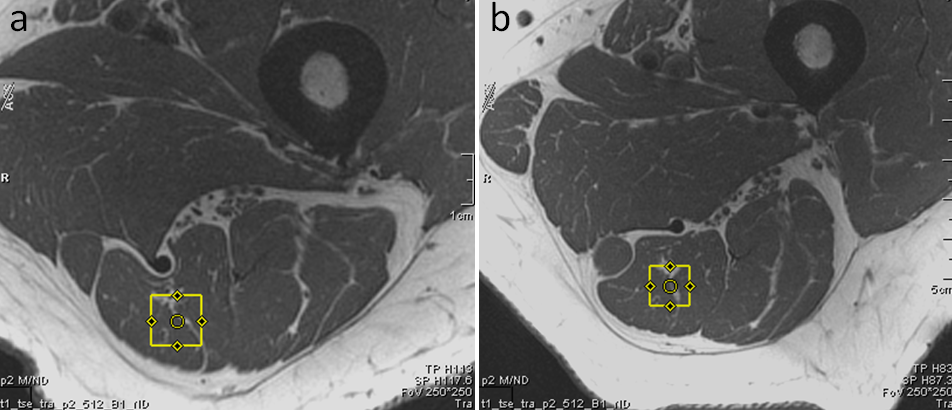
Two groups of subjects (elderly: n = 56, male, 80 ± 5 yrs, diagnosed sarcopenia; young: n = 23, male, 28 ± 4 yrs, physically well-trained) were examined at the thigh (18-channel body array surface coil) using a 3T MR system (MAGNETOM Skyrafit, Siemens, Erlangen, Germany). The protocol (for detailed parameters, see Table 1) included a clinically common T1w TSE and PDw SPACE 3D high-spatial-resolution sequence and in addition, for fat quantification, three versions of a GRE VIBE quantitative Dixon sequence (q-Dixon), including two prototype sequences and the high-speed T2-corrected multi-echo H1 spectroscopy “HISTO” at musculus semitendinosus (Figure 1). For precision validation, quantitative sequences were measured two additional times: once before and once after subject repositioning (repeatability test). The percentage change in PDFF between the measurements and the coefficient of variation of the root-mean-square deviation (CV(RMSD)) was calculated.
In q-Dixon sequences, proton density fat and water fractions (PDFF and PDWF) were calculated as parametric maps. T1-bias was corrected by using a low flip angle of 6°, and in both 6pt q-Dixon sequences T2*-decay was considered as a degree of freedom in the parameter extraction and eliminated4, 5. In spectroscopy, T2-correction was performed by extrapolating fat and water integrals for TE = 0 ms using an exponential fit of the signal peaks acquired at five successive TEs6. A long TR of 3000 ms was chosen to avoid a T1-bias4, 7.
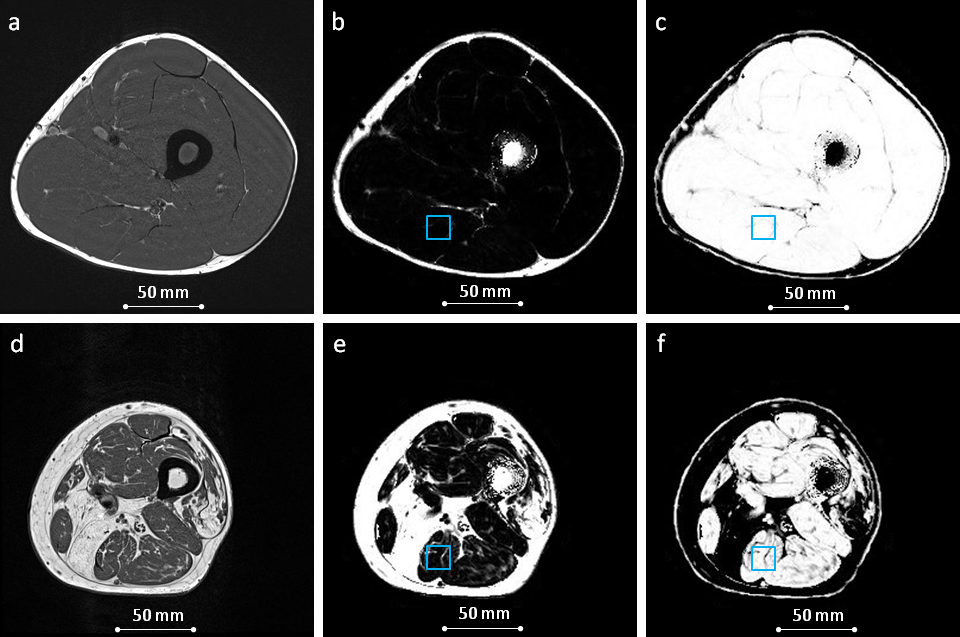
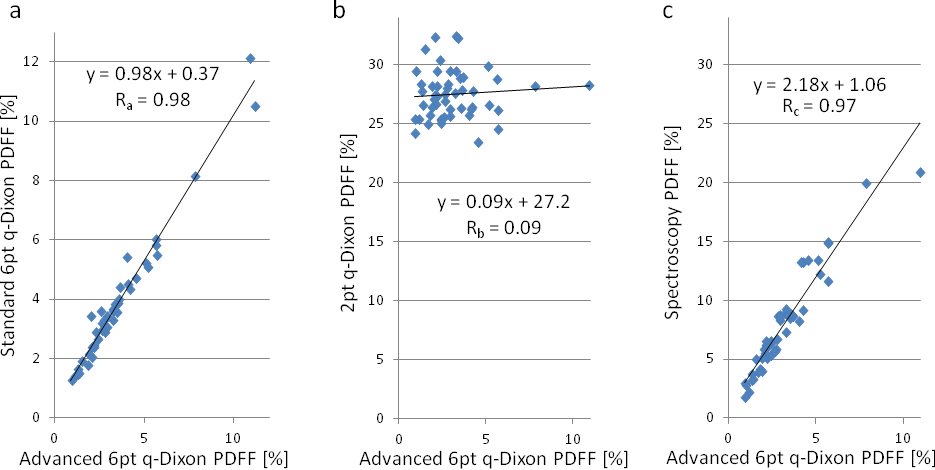
To estimate reproducibility and compare the results acquired by the three q-Dixon versions and spectroscopy, the VOI evaluated in the spectroscopy was manually positioned in the parametric q-Dixon maps (Figure 2) and a correlation analysis was performed.
Results
Figure 2 shows exemplary result images of selected clinical and quantitative sequences for one randomly chosen subject per group. A global fat-water swap occurred with the standard 6pt q-Dixon in 31% of all subjects, and could be prevented by the improved water-fat separation algorithm of the advanced 6pt q-Dixon prototype sequence.
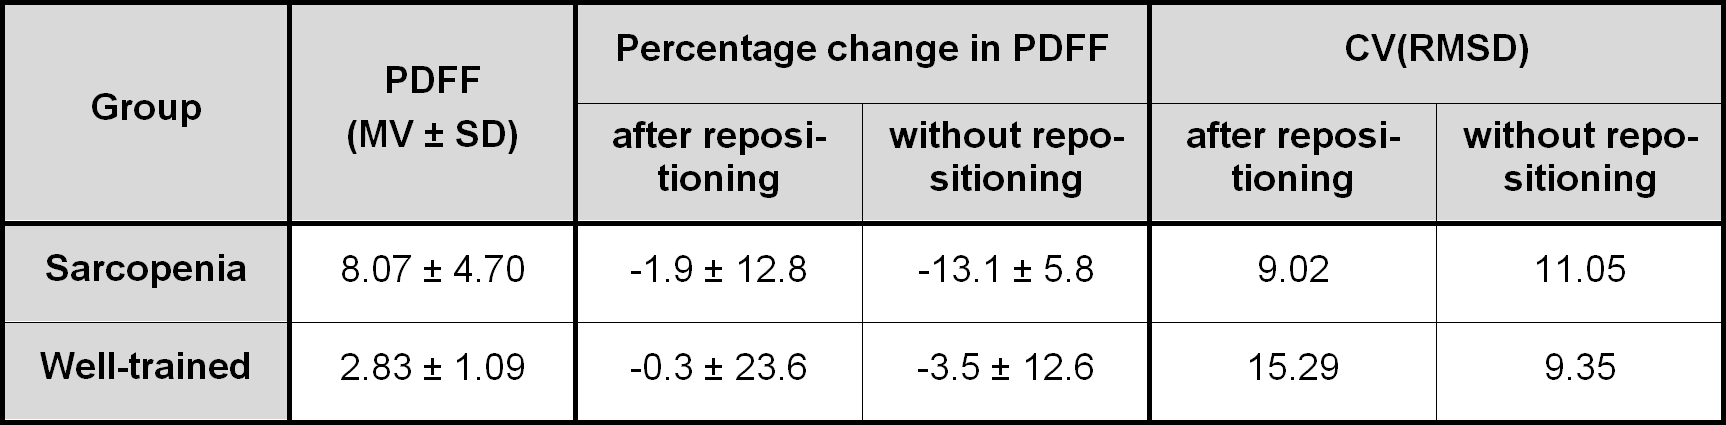
The average PDFF, the measured percentage change in PDFF, and the CV(RMSD) before and after patient repositioning using spectroscopy are given in Table 2 for both groups.
Results of correlation analysis between PDFFs measured with the advanced 6pt q-Dixon prototype and PDFFs measured with the standard 6pt q-Dixon, 2pt q-Dixon prototype, and spectroscopy are shown in Figure 3
Discussion
T1w TSE and PDw TSE sequences result in high-resolution, high-contrast images, which can be used for fascia segmentation and separation of intramuscular fat. PDw SPACE images have the additional advantage of a high spatial isotropic resolution, beneficial for 3D structural analysis of IMAT distribution. Parametric PDFF and PDWF maps obtained from q-Dixon sequences can be used for IMAT quantification and, potentially, for the structural analysis of IMAT distribution.
Repeatability of spectroscopy reflects challenges with regards to comparable patient repositioning and tissue composition within the voxel since muscle tissue is flexible and inhomogeneous (Figure 1).
For muscle tissue properties, non-optimal TE and TR, T1-bias, and T2*-decay in 2pt Dixon could explain that an offset and no correlation with the 6pt q-Dixon sequence was found. This leads to the suggestion that 2pt Dixon sequences should be used with caution for quantitative fat measurements. Although the correlations found between 6pt q-Dixon sequences and spectroscopy were high, an offset was measured. The accuracy and precision of spectroscopy were validated in liver tissue; however, an overestimation of PDFF in low-fat tissue is known6. Furthermore, unlike spectroscopy, imaging sequences enable a more representative insight into muscle composition and therefore the subjects' physical performance rather than a single large-volume voxel.
Conclusion
Current results of our examination show that the use of spectroscopy involves challenges with regard to representative assessment of the entire muscle volume. 2pt Dixon sequences should be used with caution for quantitative evaluation due to the possible occurrence of inhomogeneous biases affecting fat quantification, while 6pt q-Dixon sequences are capable of quantifying IMAT and suitable for structural analysis.Acknowledgements
No acknowledgement found.References
1. Goodpaster BH, Carlson CL, Visser M, Kelly DE, Scherzinger A, Harris TB, Stamm E, Newman AB. Attenuation of skeletal muscle and strength in the elderly: the health ABC study. Journal of Applied Physiology 2001;90(6):2157-2165.
2. Kallman DA, Plato CC and Tobin JD. The role of muscle loss in the age related decline of grip strength cross sectional and longitudinal perspectives. Journal of Gerontology 1990;45(3):m82-m88.
3. Tuttle LJ, Sinacore DR, Mueller MJ. Intermuscular adipose tissue is muscle specific and associated with poor functional performance. Journal of Aging Research 2012; Article ID 172957.
4. Bydder M, Yokoo T, Hamilton G, Middleton MS, Chavez AD, Schwimmer JB, Lavine JE, Sirlin CB. Relaxation Effects in the Quantification of Fat using Gradient Echo Imaging. Magn Reson Imaging 2008;26(3): 347-359.
5. Yu H, Shimakawa A, McKenzie CA, Brodsky E, Brittain JH, Reeder SB. Multiecho Water-Fat Separation and Simultaneous R2* Estimation With Multifrequency Fat Spectrum Modeling. Magn Reson Med 2008;60(5):1122-1134.
6. Pineda N, Sharma P, Xu Q, Hu X, Vos M, Martin DR. High-Speed T2-Corrected Multiecho Acquisition at 1H MR Spectroscopy - A Rapid and Accurate Technique. Radiology 2009;252(2): 568–576.
7. Liu CY, McKenzie CA, Yu H, Brittain JH, Reeder SB. Fat Quantification With IDEAL Gradient Echo Imaging: Correction of Bias From T1 and Noise. Magn Reson Med 2007;58(2):354-364.
Figures