5003
Repeatability of quantitative muscle strain and strain rate measurements by means of synchronous dynamic muscle MRI during electrical muscle stimulation1Radiology, Division of Radiological Physics, University of Basel Hospital, Basel, Switzerland, 2Biomedical Engineering, University of Basel, Basel, Switzerland, 3Ricerche Diagnostiche Srl, Bari, Italy, 4Musculoskeletal Radiology, Clinic of Radiology and Nuclear Medicine, University of Basel Hospital, Basel, Switzerland, 5Sports Medicine, University of Basel, Switzerland
Synopsis
Stimulation of the quadriceps muscle group of the thigh and synchronous phase contrast imaging at a 3T MRI scanner were applied to six healthy volunteers, to assess repeatability of the dynamic strain and strain rate maps. The repeatability was higher for strain (ICC=0.665-0.751) than for strain rate (ICC=0.242-0.571) and the correlation of the results increased with longer intra-scan rest periods. In conclusion, strain and strain rate measured with synchronous MRI of EMS-controlled muscle contraction are repeatable, though attention should be paid to intra-stimulation rest periods.
INTRODUCTION
Characterization of muscle contraction with MRI gives an insight into its mechanical properties and physical condition1-3. Simultaneous MRI and electrical muscle stimulation (EMS) allows exact synchronization of the contraction and data acquisition and direct assessment of muscle kinematics such as given by strain rate and strain4, 5.The purpose of this study was to evaluate the repeatability of strain and strain rate values assessed by simultaneous electrical muscle stimulation and phase-contrast MRI in order to separate physical-condition-related responses from measurement variability, such as positioning, motion, fatigue from multiple stimulations, and orientation. The assumption was that longer rest periods would lead to less fatigue and increased repeatability between scans. To this end, both the vastus lateralis (VL) and vastus intermedius (VI) muscles were studied as the contractile properties are more dependent on the fiber type than on the muscle6.METHODS
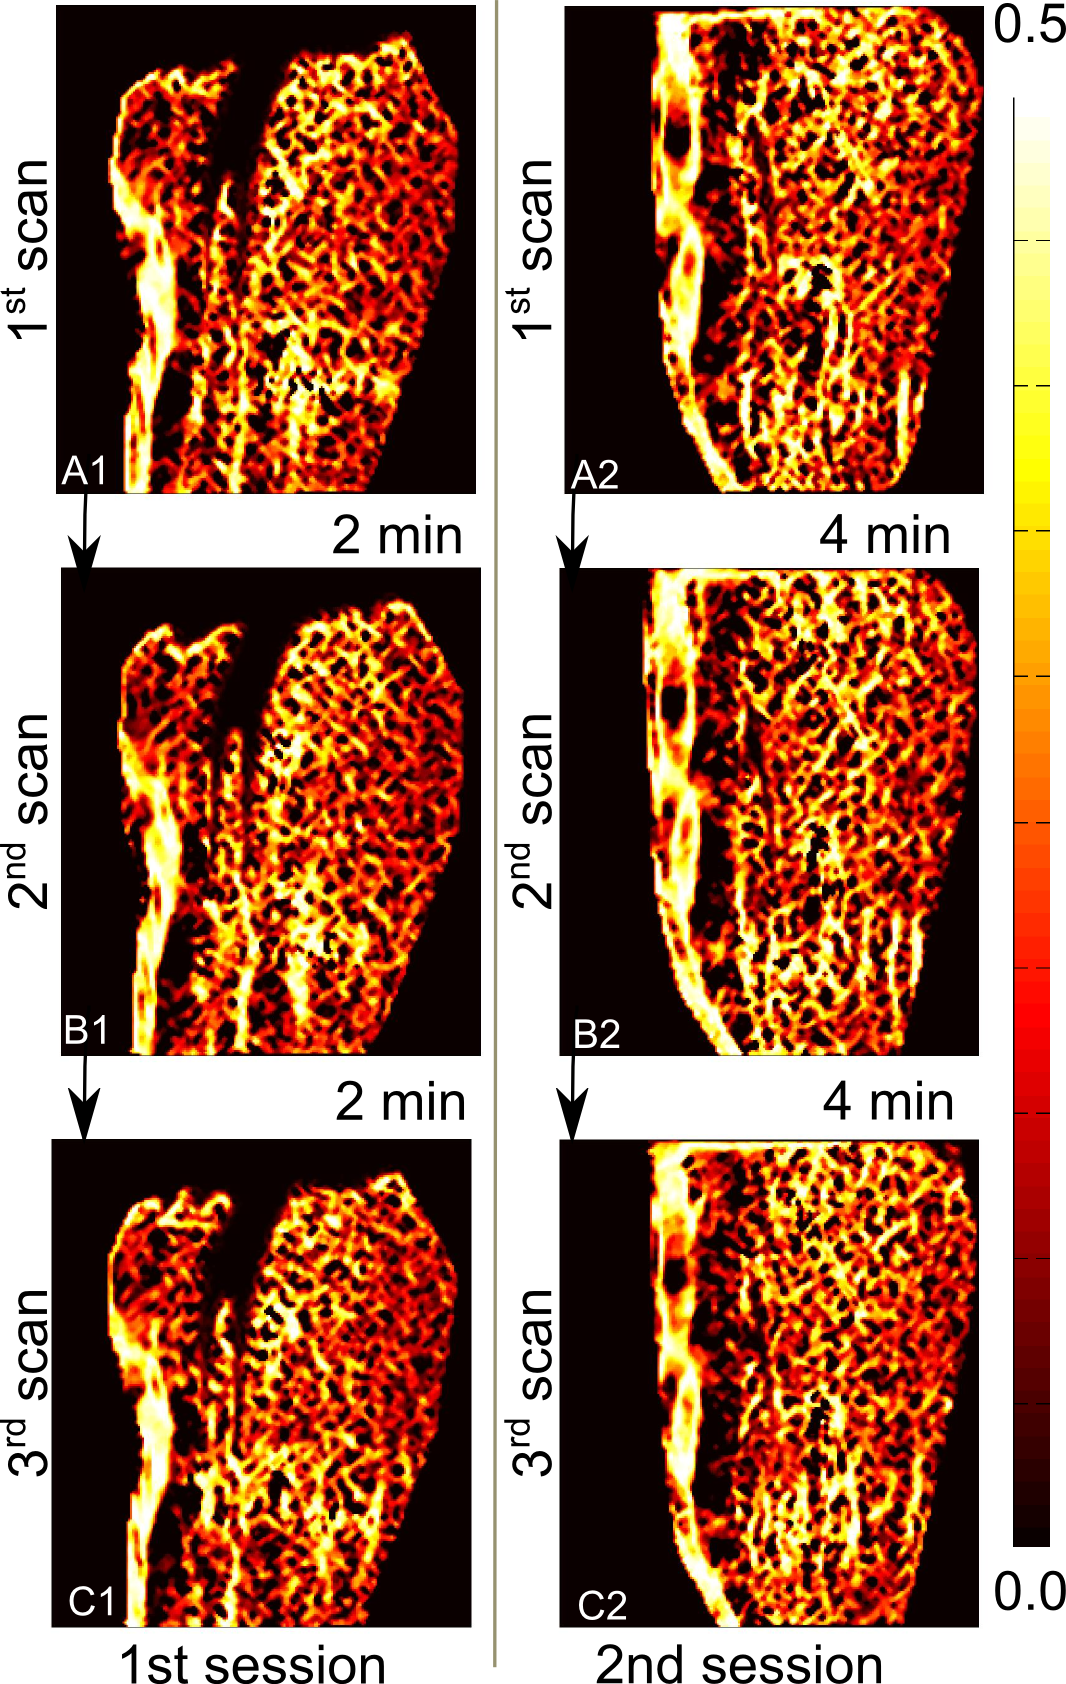
Simultaneous electrical stimulation of the quadriceps muscle group of the thigh and phase contrast (PC) imaging were applied to six healthy male volunteers (29 ± 6 y) at a 3T MRI scanner on two different sessions with the same settings and fixed stimulation current of 18 mA4. At each session, the scan was repeated three times, with different rest periods in-between, to study the effect of fatigue on the acquired strain and strain rate values of the VL and VI muscles. We refer to the three scans of the first session as A1, B1, C1 (with an in-between rest period of 2 min) and to the scans of day two as A2, B2, C2 (with an in-between rest period of 4 min) (see Fig. 1).
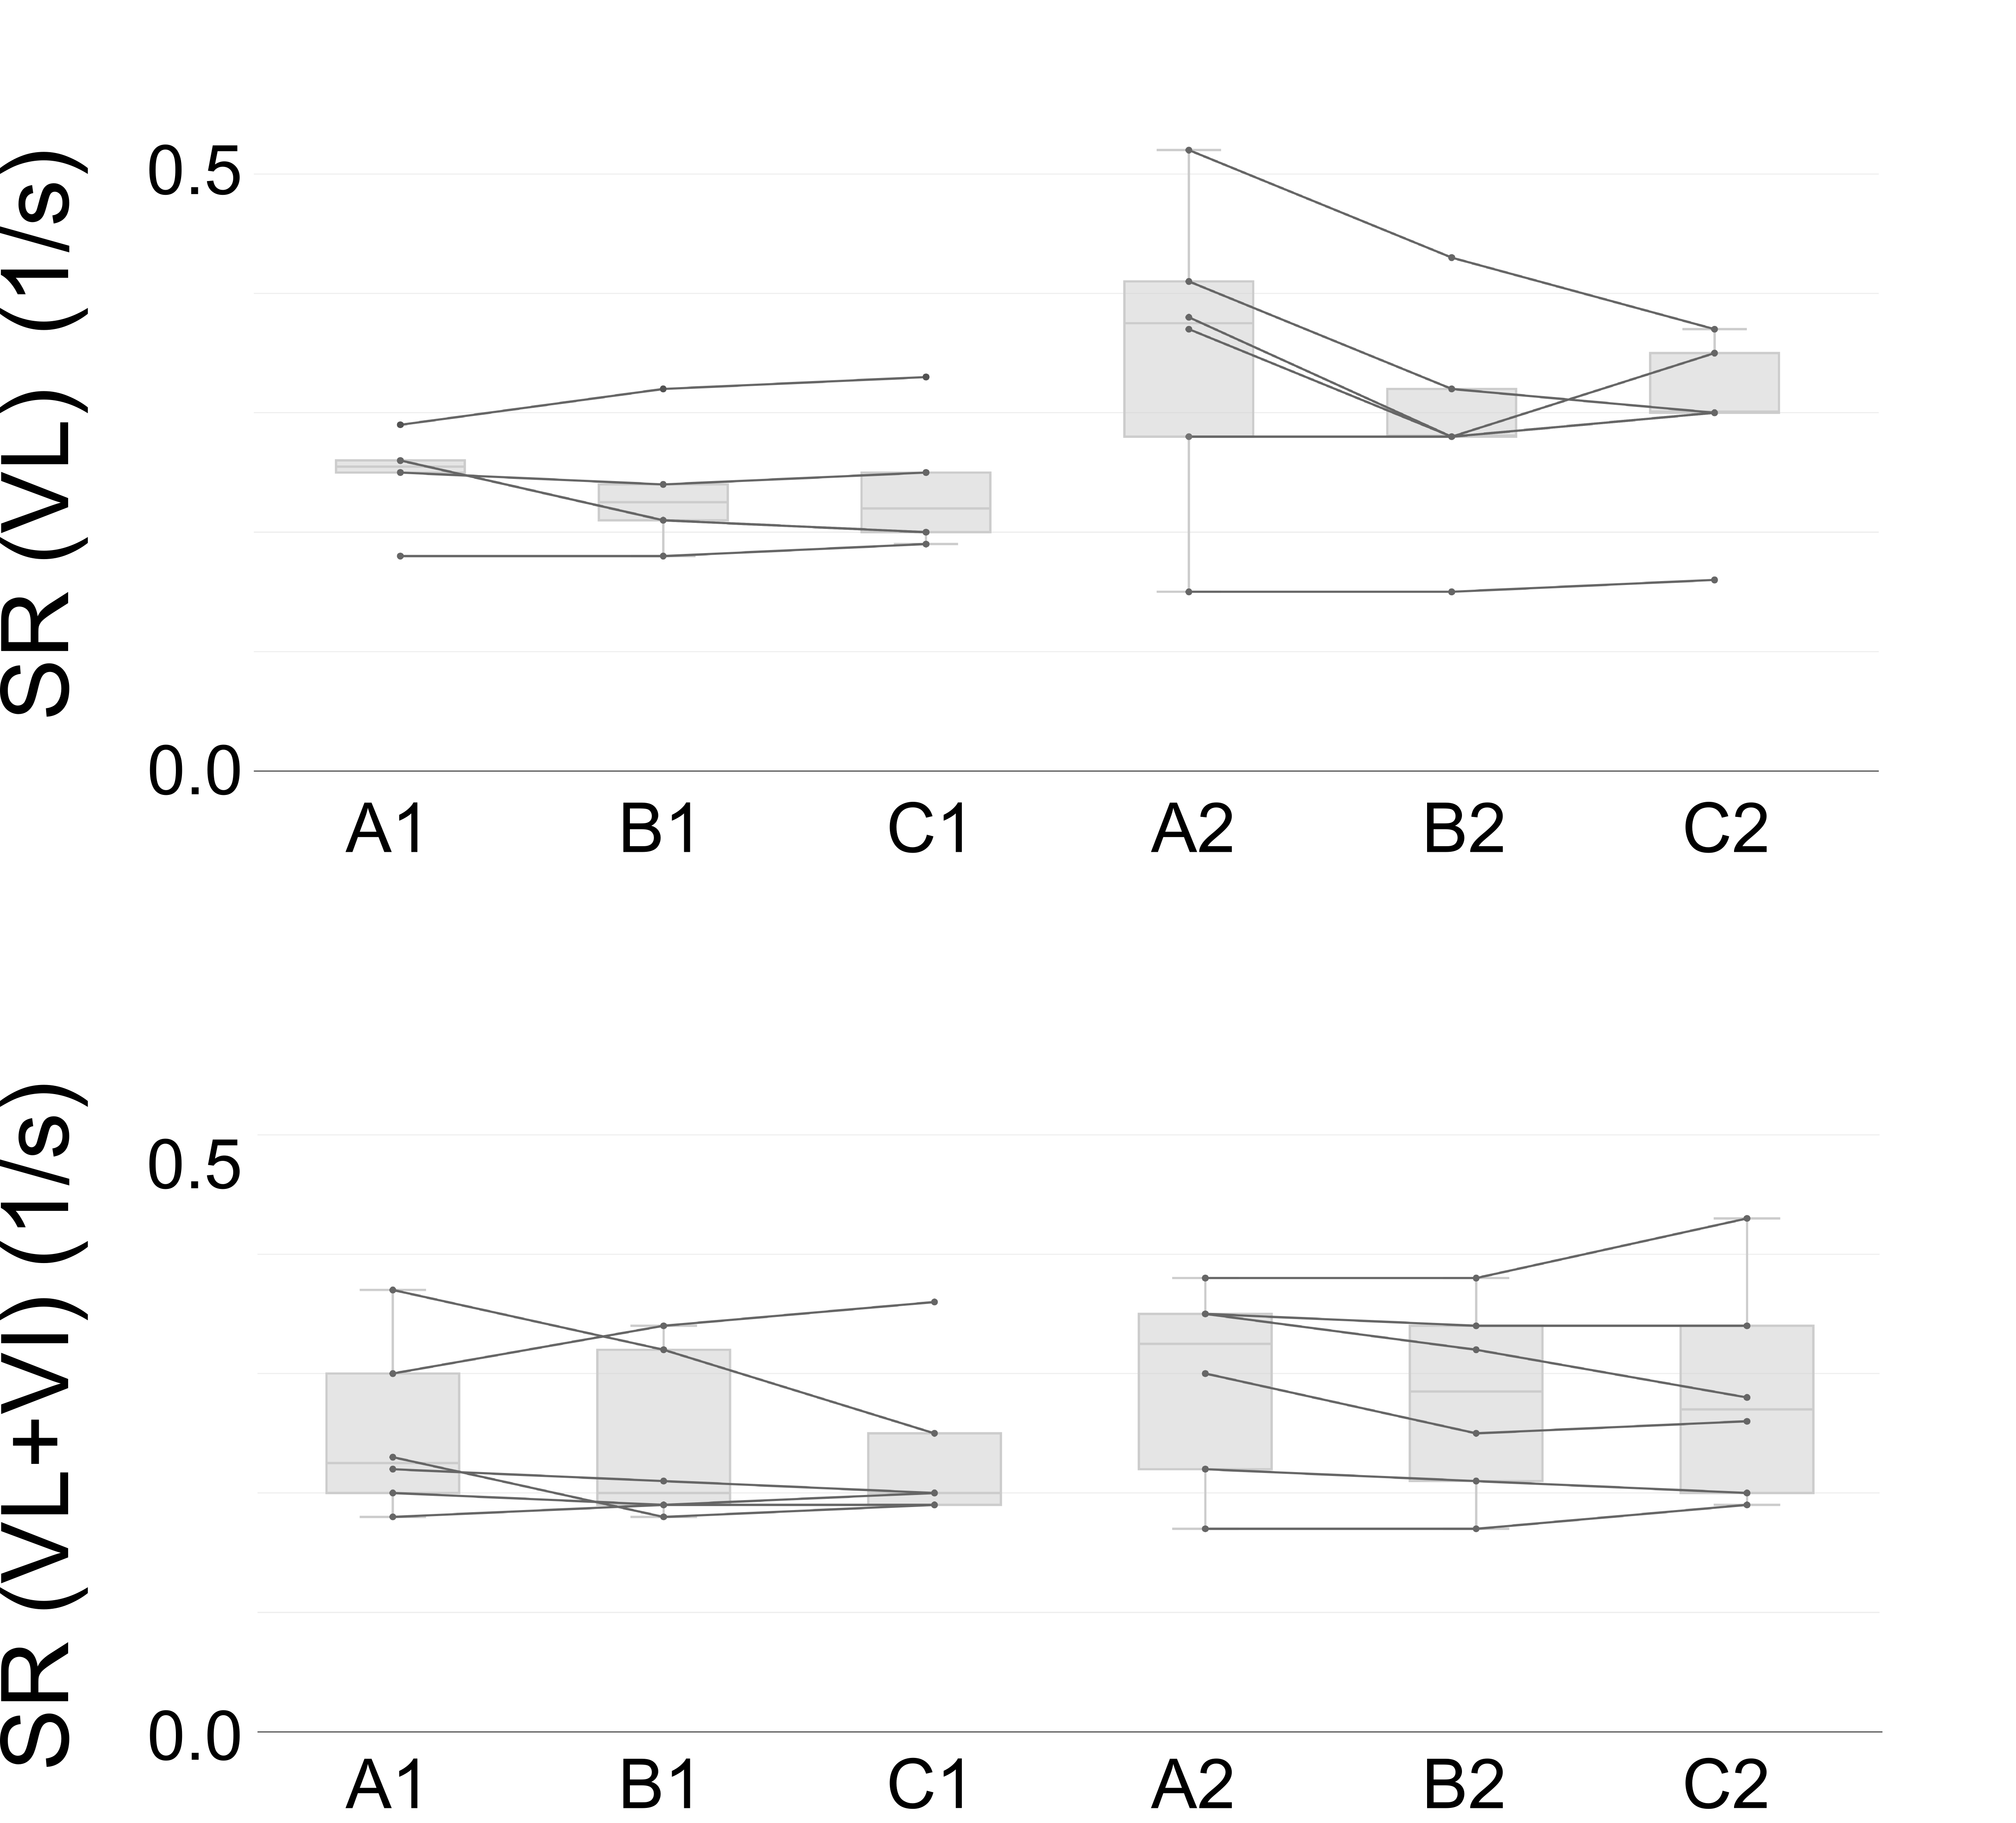
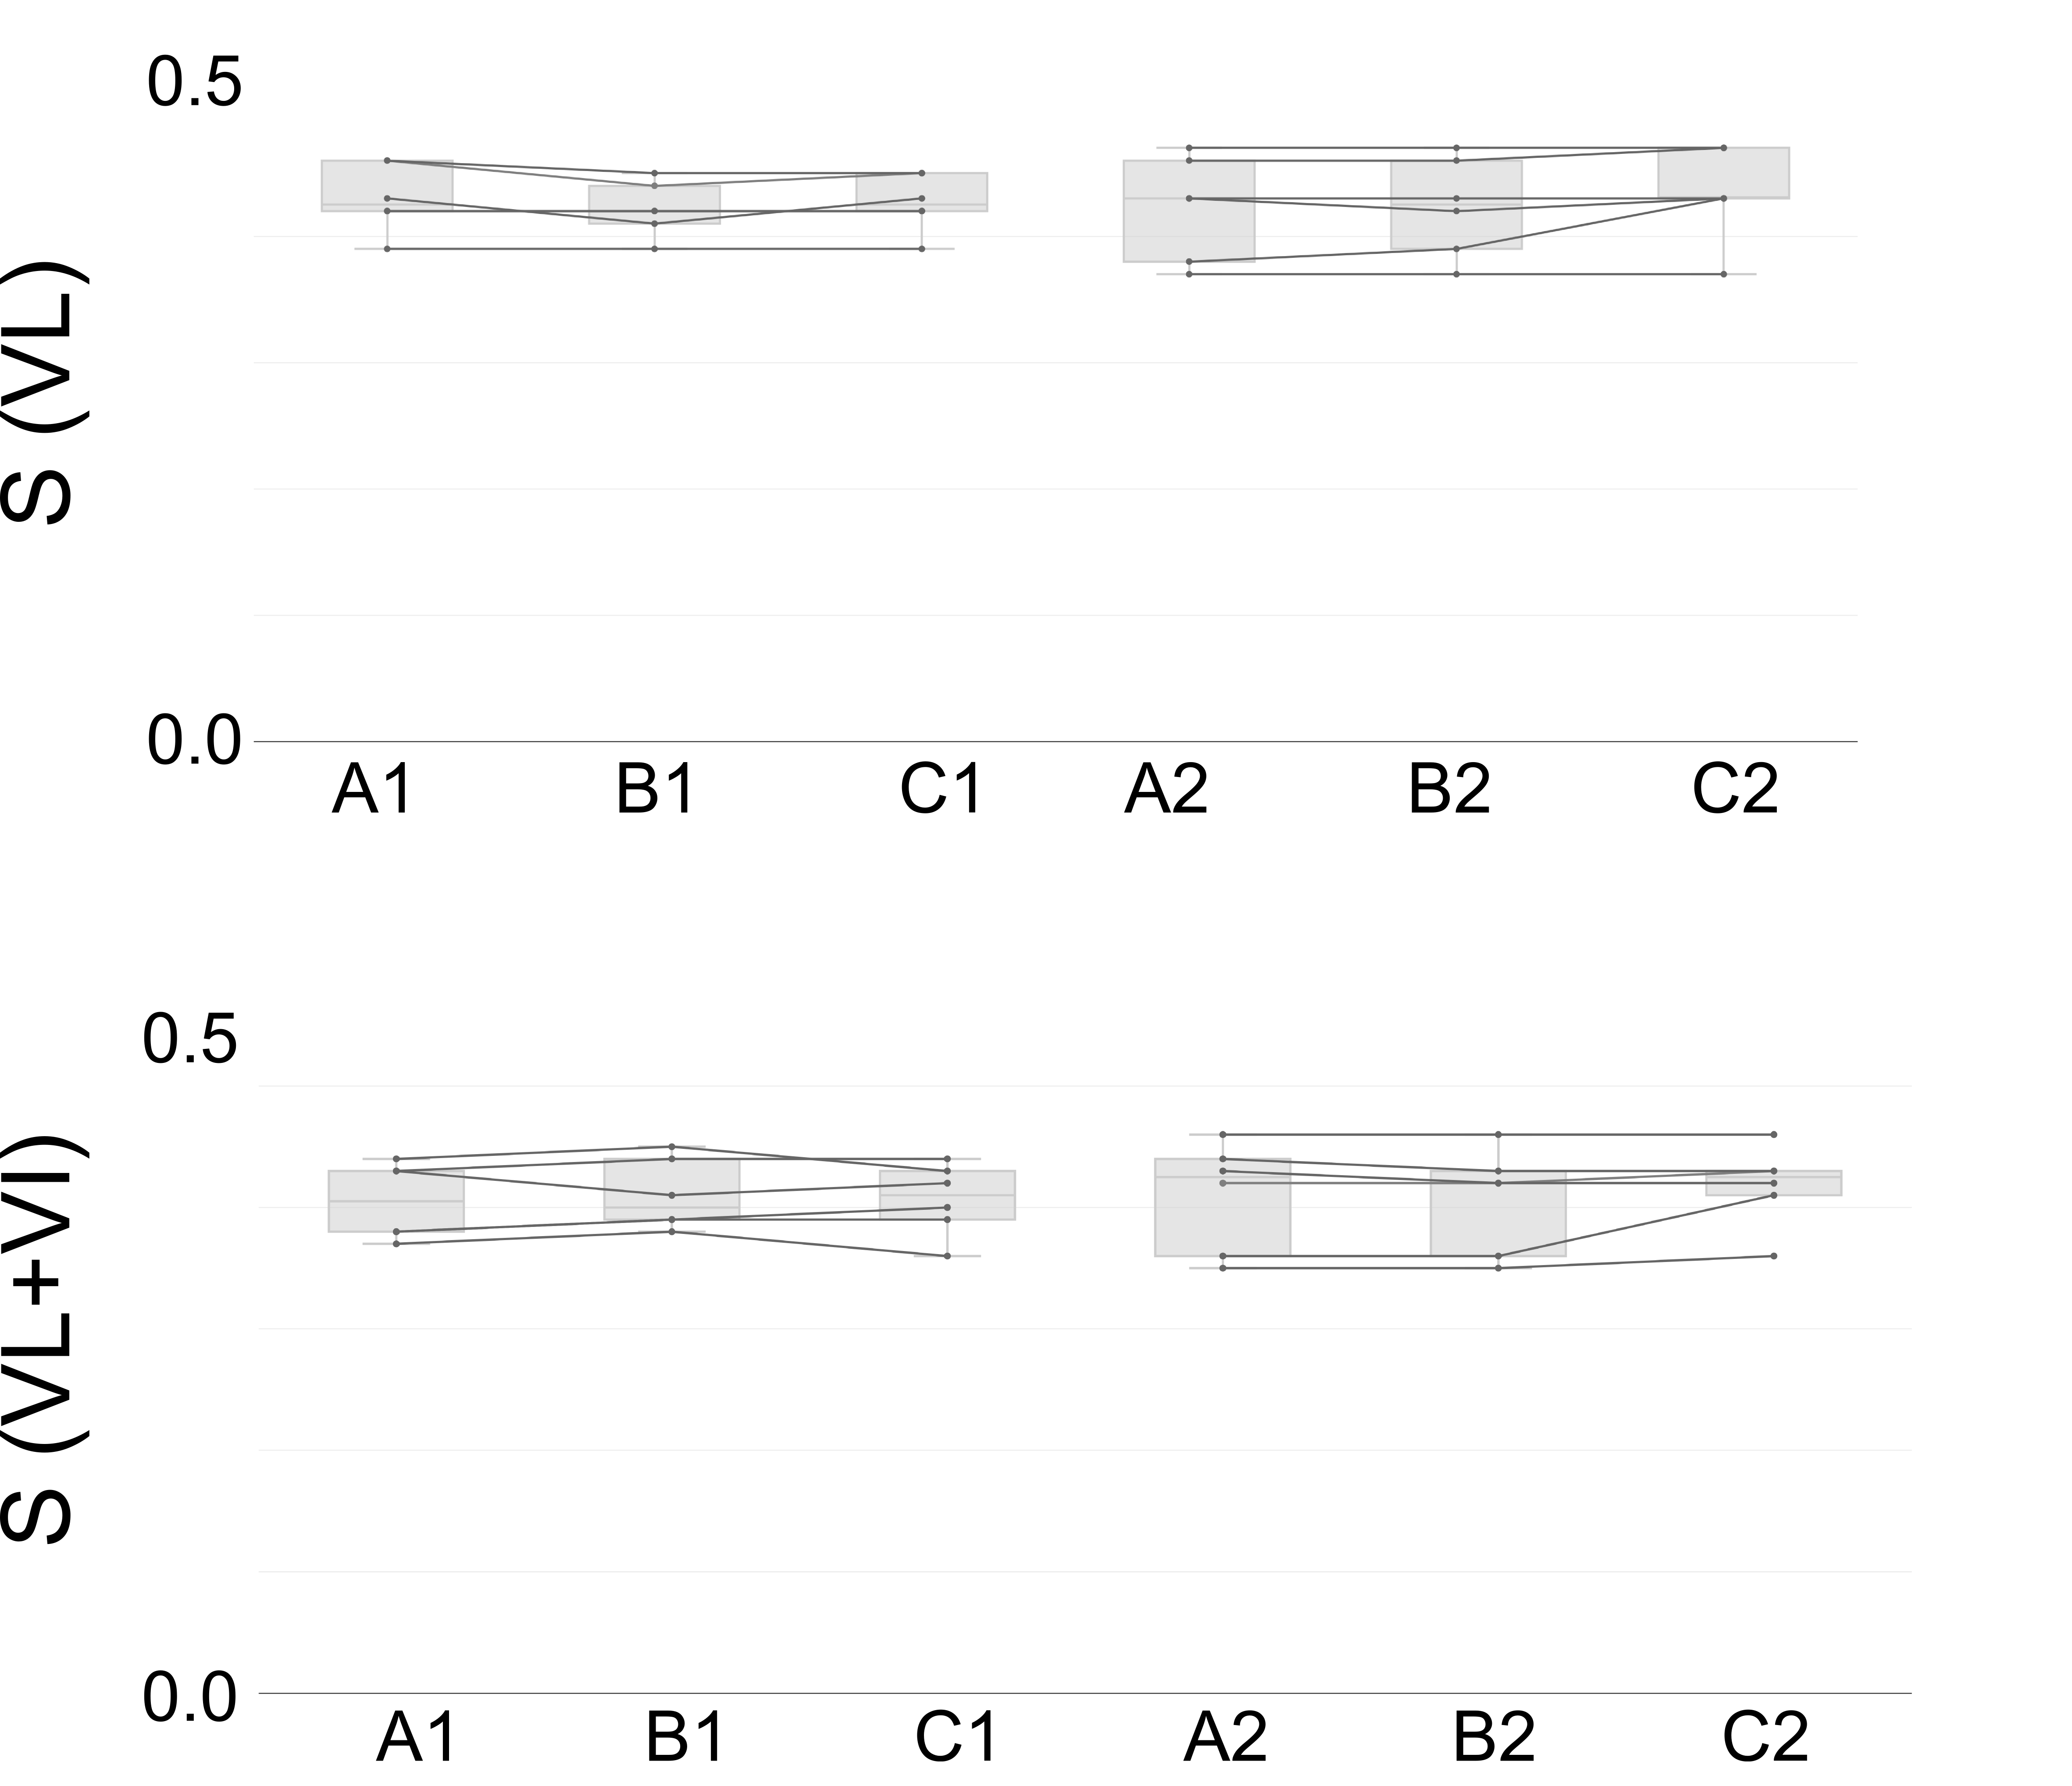
A commercially-available EMS device was used for stimulation of the quadriceps muscle group synchronized with high-temporal-resolution cine phase contrast MRI acquisition4,7. A three-directional gradient echo PC velocity encoding sequence was applied. MR acquisitions were performed on a parasagittal slice with a spatial resolution of 2.3 x 2.3 x 5 mm3 and a temporal resolution of 42 ms. The velocity encoding had a VENC of 25 cm/s (TR/ TE= 10.6/ 7.21 ms, bandwidth/ pixel= 400 Hz/ Px, flip angle = 10°, FOV= 225x300 mm2, 1 k-space line per segment, acquisition time 5 min) and 94 temporal phases were acquired. Strain rate and strain vectors were calculated from the velocity fields4. For each volunteer, two ROIs were identified, comprising either the VL only (identified as VL), or the VL and the VI together (identified as VL+VI). Over these two ROIs, the temporal peak of the median values of strain (S) and strain rate (SR) magnitude were extracted (termed S(VL), S(VL+VI), SR(VL), and SR(VL+VI), respectively).
The following statistical analysis was performed with R8,9: a) inter-scan repeatability calculation through the intraclass correlation coefficient (ICC), comparing the first scans of each session A1 vs A2 (observations of exchangeable order) and b) intra-scan repeatability through the concordance correlation coefficient (CC) for comparing successive scans (observation of non-exchangeable order).
RESULTS
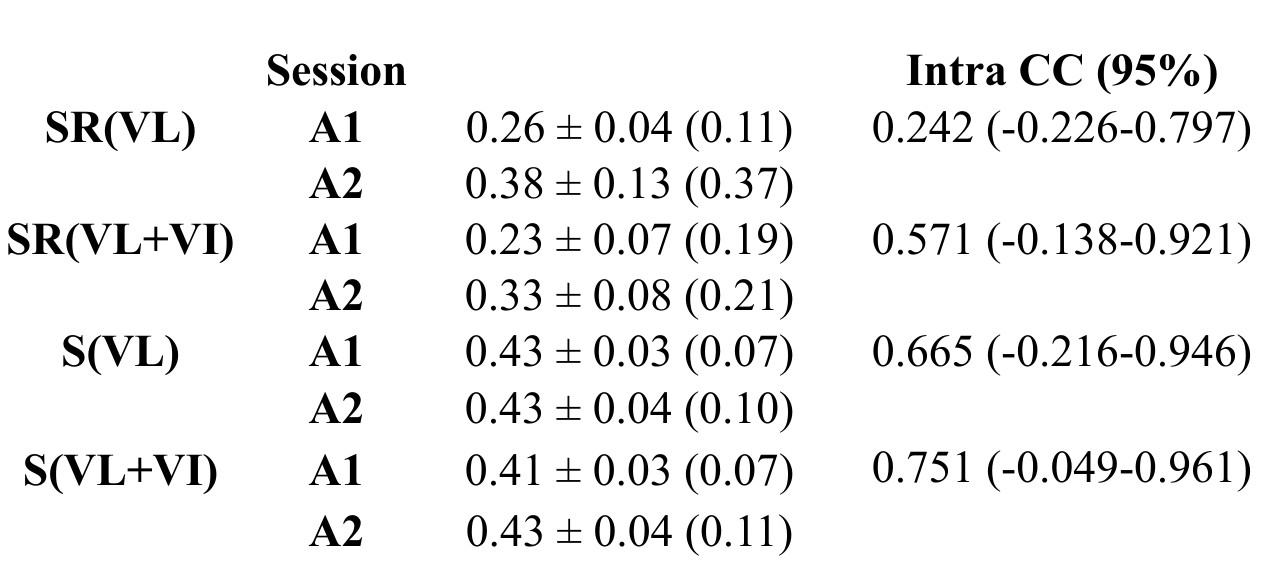
SR values only calculated over the VL resulted in the highest differences between volunteers and sessions (see Fig. 2 and 3). Inter-scan repeatability showed relatively low correlation for SR(VL+VI) with an ICC equal to 0.571, while for SR(VL) it was very low and equal to 0.242 (see Table 1). Strain, on the other hand, was better repeatable with an ICC of 0.665 for S(VL) and 0.751 for S(VL+VI).
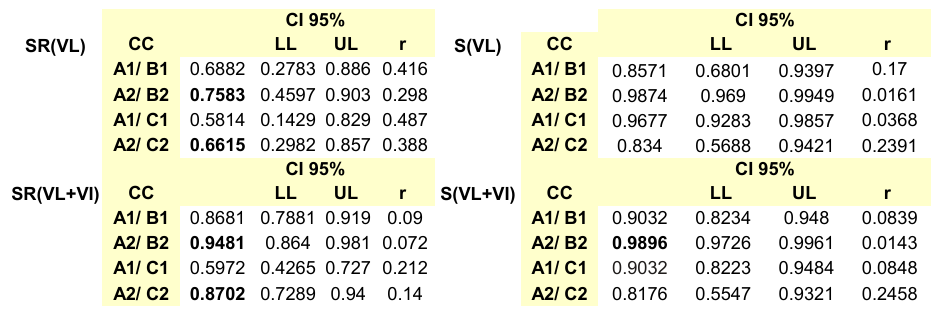
Intra-scan repeatability increased for increasing rest periods and also with the consideration of a broader ROI (see Table 2). For SR(VL+VI) values, there was a higher correlation for the group with the longest intra-scan rest periods A2-B2 (0.9481) than for A1-B1 (0.8681). Similarly for the strain, for S(VL+VI) the CC(A1B1) was 0.9032 and CC(A2B2) was 0.9896.
In almost all cases (see Table 2), the CC between the 1st and 3rd session was lower in comparison to the CC between the 1st and 2nd scan.
DISCUSSION
The purpose of this study was to evaluate the repeatability of MRI of EMS-controlled involuntary muscle contraction. It was shown that inter-scan repeatability for strain measurements acquired with the proposed set-up was higher than for strain rate measurements, and that longer intra-scan rest periods (i.e., at least 4 minutes) increased intra-scan repeatability of the exams. Care should be taken for multiple stimulations since the results of the 3rd stimulation were shown to be less repeatable.CONCLUSION
MRI of EMS-controlled involuntary muscle contraction yields strain and strain rate values that are repeatable under controlled conditions. Strain measurements are generally more repeatable than strain rate, and the intra-scan correlation of the results increased for longer intra-scan rest periods.Acknowledgements
This work was supported by the Swiss Foundation for Research on Muscle DiseasesReferences
1. Finni T, Hodgson JA, Lai AM, Edgerton VR, Sinha S. Mapping of movement in the isometrically contracting human soleus muscle reveals details of its structural and functional complexity. J Appl Physiol 2003;95:2128–2133.
2. Kinugasa R, Shin D, Yamauchi J, Mishra C, Hodgson JA, Edgerton VR, Sinha S. Phase-contrast MRI reveals mechanical behavior of superficial and deep aponeuroses in human medial gastrocnemius during isometric contraction. J. Appl. Physiol. 2008;105:1312–1320.
3. Sinha S, Hodgson JA, Finni T, Lai AM, Grinstead J, Edgerton VR. Muscle kinematics during isometric contraction: development of phase contrast and spin tag techniques to study healthy and atrophied muscles. J Magn Reson Imaging 2004;20:1008–1019.
4. Deligianni X, Pansini M, Garcia M, Hirschmann A, Schmidt-Trucksäss A, Bieri O, Santini F. Synchronous MRI of muscle motion induced by electrical stimulation. Magn. Reson. Med. 2016. doi: 10.1002/mrm.26154.
5. Adams GR, Harris RT, Woodard D, Dudley GA. Mapping of electrical muscle stimulation using MRI. J Appl Physiol (1985) 1993;74:532–537.
6. Harridge SD, Bottinelli R, Canepari M, Pellegrino MA, Reggiani C, Esbjörnsson M, Saltin B. Whole-muscle and single-fibre contractile properties and myosin heavy chain isoforms in humans. Pflüg. Arch. Eur. J. Physiol. 1996;432:913–920.
7. Drace JE, Pelc NJ. Measurement of skeletal muscle motion in vivo with phase-contrast MR imaging. J Magn Reson Imaging 1994;4:157–163.
8. Bartlett JW, Frost C. Reliability, repeatability and reproducibility: analysis of measurement errors in continuous variables. Ultrasound Obstet. Gynecol. 2008;31:466–475.
9. Vienna, Austria: the R Foundation for Statistical, Computing. R Development Core Team, R: A Language and Environment for Statistical Computing.
Figures