4999
ROI-based Evaluation of Diffusion Tensor Metric of Skeleton Muscles1Diagnostic and Interventional Radiology and Nuclear Medicine, University Medical Center Hamburg Eppendorf, Hamburg, Germany, 2Diagnostic and Interventional Radiology and Nuclear Medicine, University Medical Center Hamburg Eppendorf, Hamburg, 3Radiology, University of Texas Southwestern Medical Center, Dallas, TX, United States
Synopsis
This study evaluates and compares a pixel-based and ROI-based quantification of DTI-metrics for skeleton muscles in healthy subjects. Besides SNR, an “intra-ROI diffusion direction dispersion angle" is evaluated as a quantitative metric to assess reliability of ROI-based DTI-metrics
Purpose
In the standard Diffusion tensor imaging processing, the fractional anisotropy (FA) and mean diffusivity (MD) are calculated from the diffusion tensor of each pixel. Using the pixel-based method, FA has a positive bias when the signal-to-noise ratio (SNR) is low 1. In this study we evaluate a ROI-based quantification of DTI-metrics for skeleton muscles.Material and Methods
Diffusion tensor imaging
The MRI scans on nine healthy subjects (age mean ± s.d. 31.8 ± 4.4 years; m:f 5:4) were acquired on a 3T Philips Ingenia system (software release 5.7.1.2). The study was approved by the local ethics committee and written consent was obtained from each volunteer. Subjects were examined in supine position, feet first using a 28-channel sensitivity encoding torso array coil. Transverse DTIs were acquired using a fat suppressed single shot SE-EPI sequence with TR = 2433 to 4565 ms, TE = 66 ms, b=0 and 500 sec/mm2, 15 diffusion encoding directions, FOV 224 mm, acquisition matrix size of 112, 20 to 33 slices with thickness/gap = 6/0 mm, SENSE factor=2 . Eight DTI scans were performed in repetition using a number of signal averages (NSA) of 8, 8, 8, 8, 4, 4, 4, 4.
Data analysis
DTI scans were registered to remove effects of motion during acquisition for each subject. Data processing was done using internally developed software written in IDL 8.3 (Exelis IVS, Boulder, CO). In addition to analyzing the originally acquired data sets of each subject, a data set with an effective NSA of 48 was constructed from the original 8 image sets.
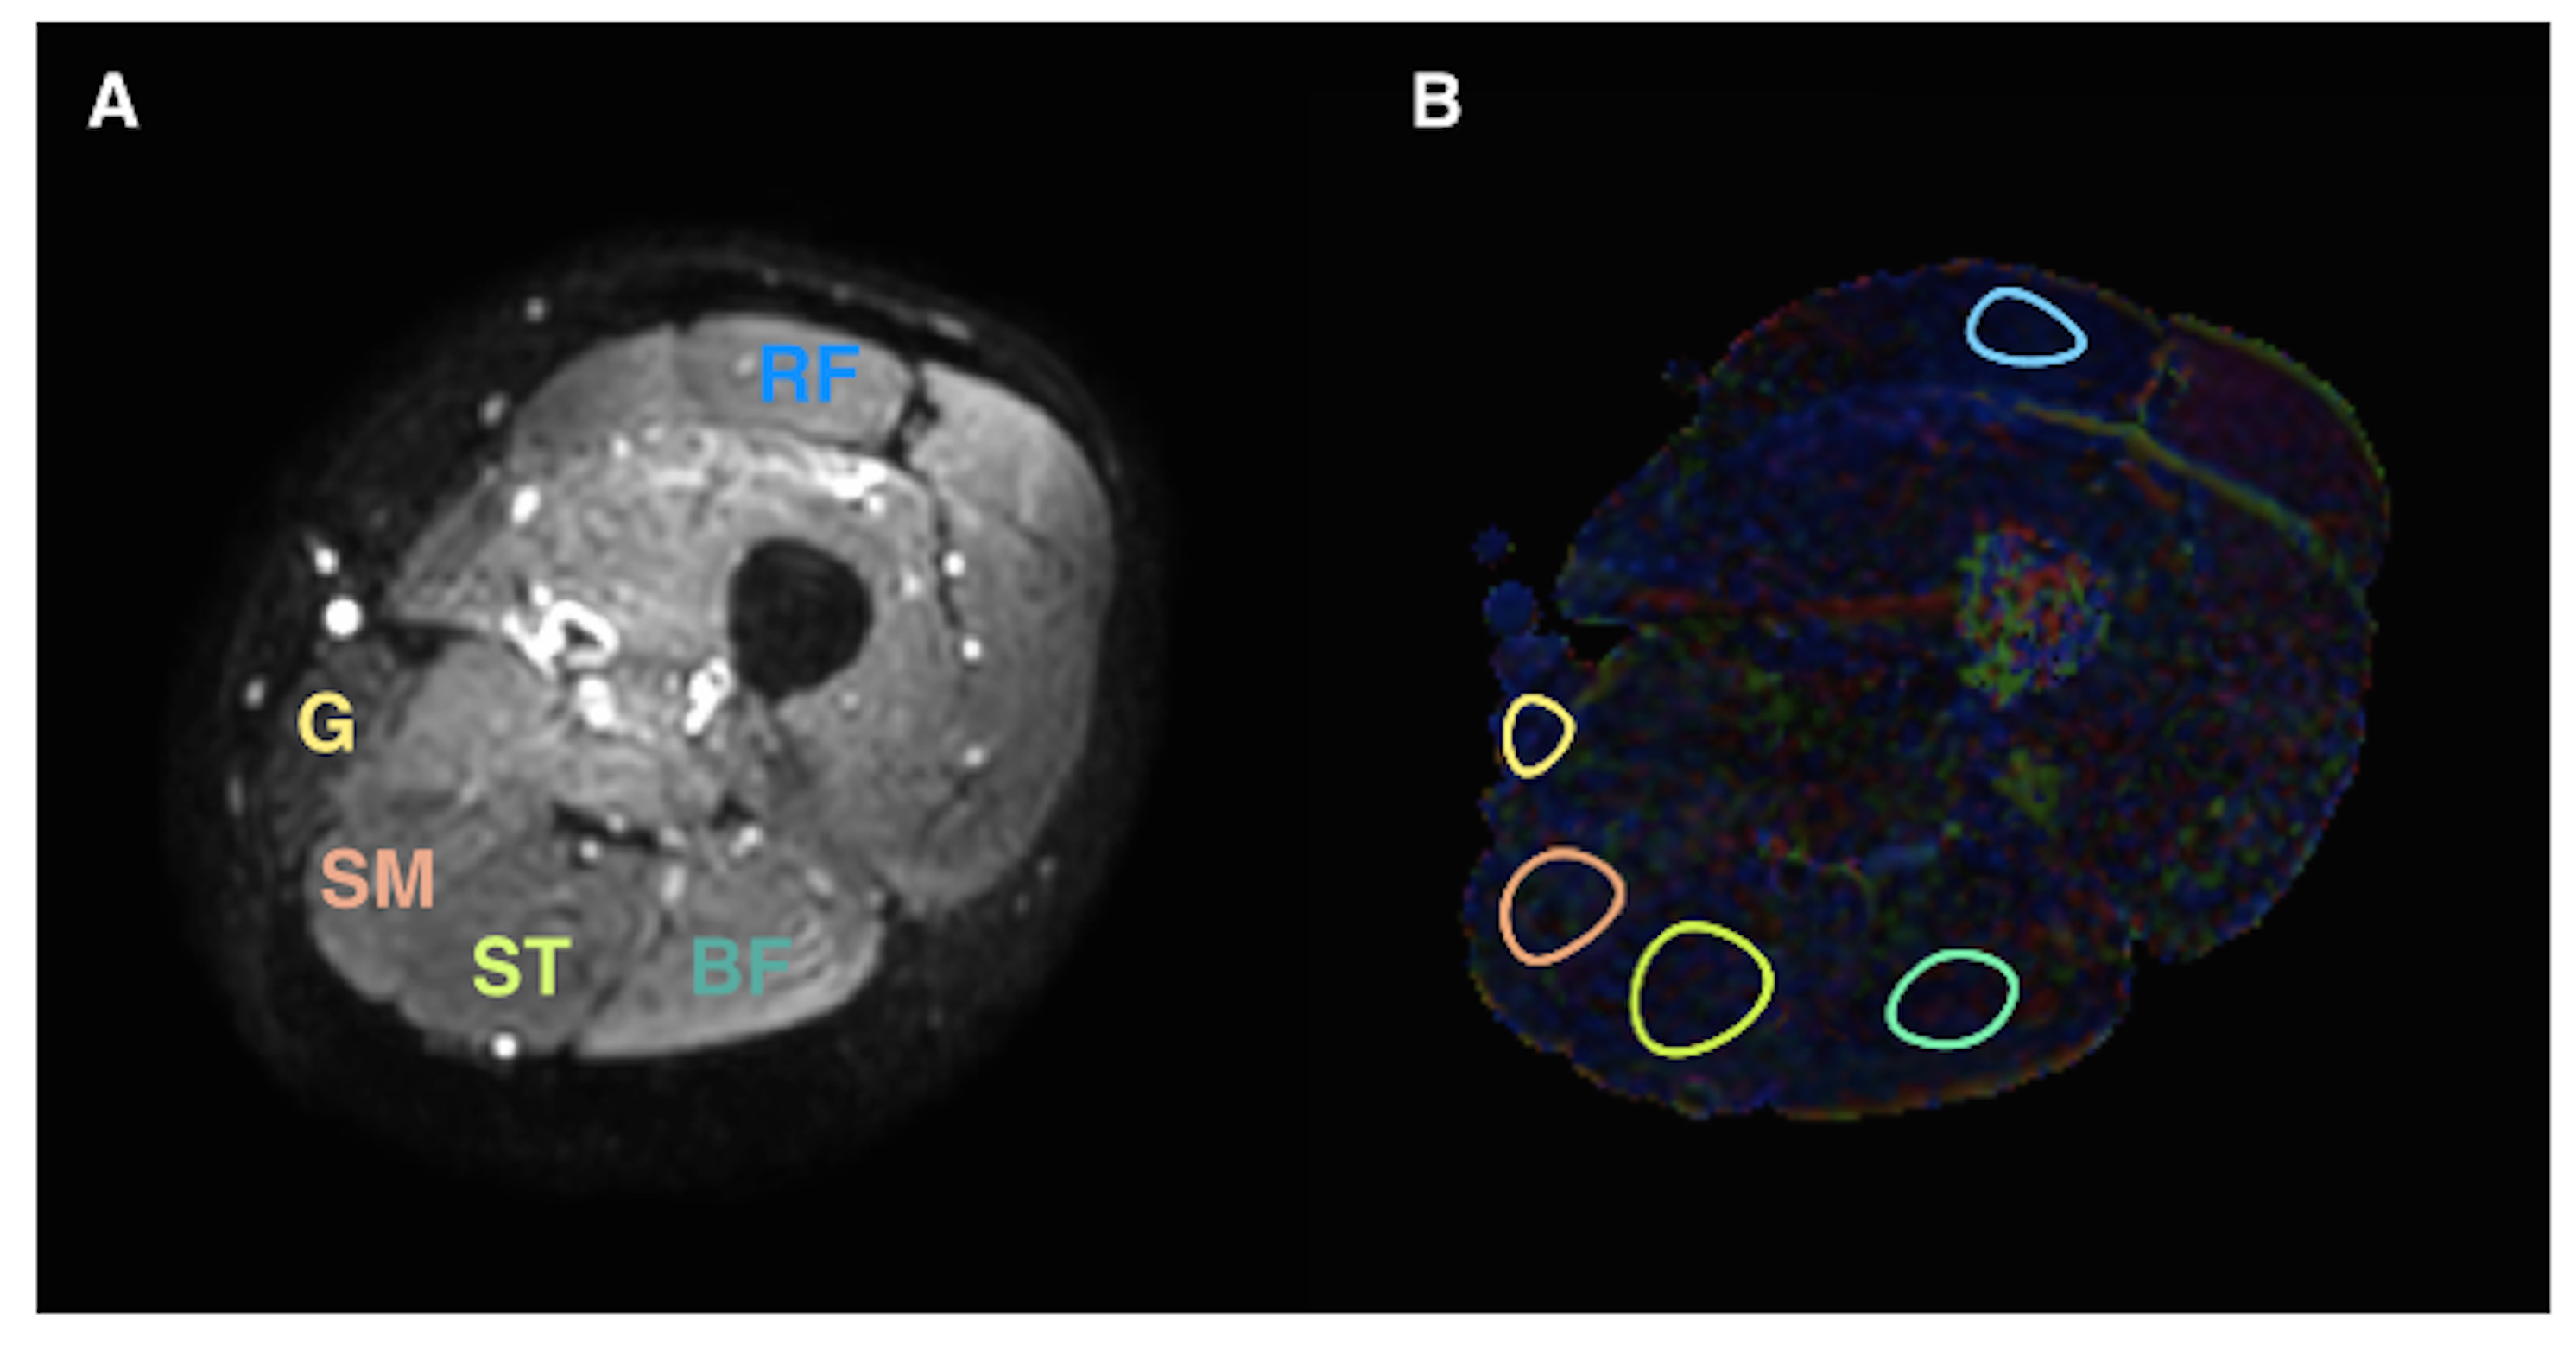
The pixel-based FA and MD from the image set with NSA of 48 were used as references. ROIs were manually drawn for each subject on the rectus femoris (RF), semitendinosus (ST), semimembranosus (SM), biceps femoris (BF) and gracilis (G) muscle (Fig. 1 a, b). Areas of fat contamination due to incomplete suppression of subcutaneous fat and water-fat shift on EPI readout were avoided when drawing the ROI. SNR for each muscle and for each NSA (4 and 8) were calculated using a difference image method 2. The SNR for the composite image with the effective NSA=48 was calculated as the square root of 6 times the average SNR of images with NSA=8. FA and MD values from ROI-based and pixel-based analysis were compared for all NSA values. In the ROI-based analysis, the signal was first averaged over the ROI before calculating the diffusion tensor.
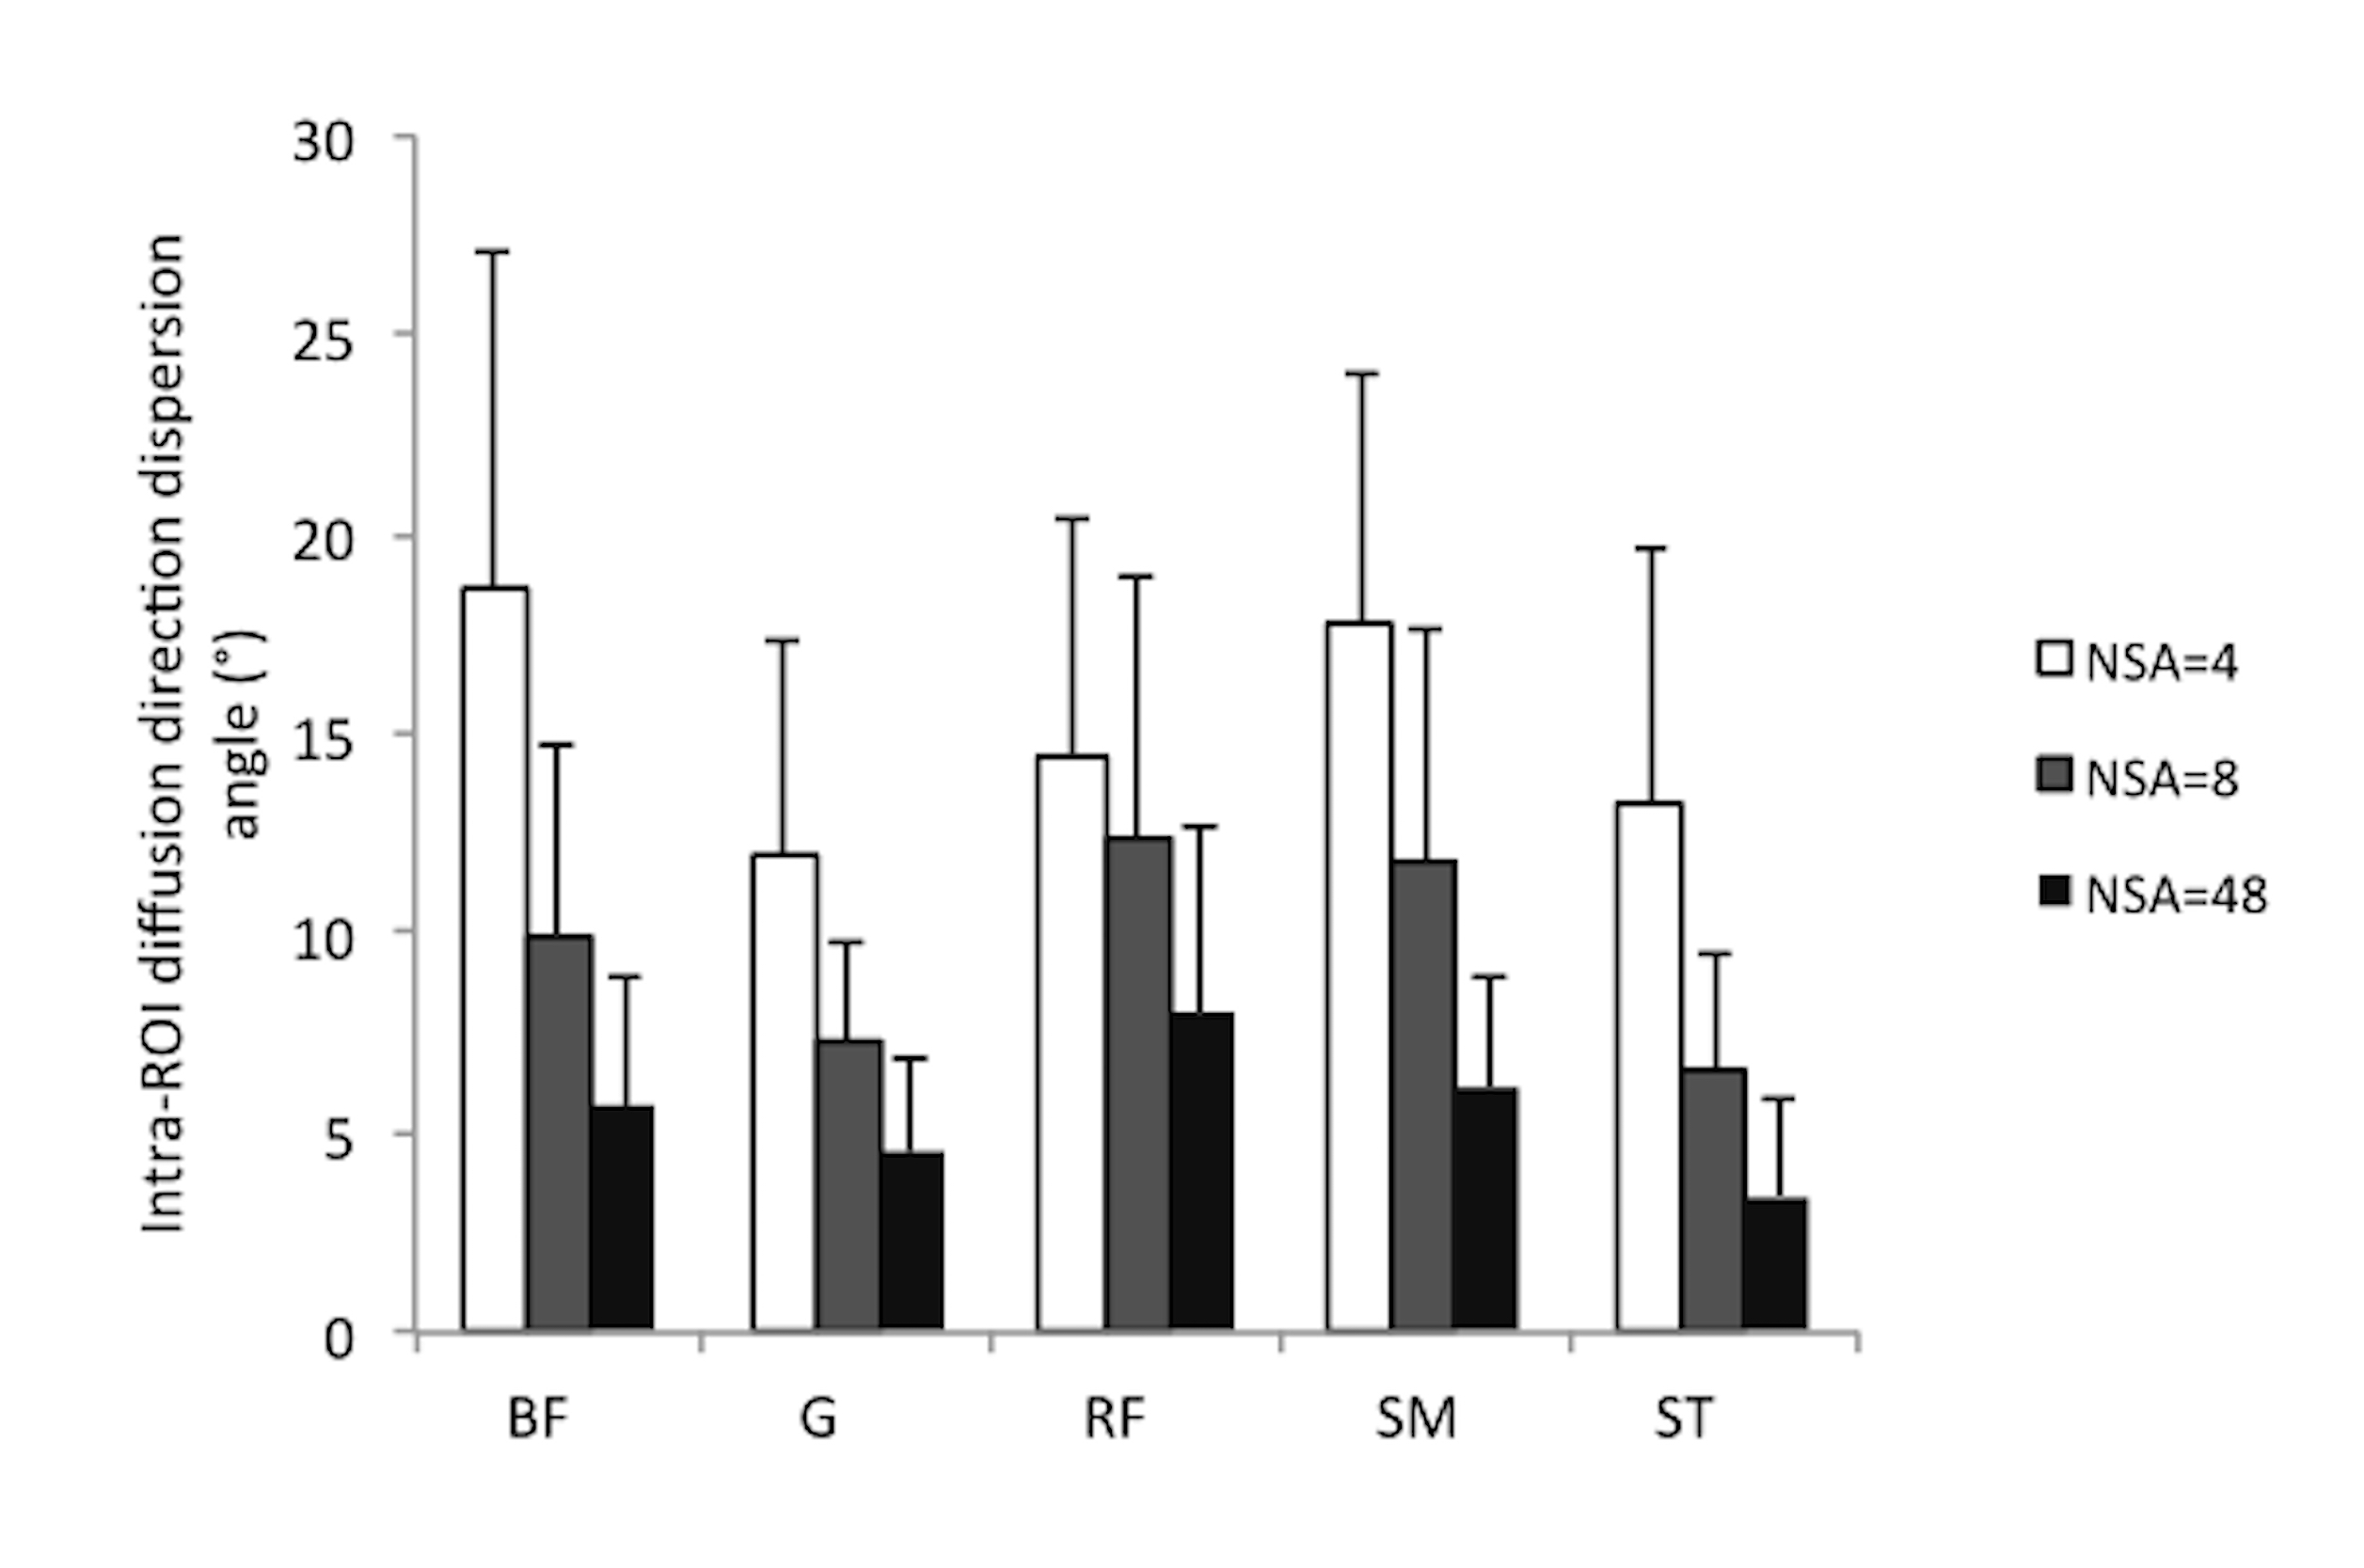
To establish a quality control index for estimating the reliability of ROI-based DTI-quantification results, a quantity called “intra-ROI diffusion direction dispersion angle” was introduced. A muscle ROI was divided into 4 sub-ROIs with approximately equal sizes. The ROI-based diffusion tensor was obtained for the original ROI and all sub-ROIs, then the angle between the primary diffusion direction of each sub-ROI and that of the original ROI was assessed. The average value of angles was calculated as the intra-ROI diffusion direction dispersion angle. The value of this angle is small if the SNR is high and the diffusion directions are uniform within the ROI.
Statistical analysis
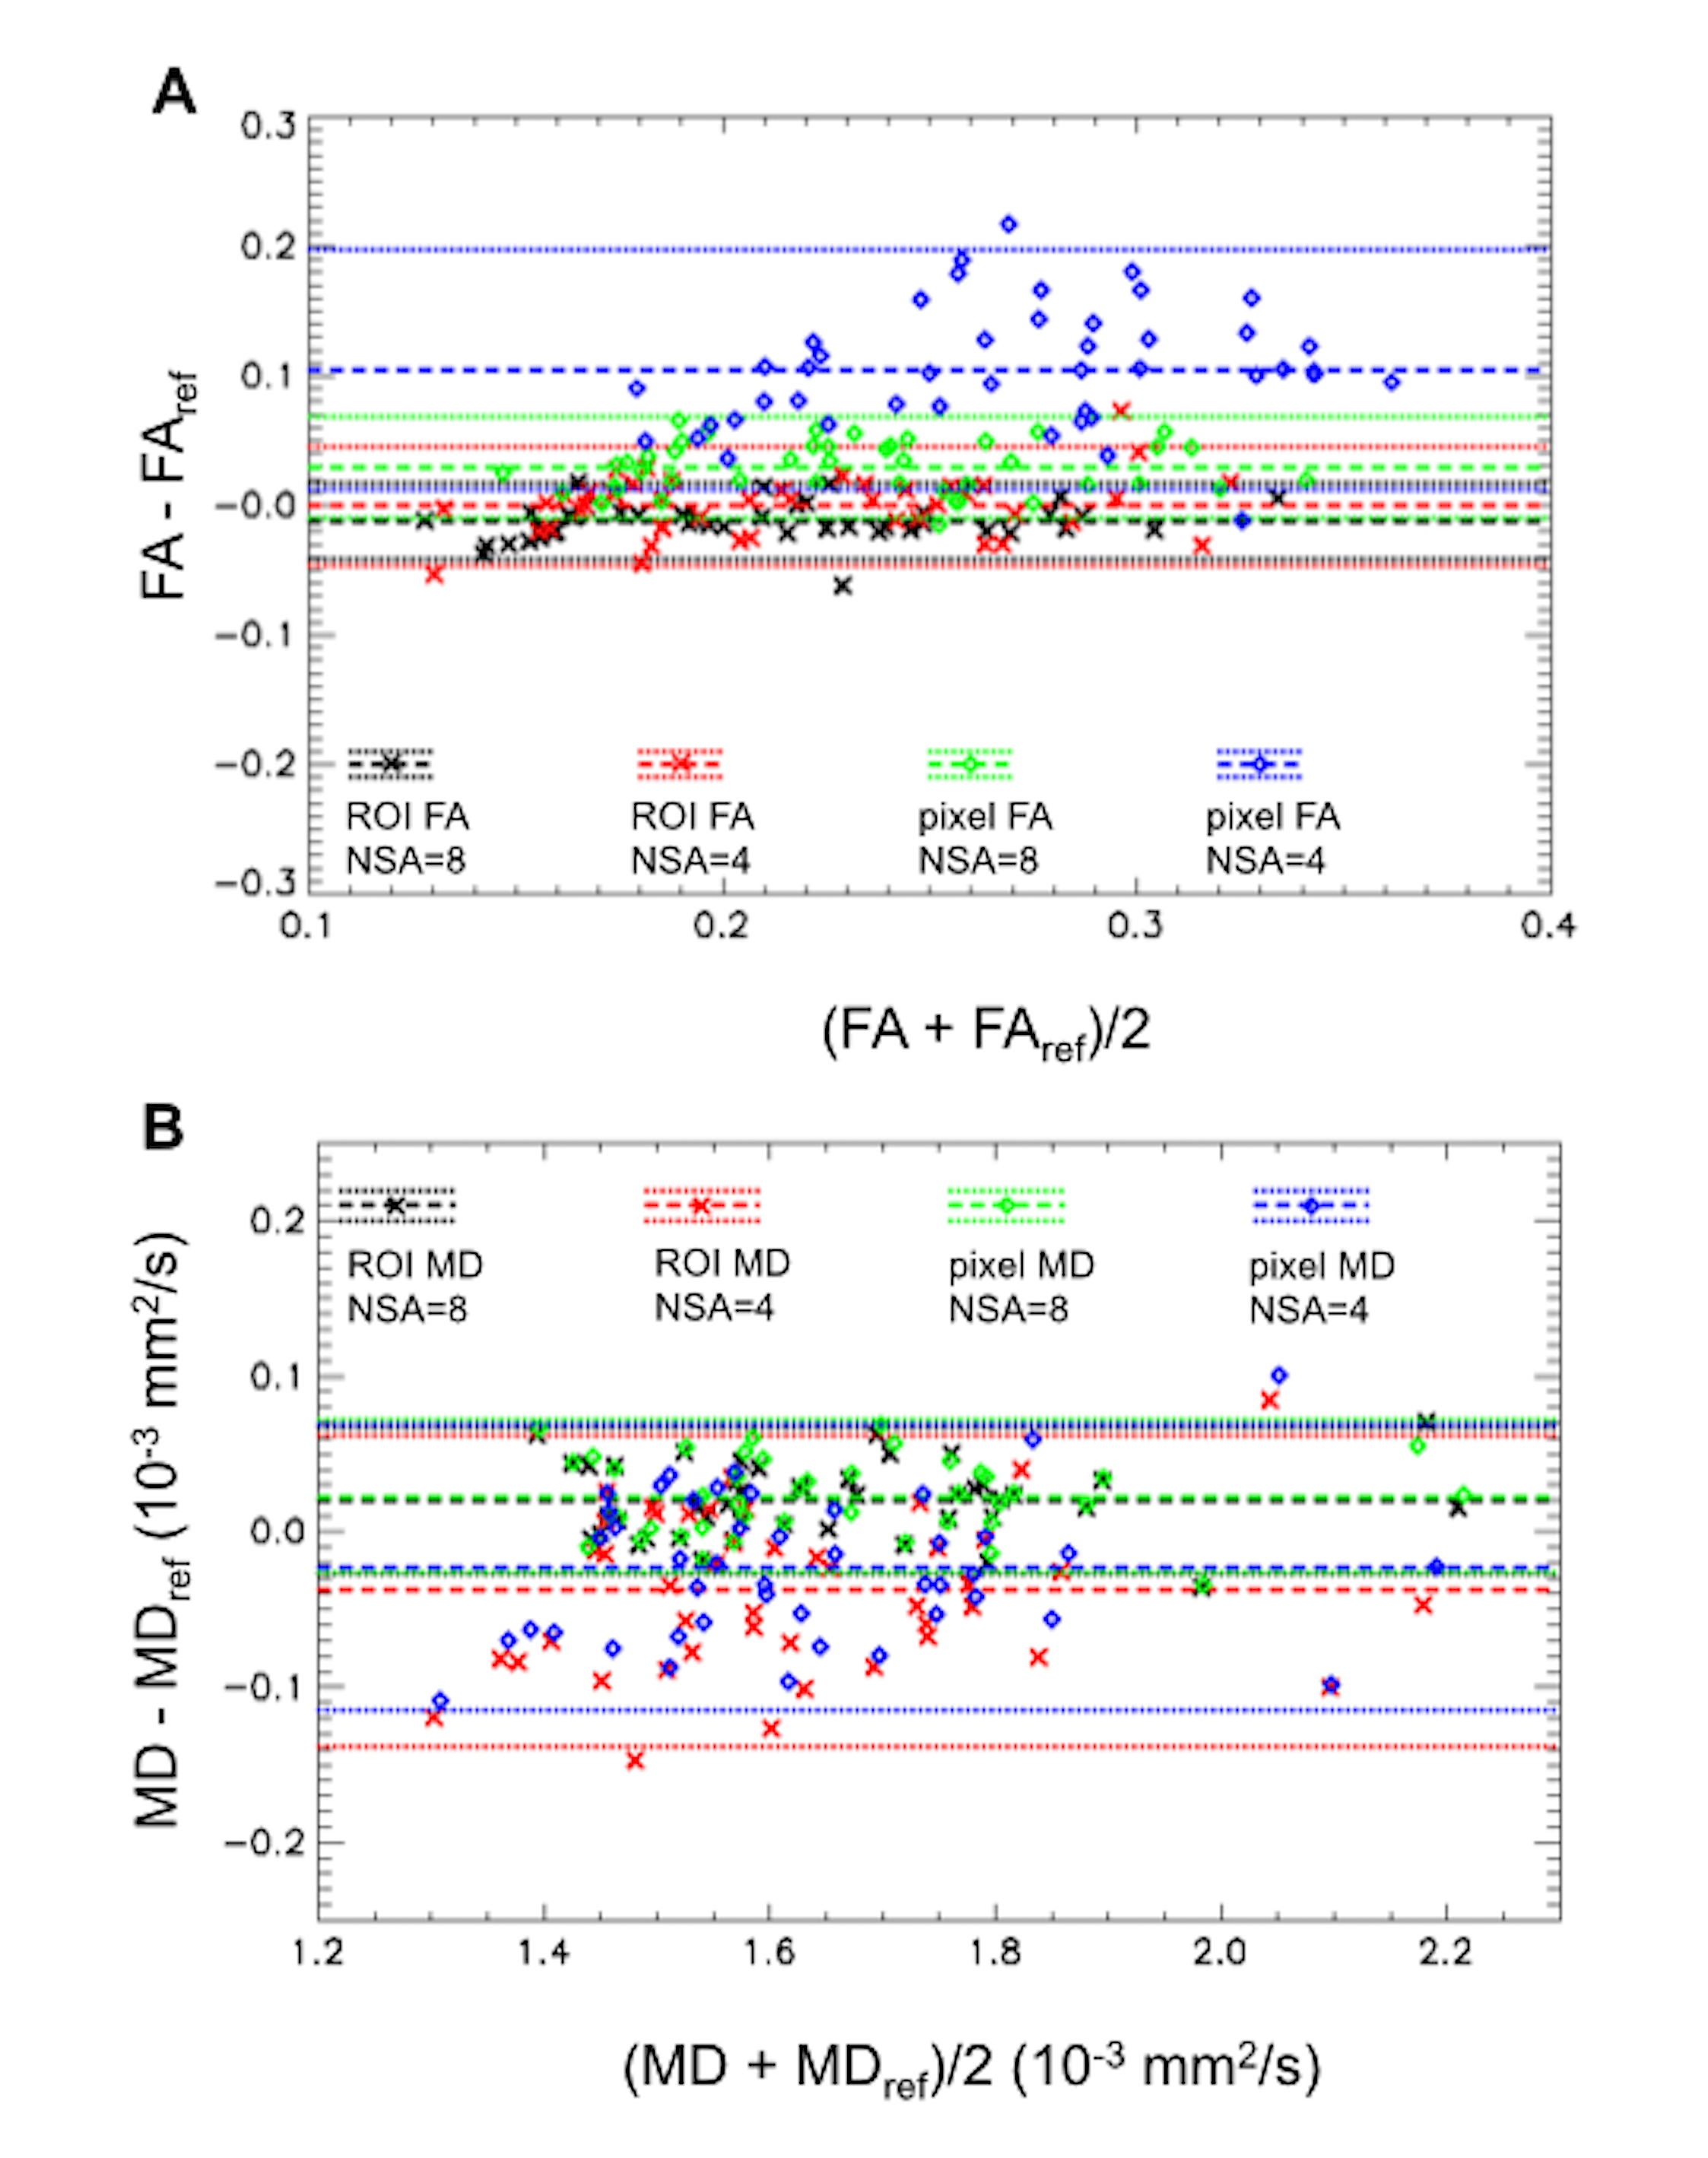
FA and MD values were first averaged over image sets with the same NSA for each muscle and subject before entering statistical analysis. Pixel-based DTI metrics from the image set with NSA=48 were used as reference values. Bar graphs were used to compare results for different NSAs and analysis methods. Bland-Altman plots were used to compare ROI-based and pixel-based DTI metrics with the reference values, and data from all muscles were combined in the plots.
Results
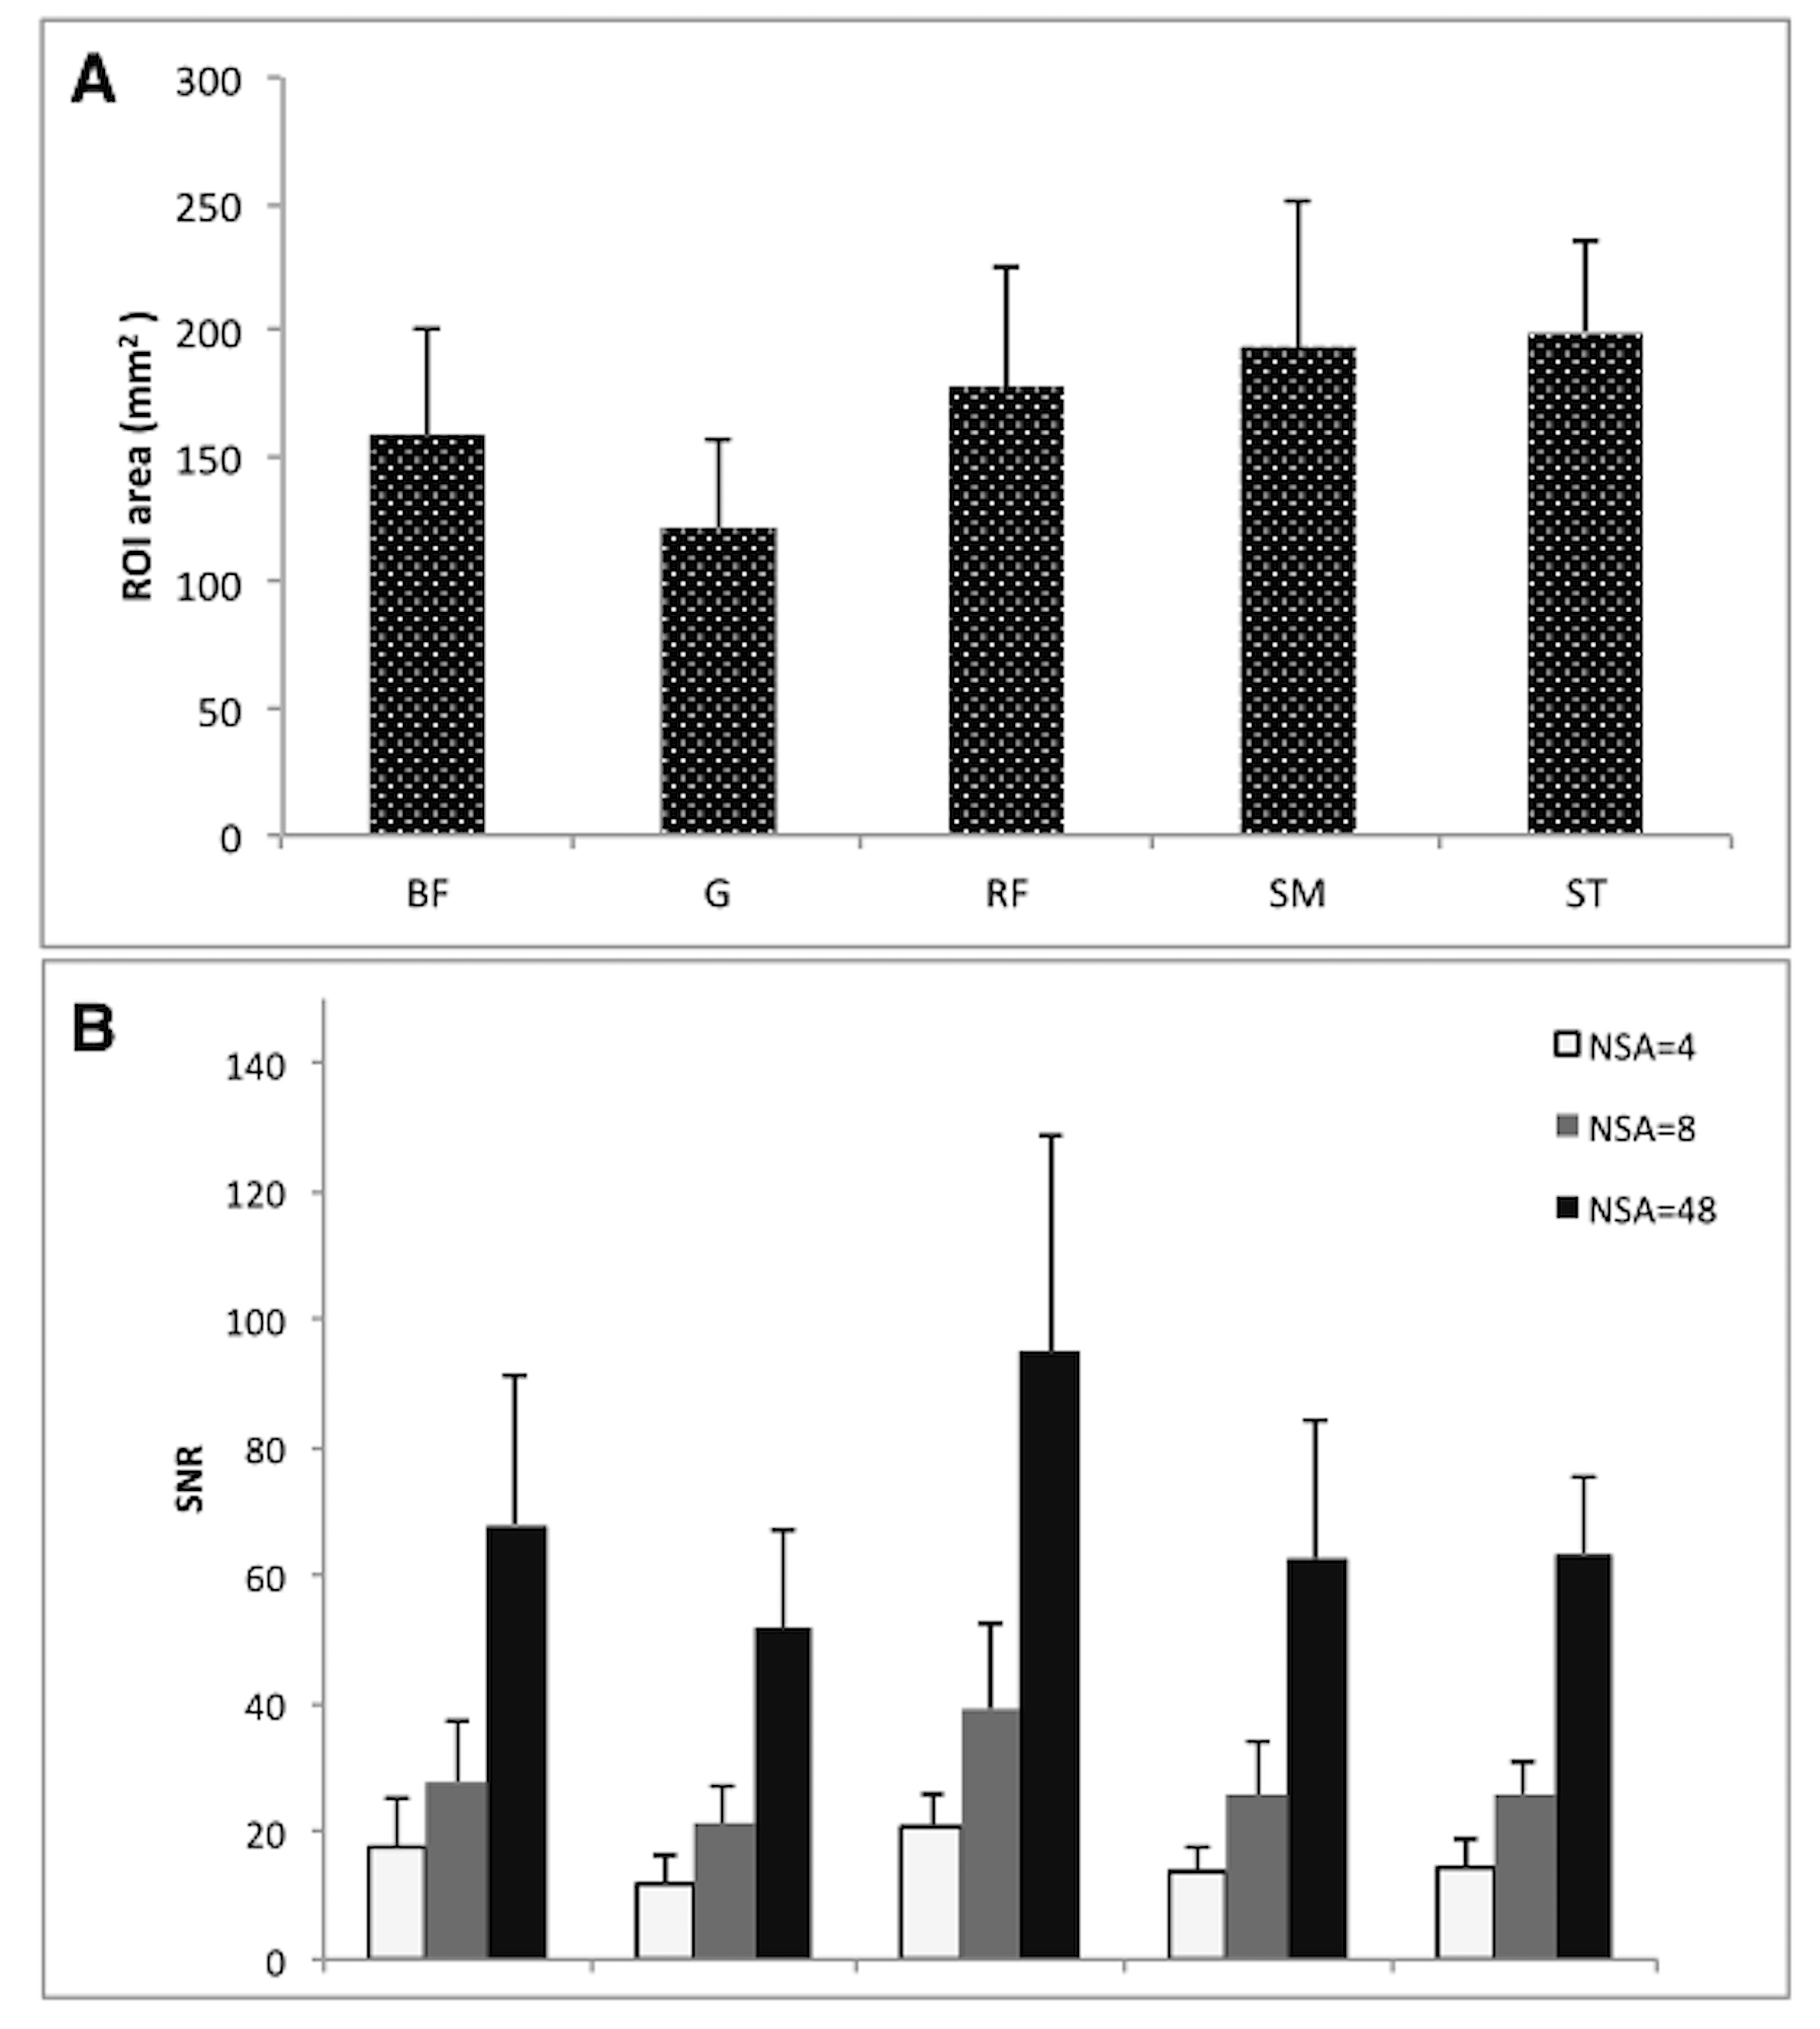
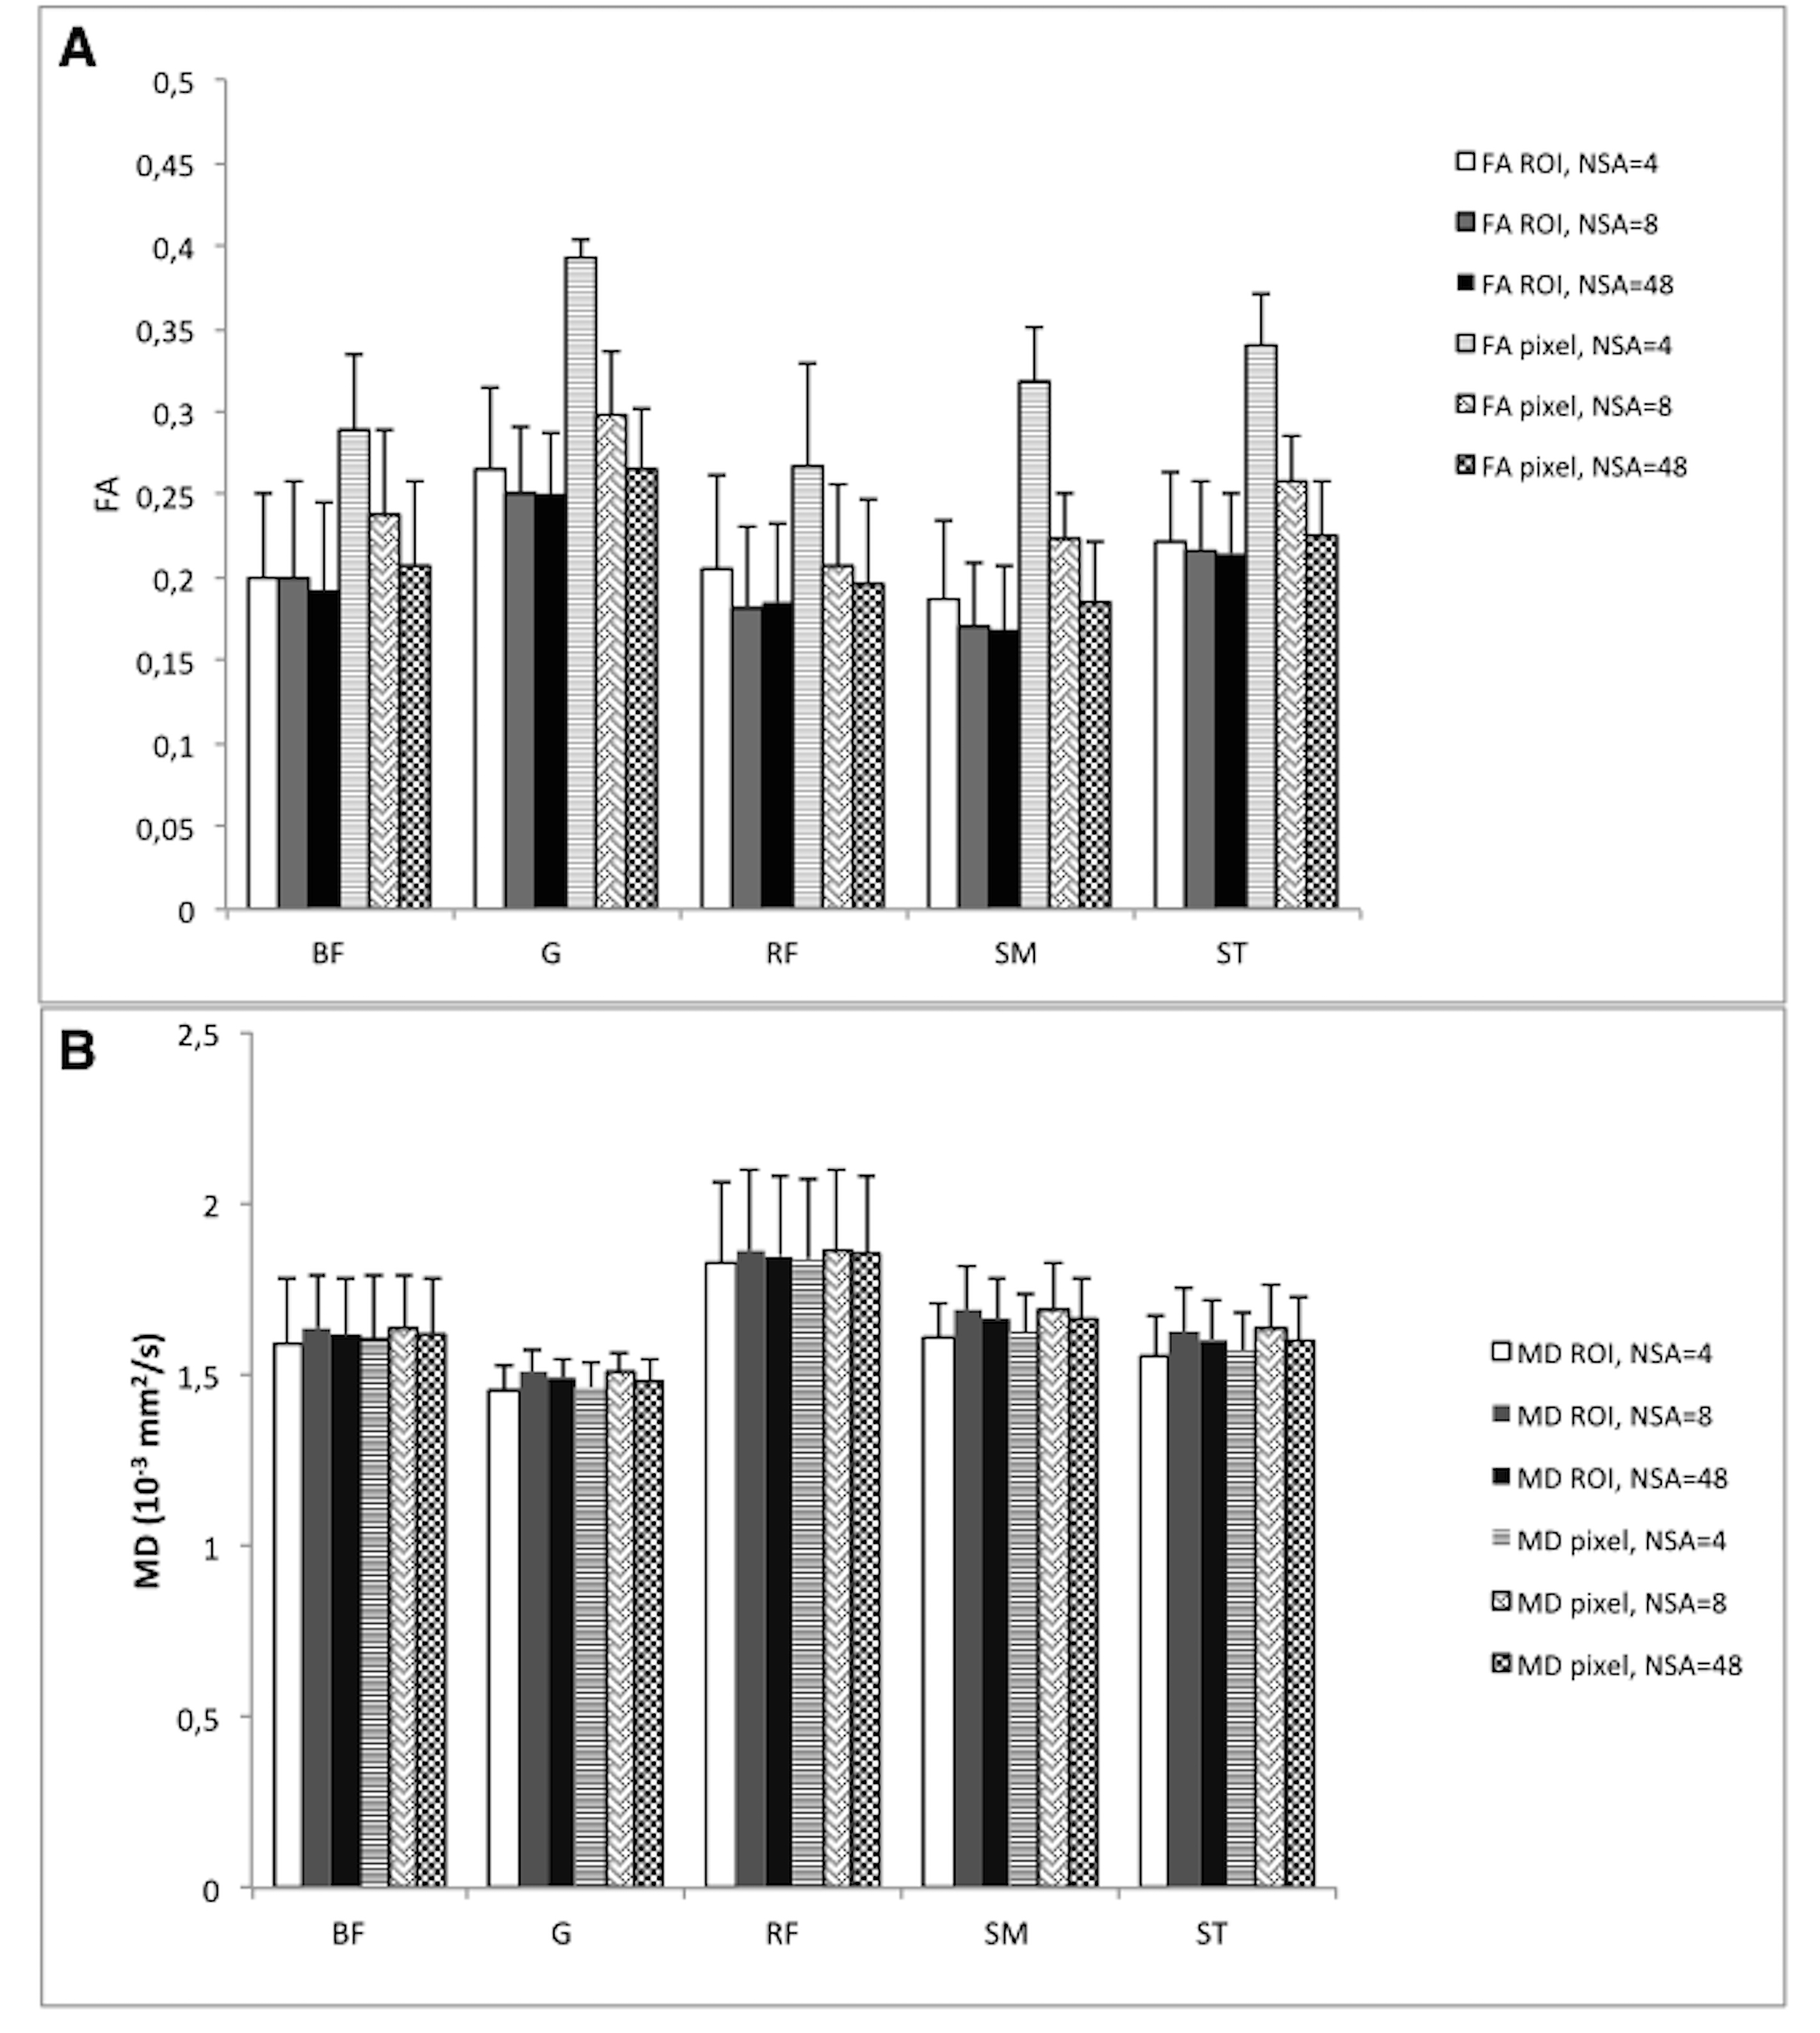
The mean ROI size varied according to muscle circumference in muscle groups assessed (Fig. 2 a). The SNR obtained at different NSA in the respective muscle varied considerable across muscles and corresponded to NSA (Fig. 2 b). With highest SNR values at NSA=48 ROI-based and pixel-based measurements agreed for FA and MD, whereas large disagreements were found for pixel-based values (Fig. 3 a, b). The MD values are less prone to noise than the FA values. The “intra-ROI diffusion direction dispersion angle” is larger with lower NSA (Fig. 4). Bland-Altman plots for comparison of ROI-based and pixel-based DTI metrics are shown in Fig. 5.Discussion and Conclusions
The ROI-based assessment of FA is less prone to bias due to poor SNR of the acquired DTI data in muscle studies. The “intra-ROI diffusion direction dispersion angle” could be applied together with SNR as a quantitative metric to assess reliability of ROI-based DTI-metrics. Validation of the ROI-based method using data in a patient cohort with variable degree of muscle fatty infiltration would be of interest in future.Acknowledgements
No acknowledgement found.References
1. Froeling M, Nederveen AJ, Nicolay K, Strijkers GJ. DTI of human skeletal muscle: the effects of diffusion encoding parameters, signal-to-noise ratio and T2 on tensor indices and fiber tracts. NMR Biomed 2013;26(11):1339-1352.
2. Wang ZJ, Chia JM, Ahmed S, Rollins NK. Signal-to-noise assessment for diffusion tensor imaging with single data set and validation using a difference image method with data from a multicenter study. Med Phys 2014;41(9):092302.
Figures