4998
Validity of skeletal muscle fiber type distinguished using q-space imaging1RIKEN Brain Science Institute, Saitama, Japan, 2Department of Physiology, Keio University School of Medicine, Tokyo, Japan, 3Central Institute for Experimental Animals, Kanagawa, Japan, 4Okinawa Institute of Science and Technology, Okinawa, Japan
Synopsis
We developed a technology that the muscle composition ratio can be non-invasively visualize at q-space imaging. And, these MR image confirmed validation by comparison to the skeletal muscle histology. We scanned diffusion data using 7T MRI scanner and performed analysis to calculate QSI index. The mice lower leg was stained by several solutions to enable muscle typing. As a result, the cell size by sections showing the correlation between the QSI indices. Moreover, the visualization in a staining compared, it is possible to obtain the same image. We confirmed validation by comparing the stained image to QSI.
Introduction
The ATPase staining method is a well-known technique used for the identification of skeletal muscle fiber types1. However, muscle biopsy is an invasive, complex procedure. The purpose of this study, was to evaluate the application of q-space imaging (QSI)2, which was proposed in 1990 by Callaghan for use with skeletal muscle. We developed a technology that the muscle fiber type composition ratio can be non-invasively visualize at MRI.Method
For MRI, a 7.0-Tesla magnetic resonance scanner (Biospec 70/16 MRI; Bruker BioSpin; Ettlingen, Germany) and a cryogenic 2-channel surface probe (Bruker BioSpin AG, Fallanden, Switzerland) were used. The imaging range of a mouse’s lower leg was an area around the greatest diameter of the lower leg. For the QSI pulse sequence, we used the diffusion-weighted stimulated-echo method pulse sequence. The DW-STE EPI method enables investigators to obtain high signals, even in tissues with extremely short T2 values and long diffusion times3. The imaging parameters used in the present study were as follows: repetition time (TR)/echo time (TE), 4000/12.6 ms; Δ/δ, 101.2/3.6 ms; input b-value, 0–4000 s/mm2; field of view (FOV), 100 × 100 μm2; matrix size, 160 × 160; slice thickness, 1 mm; motion probing gradient (MPG) moment, two axes (x and y). To determine the anatomical locations of the skeletal muscles, fast spin-echo T2WI was used. For QSI processing, imaging data were processed using an in-house program (IDL8.4; Exelis Visual Information Solutions). QSI indices were calculated by this program4 using the displacement, kurtosis, and cell diameter. For histology, the mouse’s lower leg was stained by several solutions (BA-D5, SC-71, BF-F3) to enable muscle typing using frozen section method. We measured cell diameter of stained images each fiber type by microscope. This study was approved by the local Animal Experiment Committee and was conducted in accordance with the Guidelines for Conducting Animal Experiments of the Japanese Central Institute for Experimental Animals.Results
The measuring sites in the reagion of interest were the tibialis anterior (TA) and soleus (SOL) muscles. Histological images were used to measured percentage of muscle type and cell diameters. TA was type 2b (over 90% of the total) and average cell diameter was 35.0±2.1 μm. SOL was type1 and type 2b (50% of the total, each) and 29.9±1.4 μm (Figs.1 and 3). The QSI indices were measured from a signal intensity curve (Fig. 2). As a result, displacement of the TA was 29.3+-2.5 μm and of the SOL was 23.6±1.6 μm; kurtosis of the TA was 35.0±3.17 a.u. and of the SOL was 29.4±1.9 a.u. (Fig.3). Figure 4 shows visualization of several QSI indices and histology.Discussion
The skeletal muscle cells can be differentiated into two cell types based on structural differences such as cell size and mitochondria number5. In this study, we attempted to type the several restricted cell structure at QSI. Distribution of the fiber type in the TA and SOL of mice lower legs is disproportionately large, which was confirmed under microscopy. The cell size measured by stained images show the correlation between the QSI indices (Fig.3). Slightly lower cell diameter in central nervous regions by QSI are known to be measured6. According to this principle, similar tendencies in skeletal muscle were observed. Moreover, the visualization comparing a stained image and QSI image (Fig.4), it is possible to obtain the same result that it can be distinguished the skeletal muscle fiber type. We confirmed validation by comparing stained images to QSI. Although challenges such as length of the imaging time remain, this technique is expected to be to be very significant as a tool for non-invasive classification of skeletal muscle fiber type.
Conclusion
We measured the restricted diffusion of the skeletal muscle cells by QSI method, developed an imaging technique to classify the different skeletal muscle fiber type was confirmed validity comparing the stained images.Acknowledgements
This work was supported by Japanese Ministry of Education, Culture, Sports, Science, and Technology Grant-in-Aid for Young Scientists (B) No. 26860982, 2016.References
1. Ringqvist M., et al. Histochemical fiber types and fiber sizes in human masticatory muscles. Scand J Dent Res. 1971;79(5):366-8.
2. Callaghan P. T., Coy A., MacGowan D., et al. Diffraction-like effects in NMR diffusion studies of fluids in porous solids. Nature 1991;351:467-9.
3. Hata J, Yagi K, Hikishima K, et al. Characteristics of diffusion-weighted stimulated echo pulse sequence in human skeletal muscle. Radiol Phys Technol 2013;6:92-7.
4. Fujiyoshi K, Hikishima K, Nakahara J, et al. Application of q-Space Diffusion MRI for the Visualization of White Matter. J Neurosci. 2016;36(9):2796-808.
5. Johnson MA, Polgar J, Weightman D, et al. Data on the distribution of fibre types in thirty-six human muscles. An autopsy study. J Neurol Sci. 1973;18(1):111-29.
6. K. Hikishima, K. Yagi, T. Numano, et al. Volumetric q-space imaging by 3D diffusion-weighted MRI. Magn. Reson. Imaging, 2008;26(4):437–445
Figures
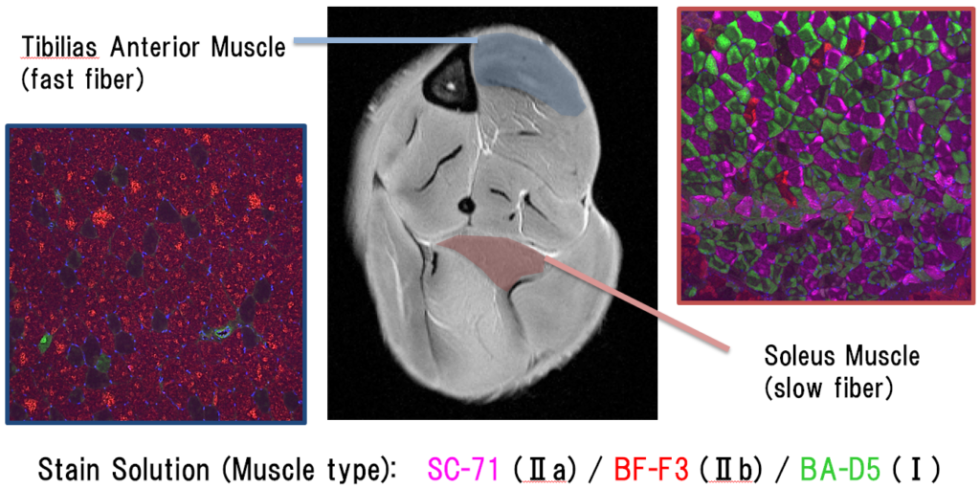
Figure 1. Select region of interest and stained images
For MRI analysis, setting of ROI of mouse lower leg skeletal muscle using morphological imaging ROI is set on morphological images obtained by T2-weighted spin echo pulse sequence. The area surrounded by a blue area represents the tibialis anterior muscle: TA. The area surrounded by a red area represents the soleus muscle: SOL. The histology of each of the regions is shown on both sides. These are frozen sections. Skeletal muscle type1 was stained by BA-D5 solutions; type2a was SC-71; and type2b was BF-F3.
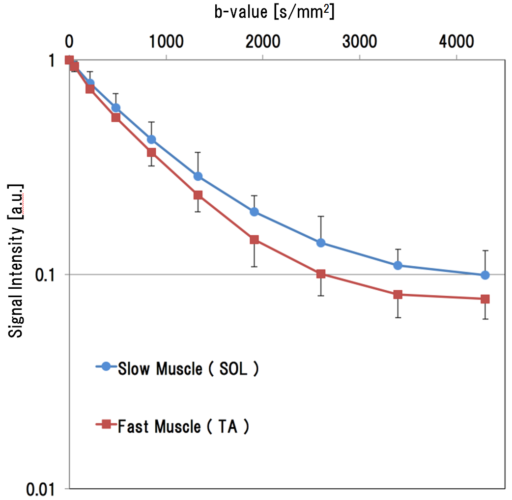
Figure 2. Diffusion signal intensity curve
For the QSI pulse sequence, we used the diffusion-weighted stimulated-echo method pulse sequence. The imaging parameters used in the present study were as follows: repetition time (TR)/echo time (TE), 4000/12.6 ms; Δ/δ, 101.2/3.6 ms; input b-value, 0 – 4000 s/mm2. This blue signal intensity curve is SOL, red one is TA in this figure.
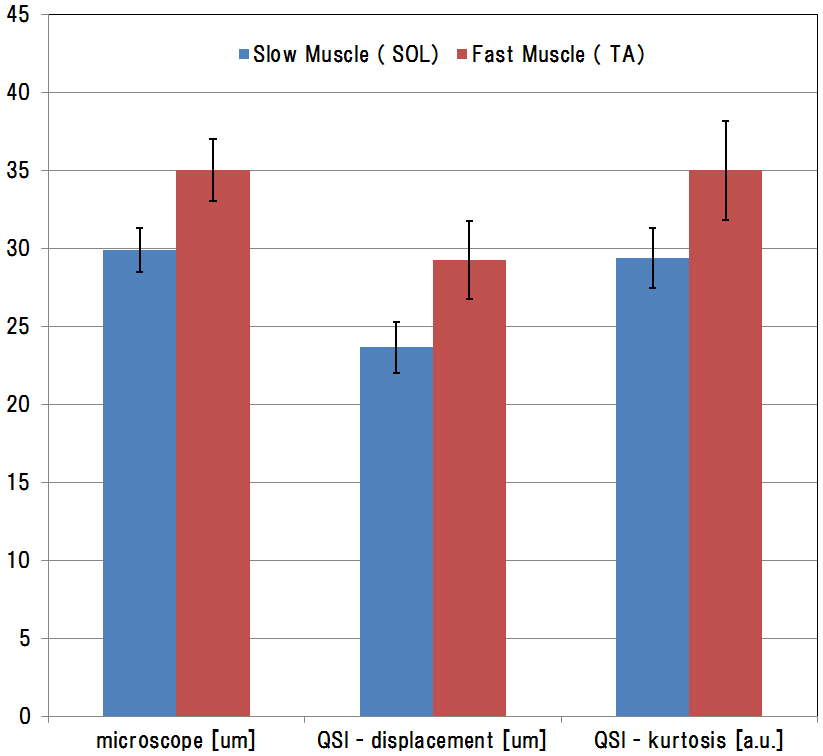
Figure 3. The result value of QSI and stained images
Left of this graph is the diameter [μm] of the skeletal muscle cells was measured from sections microscopically. The center is a displacement, the right is the kurtosis by QSI analysis. Any values significant difference between the TA and SOL have appeared. Cell diameters measured microscopically and the displacement using QSI were very similar.
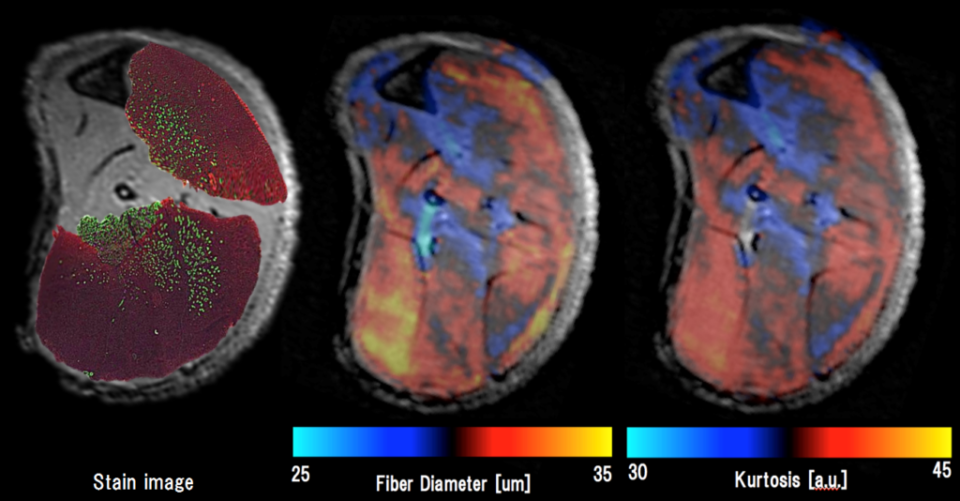
Figure 4. Visualization of skeletal muscle fiber type
The figure on the left shows a stained image of the skeletal muscle cells; the center shows the cell diameter calculated by displacement; the right shows kurtosis. All the figures are superimposed morphological images (SE-T2WI). The color bar was set a median value is black and from the histogram. Lower signal was set to be blue and the higher was set to be in the red. Red is fast muscle and green is slow muscle on histological images.