4993
T1ρ and Dynamic BOLD MR imaging to evaluate the change of skeletal muscles of lower extremity in diabetes patients1Department of Radiology, Zhongda Hospital, Medical School, Southeast University, Nanjing, People's Republic of China, 2Department of Radiology, Zhongda Hospital, Medical School, Southeast University
Synopsis
This study aimed to measure the BOLD response in the calf muscle in T2DM patients during post-occlusive reactive hyperemia and to study whether T1ρ MR Imaging of calf muscle could differentiate T2DM patients from normal subjects. Twenty-two T2DM patients and twenty age-matched healthy volunteers were performed MR scanning. T1ρ relaxation time and maximal ΔT2* change (ΔT2*max) and time to peak (TTP) were measured. Our results showed that the lower degree of the increase (ΔT2*max and TTP) in calf muscles of DM patients. In addition, T1ρ relaxation time in TA muscle was significant higher in DM patient than in healthy subjects.
Introduction Type 2 diabetes mellitus (T2DM) affects vascular health, typically in the lower extremities, by impairing blood flow at the macrovascular and microvascular levels. Blood oxygen level-dependent (BOLD) contrast, using deoxyhemoglobin as an endogenous contrast agent, can be applied for noninvasive measurement the change of muscle oxygenation during post-occlusion reactive hyperemia non-invasively in PAD patients1. Our previous study demonstrated that T1ρ relaxation time can be used to differentiate the fast- and slow- twitch skeletal muscle as well as potentially age-, gender- and exercise-related differences (2). In our study, we aimed to measure the BOLD response in the calf muscle in T2DM patients during post-occlusive reactive hyperemia and to study whether T1ρ MR Imaging could differentiate patients with DM from normal subjects.
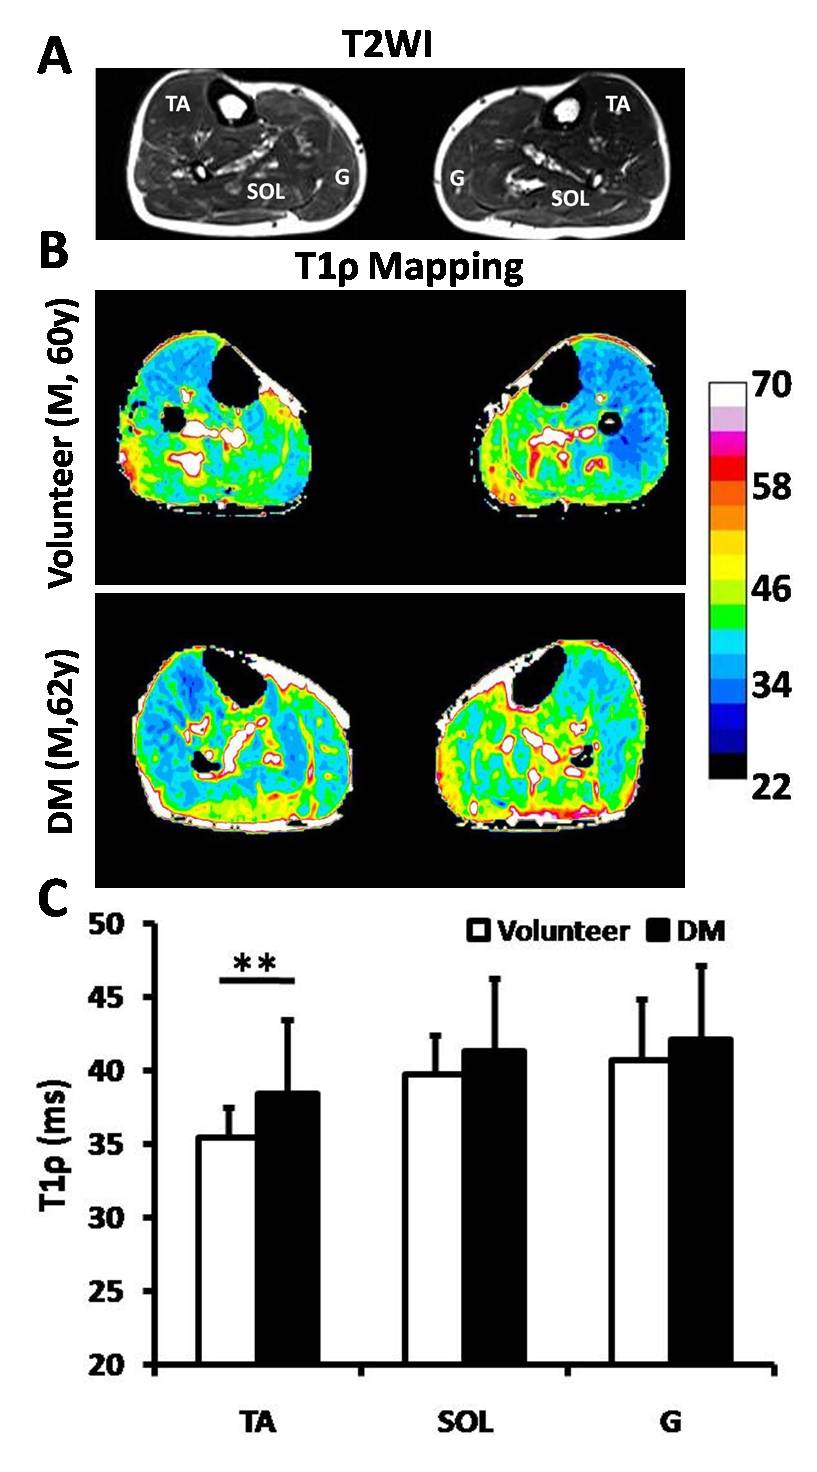
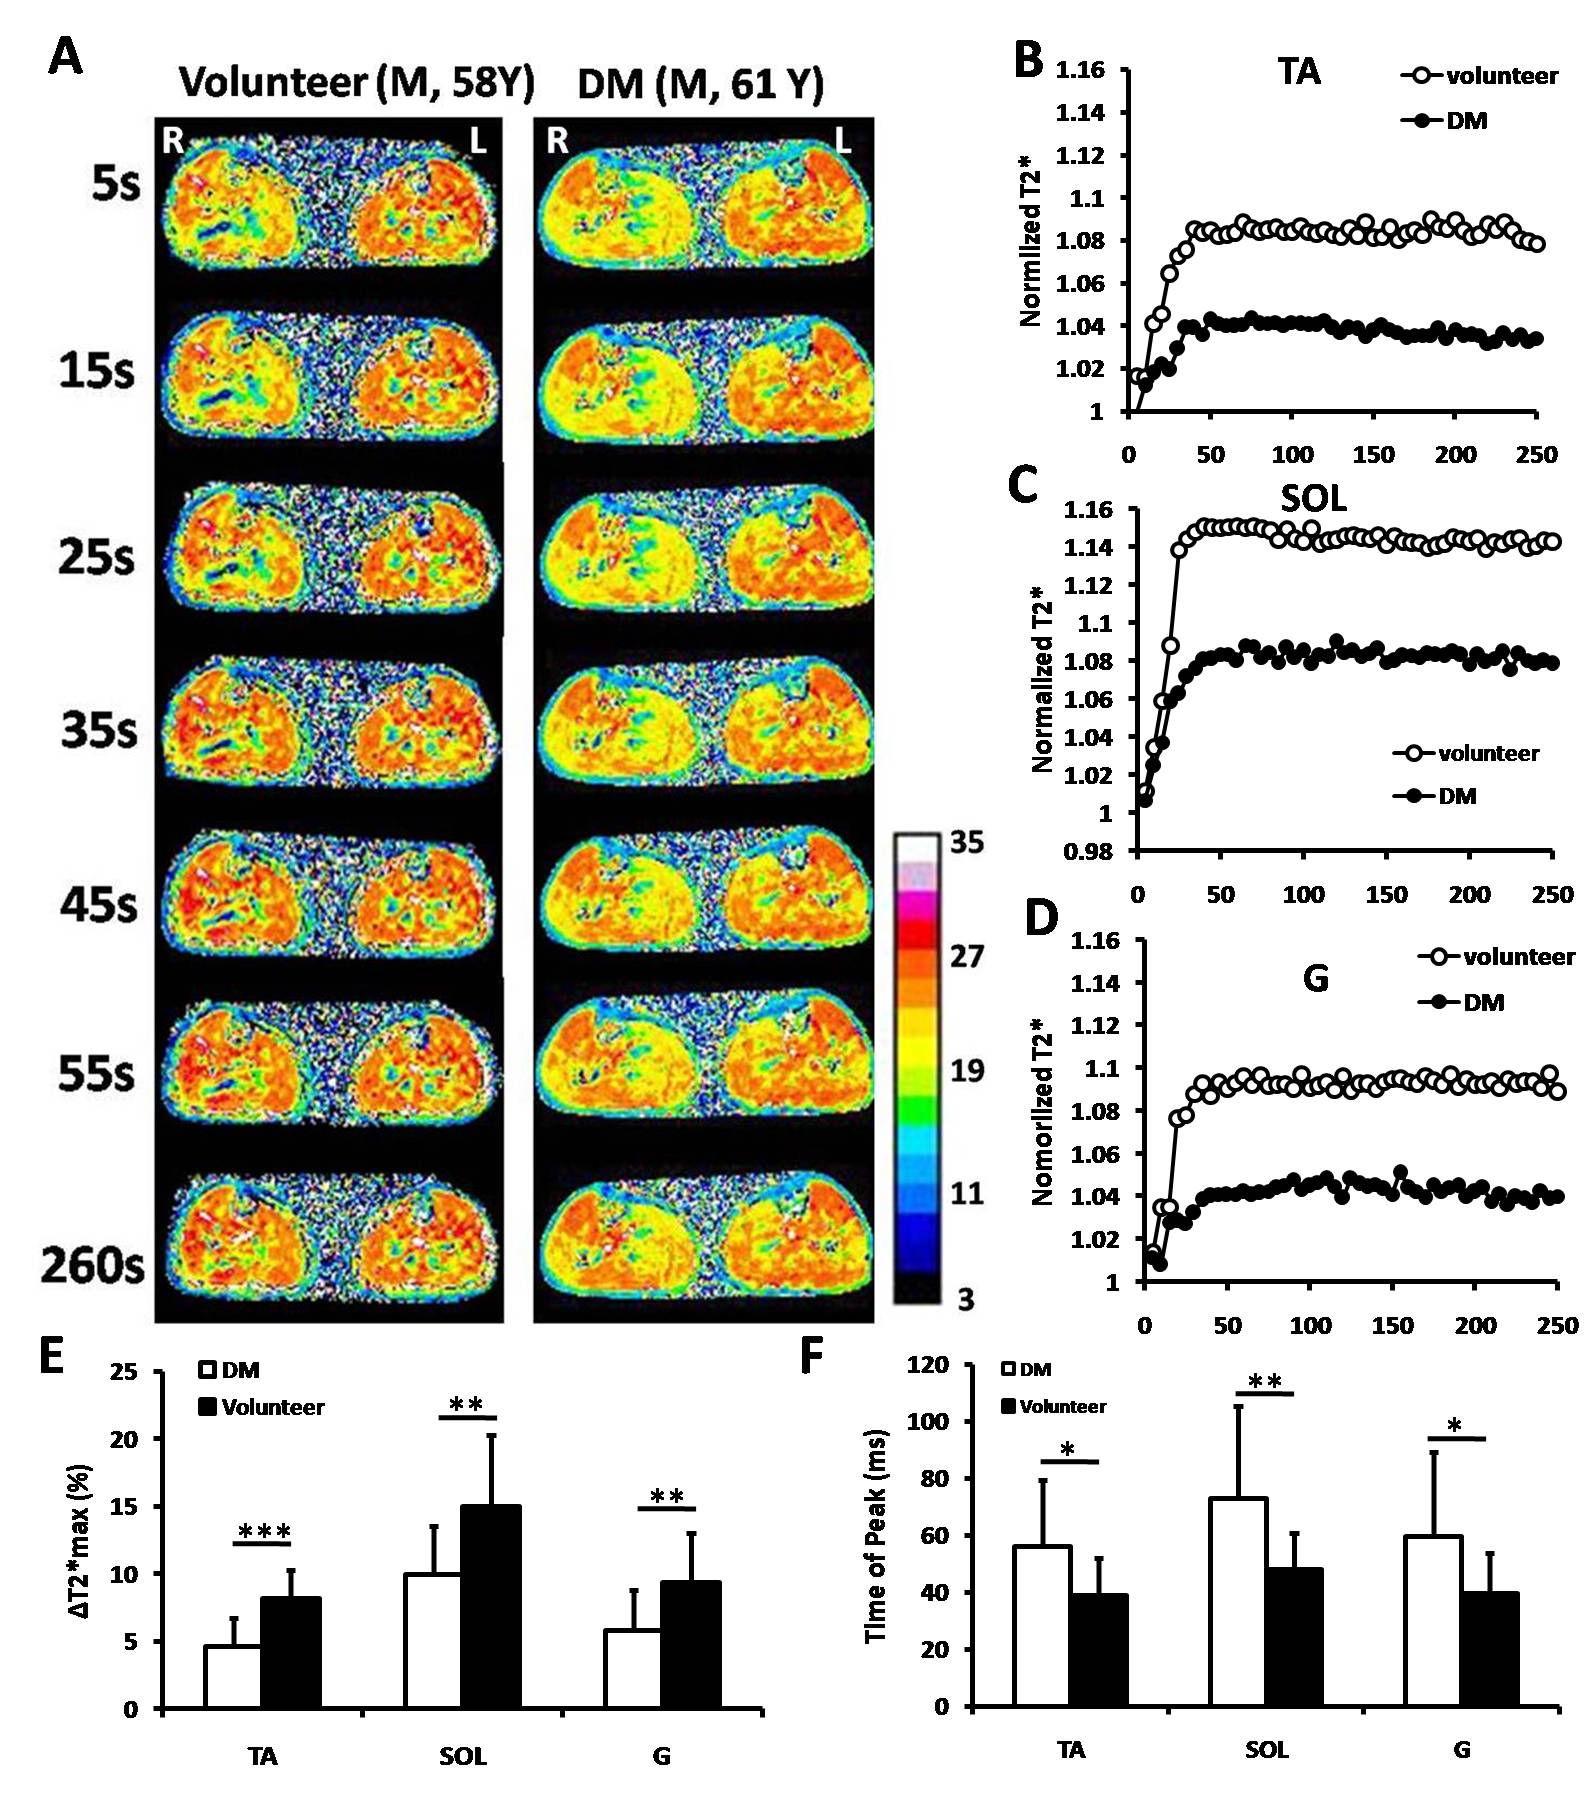
Method This study was performed under the approval of the Ethics Committee. Written informed consent was obtained from T2DM patients and age-matched healthy volunteers. All images were acquired with a 3.0-Tesla whole-body MR scanner (Siemens, Erlangen, Germany) with a four-channel matrix coil. For the T1ρ measurement, a rotary echo spin-lock pulse is applied in a two-dimensional T1ρ-prepared fast spin-echo sequence with times of spin-lock of 5ms, 12ms, 24ms, 36ms, 48ms and 60ms2. To evaluate T2* effects, a single-shot multi-echo gradient recalled echo sequence with fat suppression and a temporal resolution of 1 measurement per 5 second (52 measurements, 260 second). Before BOLD scanning, reactive hyperemia was provoked with a cuff-compression paradigm (50 mmHg). After BOLD MRI measurements started 2 times (about 10 seconds), the cuff was deflated and continued for the remaining 250 seconds. 2 parameters were measured: maximal ΔT2* change (ΔT2*max) and time to peak (TTP) for each of the tibial anterior, soleus and gastrocnemius muscles separately.
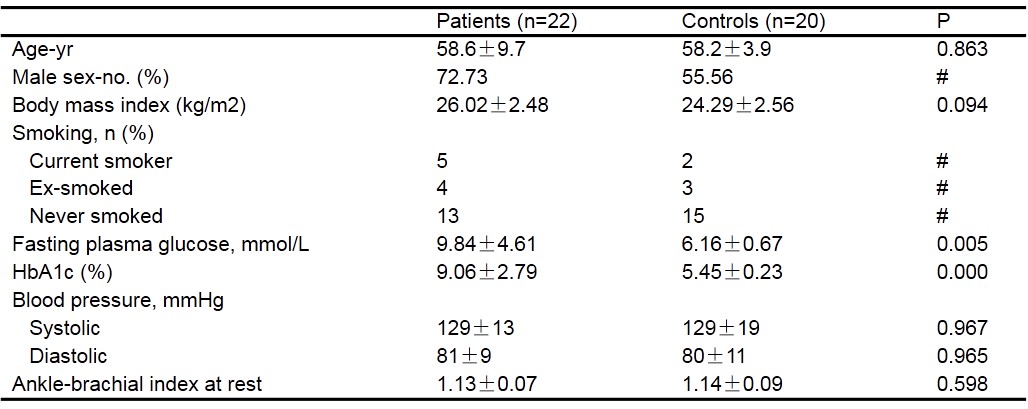
Result The baseline characteristics of the study population were summarized in Table 1. The T1ρ relaxation time in TA muscle was significant higher in T2DM patients than in healthy subjects (P<0.001) (Figure1). There were no significant differences in SOL and G muscle (P=0.089 and P=0.255, respectively). After post-occlusive reactive hyperemia, all 3 muscles in both investigated groups showed an increase in T2* relaxation time. We found that the difference in the degree of the increase (ΔT2*max) and TTP between the volunteers and DM patients after compared the T2* time courses. The ΔT2*max of the three muscle in DM patients was statistically significantly lower compared with the healthy volunteers (P<0.05). Moreover, the TTPs of TA, SOL and G muscle in the DM patient group were significantly delayed (P<0.05) (Figure2).
Discussion Microvascular dysfunction in diabetes is manifested by an increased vascular permeability and impaired auto-regulation of blood flow and vascular tone. The most notably structural changes in diabetic microcirculation exist a thickening of the capillary basement membrane, which to impair the migration of leukocytes and the hyperemic response3. Our results showed that the lower degree of the increase (ΔT2*max) and the time to peak (TTP) in all 3 muscles of DM patients was associated with the vascular reactivity of calf muscle. In addition, T1ρ relaxation time in TA muscle was significant higher in DM patient than in healthy subjects.
Conclusion The study demonstrated that noninvasive T1ρ MRI and dynamicT2* relaxation time after post-occlusive reactive hyperemia display the difference of skeletal muscle between T2DM patients and healthy volunteers.
Acknowledgements
No acknowledgement found.References
1. Zuo CS, , Sung Y-H, Simonson DC, et al. Reduced T2* Values in Soleus Muscle of Patients with Type 2 Diabetes Mellitus. PLoS One 2012, 7(11):e49337. 2. Peng XG, Wang YC, Zhang SJ, et al. Non-invasive Assessment of Age, Gender and Exercise Effects on Skeletal Muscle: Initial Experience with T1ρ MR Imaging of Calf Muscle. J Magnet Reson Imaging, Accecpt 2016. 3. Wu W-C, Mohler E, Ratcliffe SJ, et al. Skeletal Muscle Microvascular Flow in Progressive Peripheral Artery DiseaseAssessment With Continuous Arterial Spin-Labeling Perfusion Magnetic Resonance Imaging. J Am Coll Cardiol 2009, 53(25):2372-2377.Figures