4992
Stimulated Echo DTI in skeletal muscle of patients with Becker Muscular Dystrophy1Department of Radiology, Leiden University Medical Center, C.J. Gorter Center for High-field MRI, Leiden, Netherlands, 2NMR laboratory, Institute of Myology, Paris, France, 3Institute of Child Health, University College of London, London, United Kingdom, 4Institute of Cellular Medicine and Newcastle Magnetic Resonance Centre, Newcastle University, Newcastle upon Tyne, United Kingdom, 5Department of Neurology, Leiden University Medical Center, Leiden, Netherlands
Synopsis
Cellular sizes in skeletal muscle are significantly larger than in the brain. Therefore standard spin-echo (SE)-DTI with inherently short diffusion times may lack sensitivity for the study skeletal muscle of neuromuscular disorders (NMDs). Alternatively, stimulated-echo (STE-)DTI allows for much longer diffusion times, increasing sensitivity to cell size. Due to the challenges presented by fat replacement STE-DTI has not been previously applied in NMDs. Here, we show that STE-DTI is feasible in Becker Muscular Dystrophy patients, and can detect FA differences compared to healthy controls in mildly affected muscles.
BACKGROUND
Quantitative imaging is of growing importance in the evaluation of neuromuscular dystrophies (NMD) therapy as it offers a non-invasive and more objective alternative to biopsies and functional tests. Diffusion Tensor Imaging (DTI) is gaining popularity since it can probe muscle architecture on the cellular level. This is particularly important in NMDs, which are characterized by muscle membrane damage and fat infiltration. While DTI has been applied extensively in healthy muscles and muscle injury,1 its application to NMD is limited, primarily due to the challenges posed by fat infiltration. As cellular sizes in muscle are significantly larger than in the brain, it is questionable whether the standard spin-echo (SE)-based implementation of DTI is the most sensitive method in NMDs. Indeed, when using SE, the diffusion process is probed only over distances that are shorter than muscle fiber size.2,3 Alternatively, stimulated-echo (STE-)DTI allows for long mixing times, increasing sensitivity to cell size. However, STE involves a reduction in SNR and has never been applied in NMD. Here, we show that STE-DTI is feasible in Becker Muscular Dystrophy patients (BMD), and can be sensitive to differences with healthy controls.METHODS
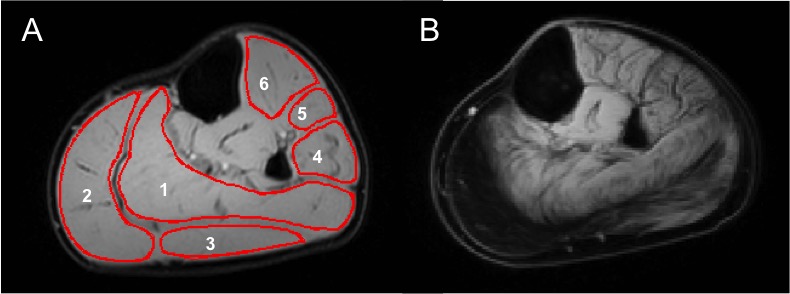
The lower leg of 7 BMD patients (21-58 year-old) and 6 healthy controls (33-60 year-old) were scanned on a 3T Philips Ingenia scanner with a 16-element receive coil. STE-DTI was acquired (TE/TR=50/5000ms, b=400s/mm2, 12 directions, TM=100ms, voxel size=2x2x6 mm3) with fat suppression using SPAIR and SSGR for the aliphatic peaks combined with 6-point Dixon for olefinic fat suppression.4 Noise maps were acquired using STE-DTI without RF excitation. Water/fat imaging was performed using a 3-point Dixon sequence (23 slices; slice thickness/gap=10/5mm; TR/TE/ΔTE=210/4.41/0.76ms; 2 averages; FA=8°; resolution=1x1x10mm3).4 DTI data was denoised with Pierrick Coupe's MRI Denoising toolkit,5 registered in Elastix,6 and olefinic fat was suppressed with an in-house Matlab routine. Fractional anisotropy (FA) and mean diffusivity (MD) maps were computed in the Camino Diffusion MRI Toolkit.7 All variables were extracted from matching regions of interest (ROI) drawn in six muscles – soleus, medial gastrocnemius, lateral gastrocnemius, peroneus, extensor digitorum longus, and tibialis anterior (TA), and care was taken to avoid fascia. Results are reported as the mean of all pixels within an ROI (Figure 1). A SNR cutoff was determined based on FA and MD control data. Group results were compared using a non-parametric Mann-Whitney U test.RESULTS
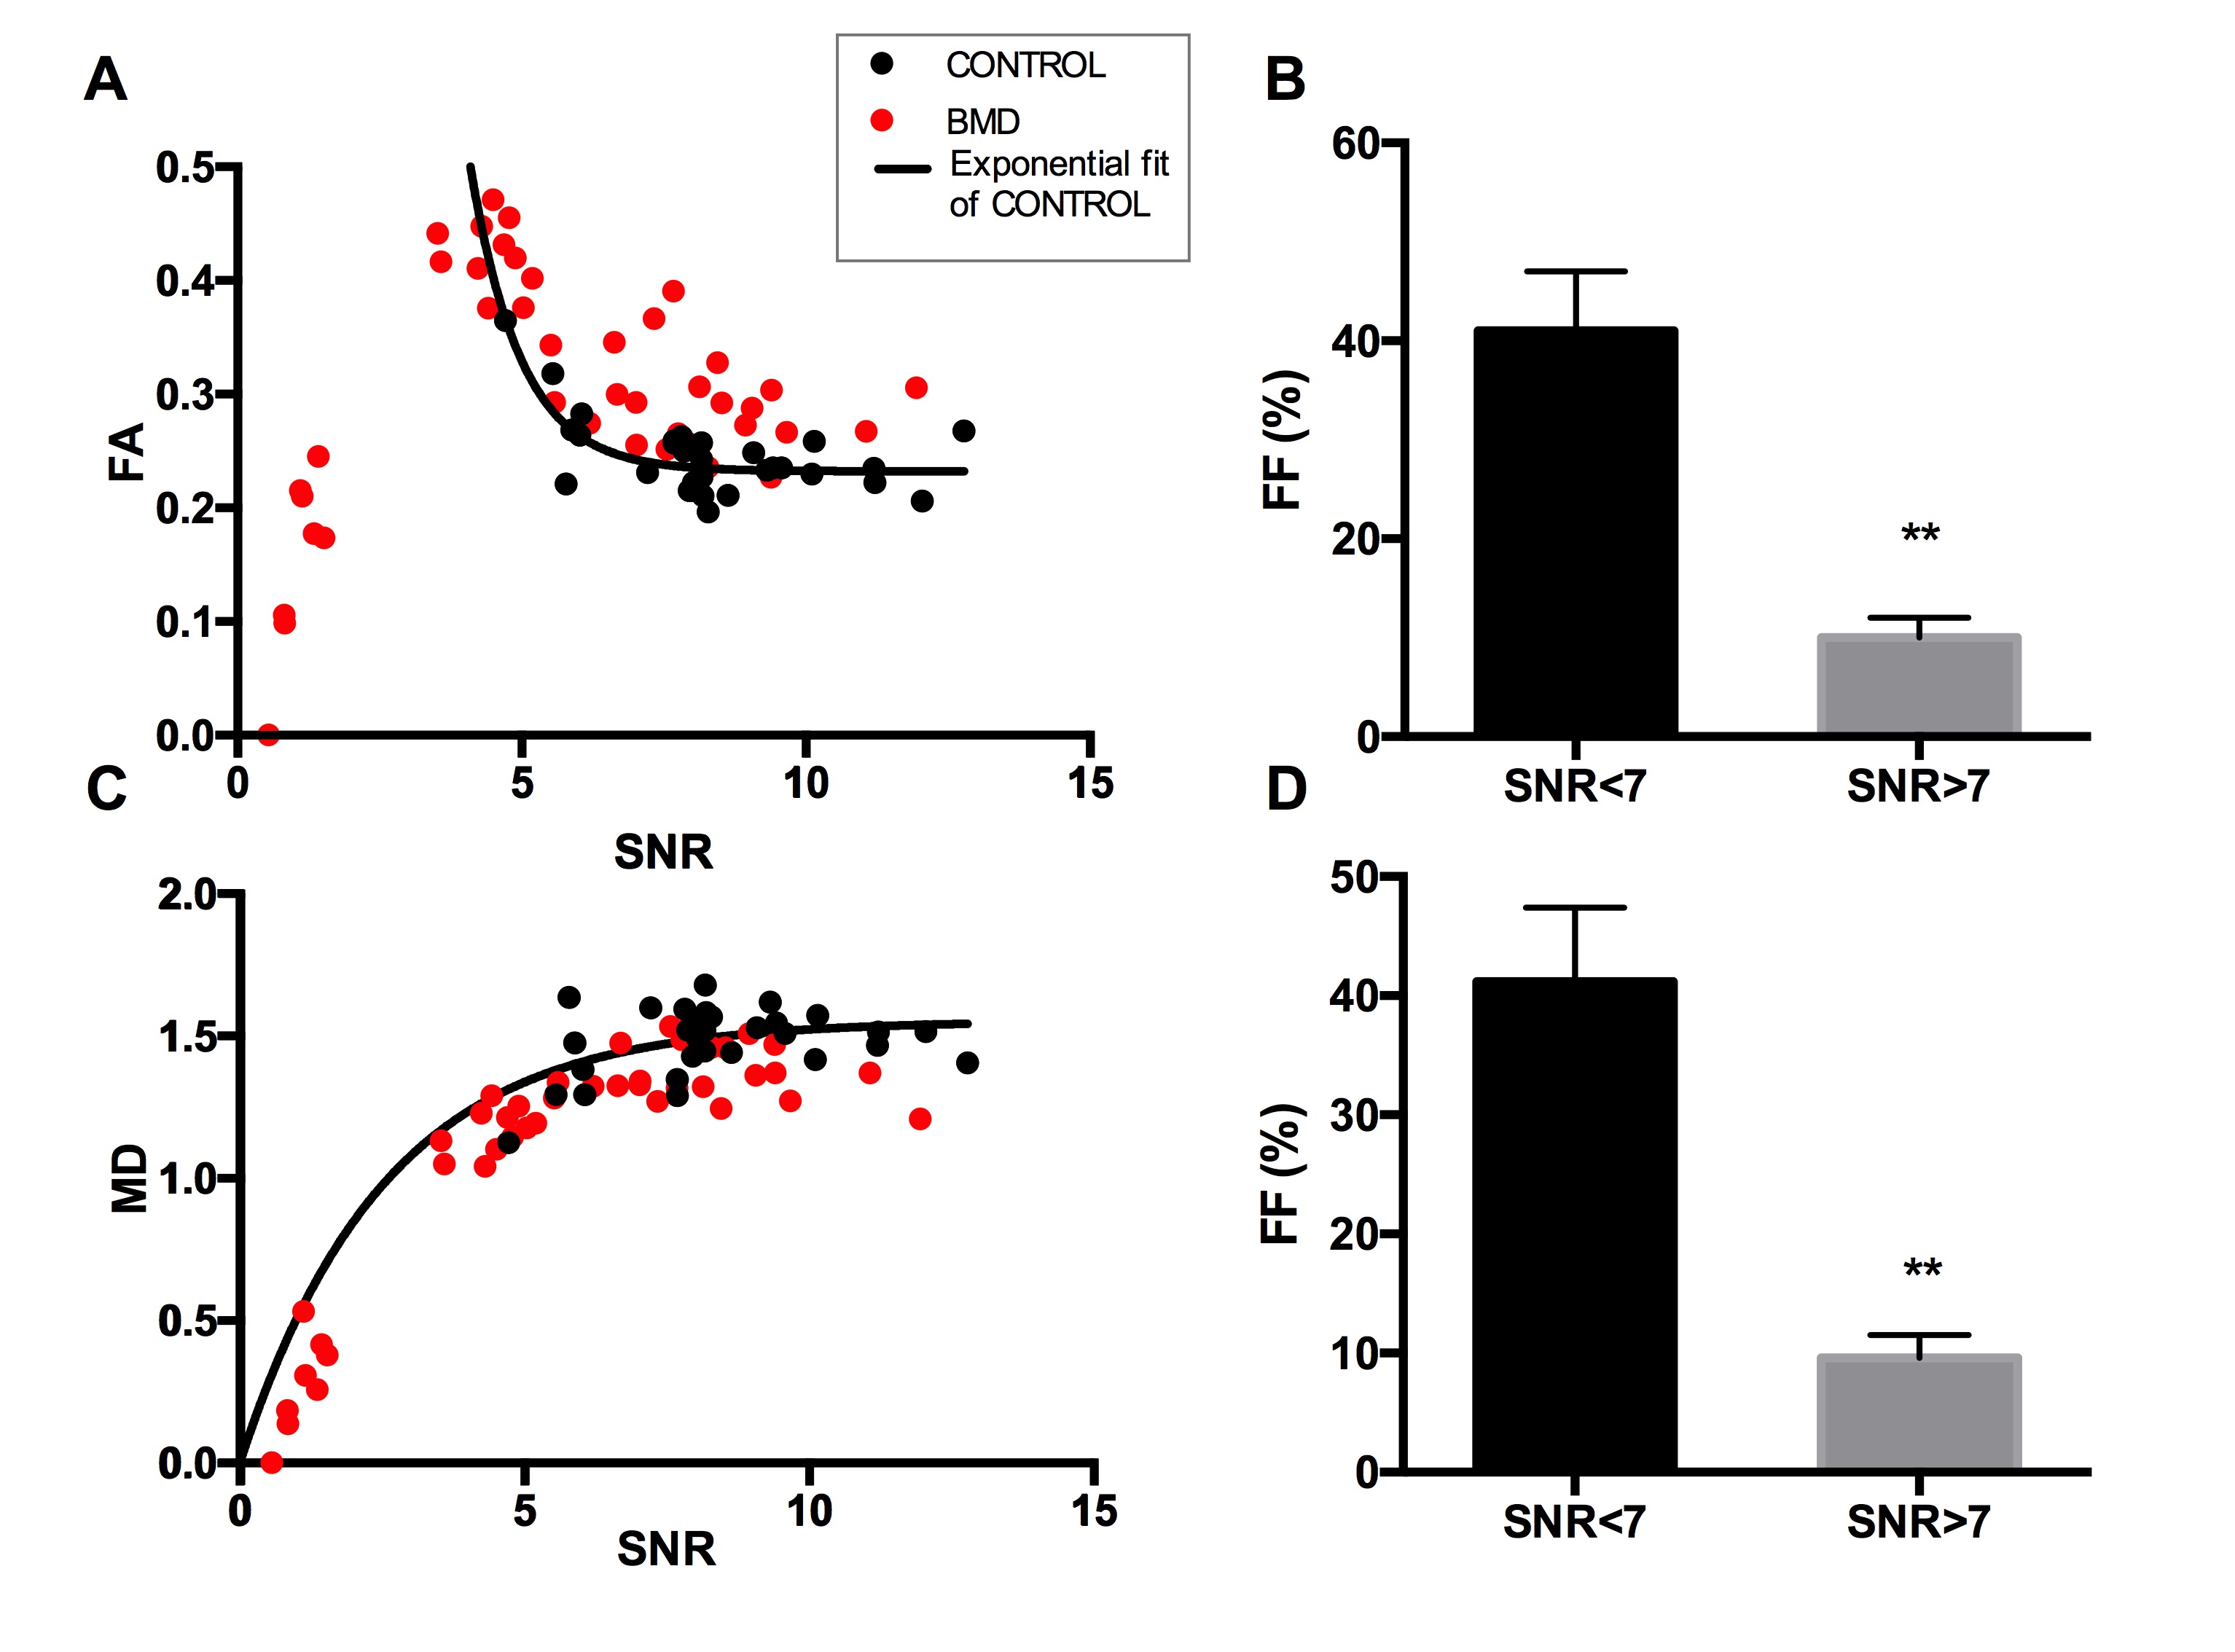
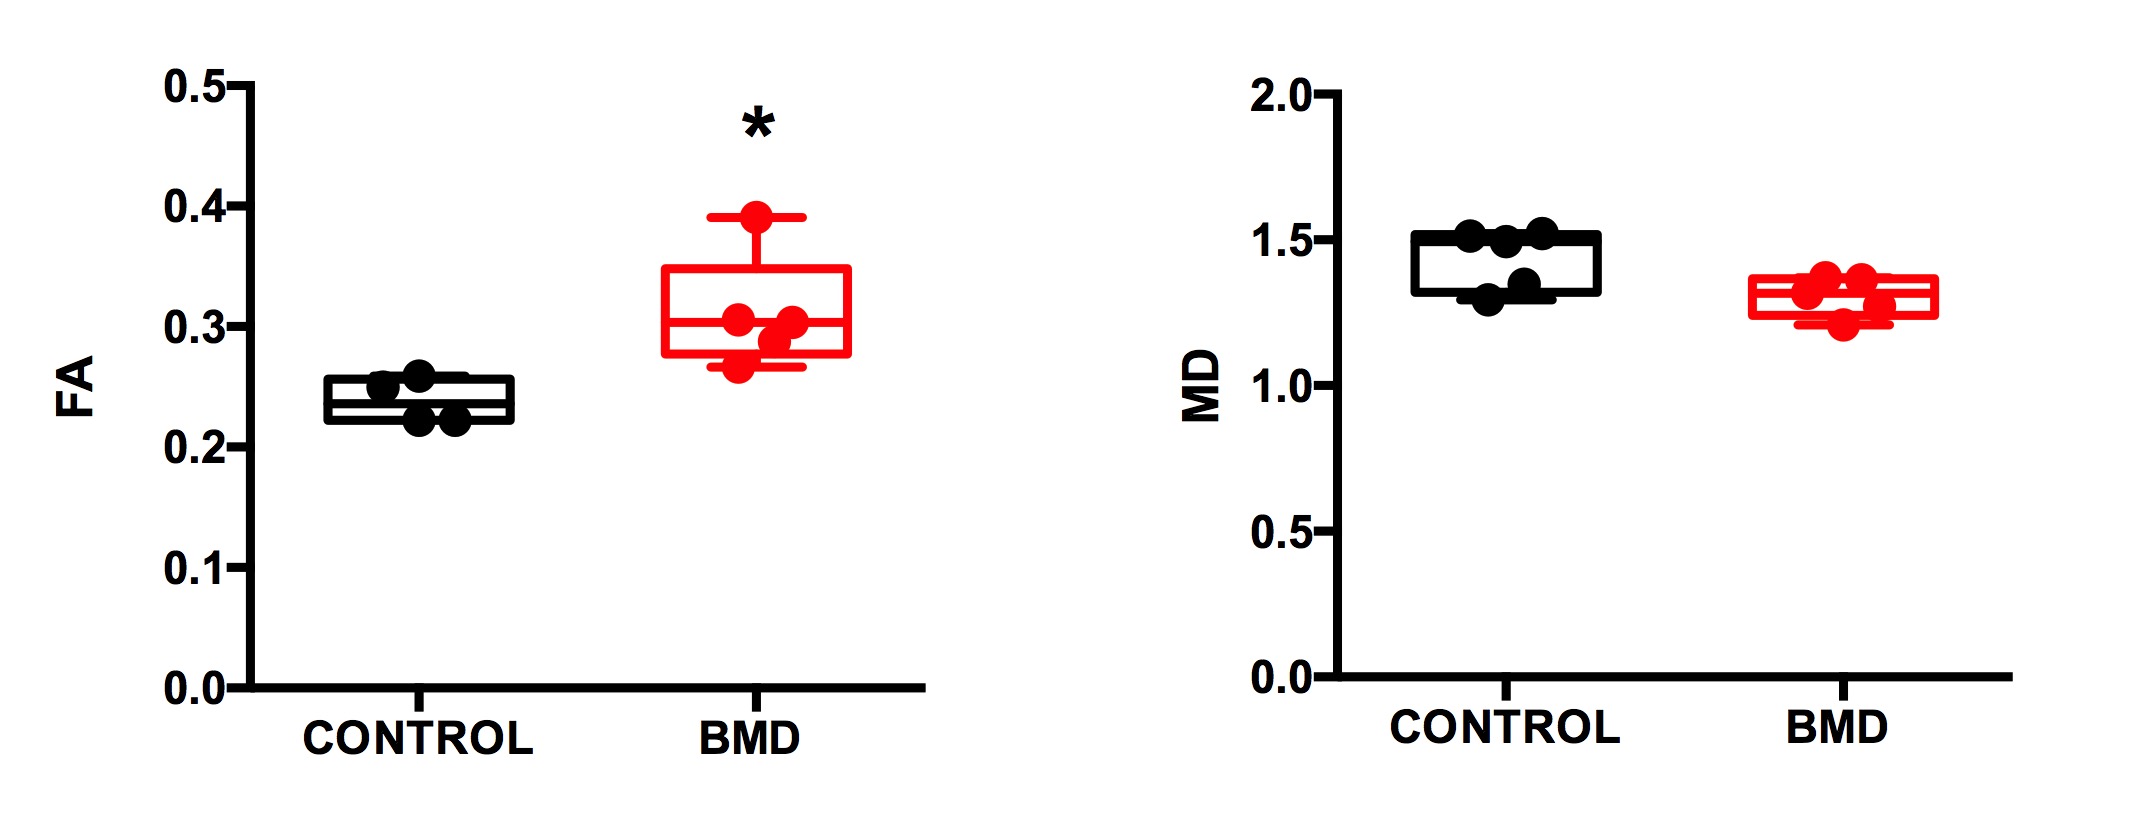
Effect of SNR on STE-DTI measurements: We evaluated the effect of SNR on the STE-DTI metrics obtained from healthy control muscles (Figure 2). As previously reported,6,7 we found that FA values were overestimated at low SNR. This relationship could be fitted to an exponential decay (Figure 2, r2=0.61). A cut-off SNR that constrained controls FA and MD results within a 5% confidence interval was determined, which resulted in including only data from ROIs with a SNR of 7 or above. Notably, the BMD data that were not fulfilling the SNR criterion for inclusion for FA and MD (50% of the ROIs) corresponded to the muscles with high fatty infiltration (Figure 2B&D). Comparison of BMD to healthy controls: We found that FA was higher in the TA of BMD patients (n=5) as compared to healthy controls (n=4) (Figure 3; p=0.016). In all other muscles, we could not reach a sample size that was sufficient for group comparison. MD values were not significantly different in BMD compared to control in any muscle but tended to be lower in SOL (p=0.057).DISCUSSION
Our results show that it is feasible to perform STE-DTI in BMD patients, and thereby to take advantage of extended mixing times for muscle cell specific applications. Although the SNR of STE-DTI is typically 50% lower than that of conventional SE-DTI, the reduced sensitivity to T2 combined with the advanced denoising technique used in this study allowed us to apply a mixing time of 100ms, which would not have been possible in a SE experiment. In addition, we found that the cutoff SNR was much lower than previously reported for SE without denoising.8,9 We were able to see an increase in FA in the TA. The origin of this increase is unknown but could be smaller fiber sizes,10 and/or development of fibrosis, although possibly in competition with increased membrane damage. Because the TA muscle is relatively spared, we anticipate that the use of mixing times of 100ms and above will allow early detection of changes in DTI metrics in other muscles, prior to fat infiltration. Our results stress the importance of high SNR for such measurements at a more advanced stage of the disease, where fat fraction is increased.Acknowledgements
This project was funded by the European Union’s Seventh Framework Programme for research, technological development and demonstration under grant agreement #602485.References
1. Oudeman, J., Nederveen, A. J., Strijkers, G. J., Maas, M., Luijten, P. R. and Froeling, M. (2016), Techniques and applications of skeletal muscle diffusion tensor imaging: A review. J. Magn. Reson. Imaging, 43: 773–788. doi:10.1002/jmri.25016
2. Karampinos DC, Banerjee S, King KF, Link TM, Majumdar S. Considerations in high resolution skeletal muscle DTI using single-shot EPI with stimulated echo preparation and SENSE. NMR in Biomed. 2012;25(5):766-778. doi:10.1002/nbm.1791.
3. Hall, M. G. and Clark, C. A. (2016), Diffusion in hierarchical systems: A simulation study in models of healthy and diseased muscle tissue. Magn. Reson. Med.. doi:10.1002/mrm.26469
4. Burakiewicz J, Hooijmans MT, Niks EH, Verschuuren JJGM, Webb AG, Kan HE. Olefinic fat suppression in skeletal muscle DTI with combined 6- and 2-point Dixon. Proc. 23rd Annu. Meet. ISMRM, Toronto, Canada. 2015:3647
5. https://sites.google.com/site/pierrickcoupe/softwares/denoising-for-medical-imaging/mri-denoising
6. S. Klein, M. Staring, K. Murphy, M.A. Viergever and J.P.W. Pluim, "elastix: a toolbox for intensity based medical image registration," IEEE Transactions on Medical Imaging, vol. 29, no. 1, pp. 196 - 205, January 2010.
7. P. A. Cook, Y. Bai, S. Nedjati-Gilani, K. K. Seunarine, M. G. Hall, G. J. Parker, D. C. Alexander, Camino: Open-Source Diffusion-MRI Reconstruction and Processing, 14th Scientific Meeting of the International Society for Magnetic Resonance in Medicine, Seattle, WA, USA, p. 2759, May 2006.
8. Hooijmans MT, Damon BM, Froeling M, et al. Evaluation of skeletal muscle DTI in patients with Duchenne Muscular Dystrophy. NMR in biomedicine. 2015;28(11):1589-1597. doi:10.1002/nbm.3427.
9. Froeling M, Nederveen AJ, Heijtel DF, Lataster A, Bos C, Nicolay K, Maas M, Drost MR, Strijkers GJ. Diffusion-tensor MRI reveals the complex muscle architecture of the human forearm. J Magn Reson Imaging. 2012;36(1):237–248.
10. Maier, F., & Bornemann, A. (n.d.). Comparison of the muscle fiber diameter and satellite cell frequency in human muscle biopsies. Muscle & Nerve., 22(5), 578-583.
Figures