4991
Noninvasive Measurement of Calf Muscle Perfusion Immediately after Plantar Flexion Exercise in Elderly Patients with Heart Failure and Preserved Ejection Fraction1Biomedical Engineering, Wake Forest University School of Medicine, Winston-Salem, NC, United States, 2Health and Exercise Science, Wake Forest University, Winston-Salem, NC, United States, 3Radiology, Brigham and Women’s Hospital and Harvard Medical School, Boston, MA, 4Department of Biomedical Engineering, Wake Forest University School of Medicine, Winston-Salem, NC, United States, 5Cardiology, Wake Forest University School of Medicine, Winston-Salem, NC, United States, 6Bioengineering, University of Alberta, Edmonton, Canada, 7College of Nursing and Health Innovation, University of Texas at Arlington, Arlington, TX
Synopsis
The pathophysiology of Heart Failure Patients with Preserved Ejection Fraction is poorly understood but there is increasing evidence that skeletal muscle blood flow and metabolism play important roles in this disease. Accurately and non-invasively measuring skeletal muscle blood flow with sufficient temporal resolution to measure skeletal muscle blood flow dynamics in individual muscles is challenging. We present a optimized version of pseudo-Continuous ASL capable of measuring blood flow map of the calf every 16 seconds. Data from two healthy adults is presented.
Introduction
Heart Failure with Preserved Ejection Fraction (HFpEF) is the most rapidly increasing form of heart failure and is associated with high morbidity and mortality rates. Severe exercise intolerance (dyspnea and fatigue with minimal exertion) is the primary symptom of HFpEF, but its pathophysiology is not well understood [1]. Recently Kitzman and Haykowsky showed that HFpEF patients have significantly reduced peak exercise oxygen consumption (peak VO2) indexed to lean muscle mass, suggesting that reduced skeletal muscle blood flow and/or impaired metabolism may play an important role in the reduced peak VO2 in HFpEF [2]. In order to determine the potential role of abnormal skeletal muscle perfusion and decreased exercise tolerance experienced by HFpEF patients, we developed a novel technique using pseudo- Continuous Arterial Spin Labeling (pCASL) to non-invasively measure calf muscle blood flow in response to plantar flexion exercise.Methods
Our study is based partly on the work of Grozinger et. al and West et. al. [3,4]. Our experiment consists of two bouts of plantar flexion exercise (right foot) in the MRI scanner in both HFpEF patients and healthy aged matched controls. In the first bout (fixed) of exercise, participants lift a 2.7kg weight 60 times per minute for 3 minutes. In the second bout (maximum) of exercise, participants lift an individually calibrated weight (2.7-7.3kg) until exhaustion. Work is quantified by measuring the height of the weight as it lifted during each repetition. Blood flow measurements are taken before exercise (baseline) and after each bout of exercise with pCASL. Background suppression and vascular crusher gradients were incorporated into the pulse sequence to improve perfusion sensitivity and reduce vascular artifacts [5,6]. Images were reconstructed offline from the raw k-space data to reduce Nyquist ghosts and eliminate quantization errors [7]. Additional details of the pCASL protocol include: 3T Siemens Skyra with 15 channel transmit/receive knee coil, TR=4s, TE=27ms, 5 slices, thickness=8mm, in-plane resolution=6x6mm, tagging duration=2s, post labeling delay=1.5s, vascular crusher gradient = 1 cm/s, background suppression tau1=134ms, tau2=1084ms, 125 volumes acquired acquired over 8 minutes and 30 seconds. Calibration data for blood flow quantification and offline reconstruction was acquired during volumes 81-96. Perfusion images are calculated as described by Grozinger et. al. [3]. The muscles were manually labeled from a high resolution T2w image. These labels were then used to measure mean muscle blood flow every 16 seconds from the muscle blood flow (MBF) images.Results
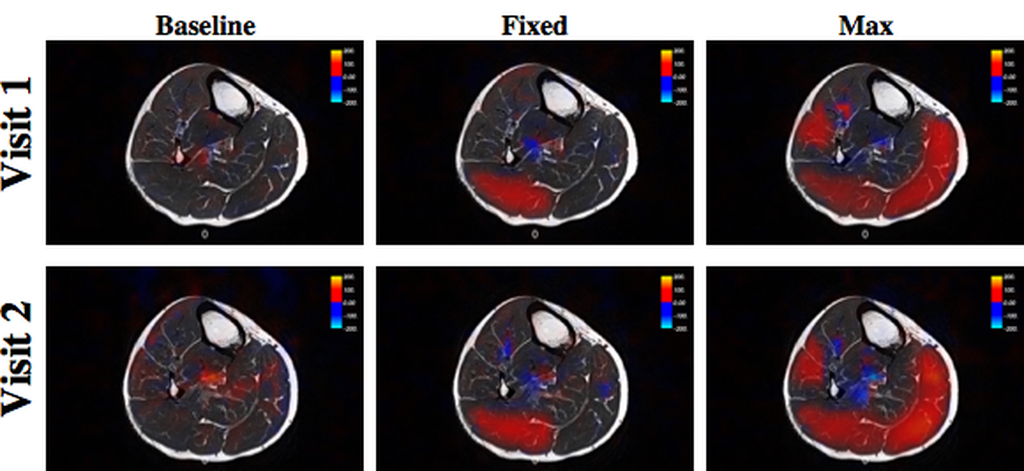
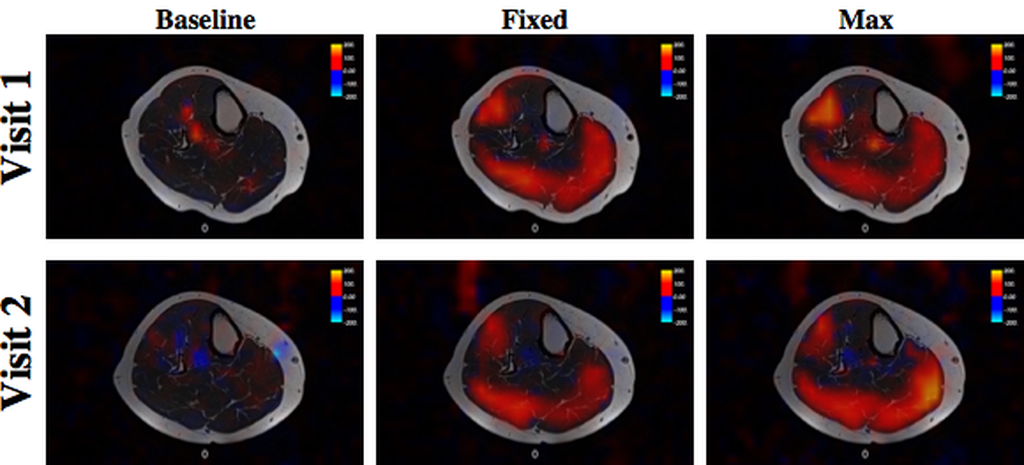
Figure 1a and 2a compare blood flow images overlaid on T2 structural images acquired from two healthy adults for baseline, fixed and maximum exercise during two separate visits at least two days apart. Blood flow images shown are composed of two control/label pairs averaged across all five slices. Fixed and maximum exercise were acquired 40 seconds after exercise to allow other data (not shown) to be acquired.
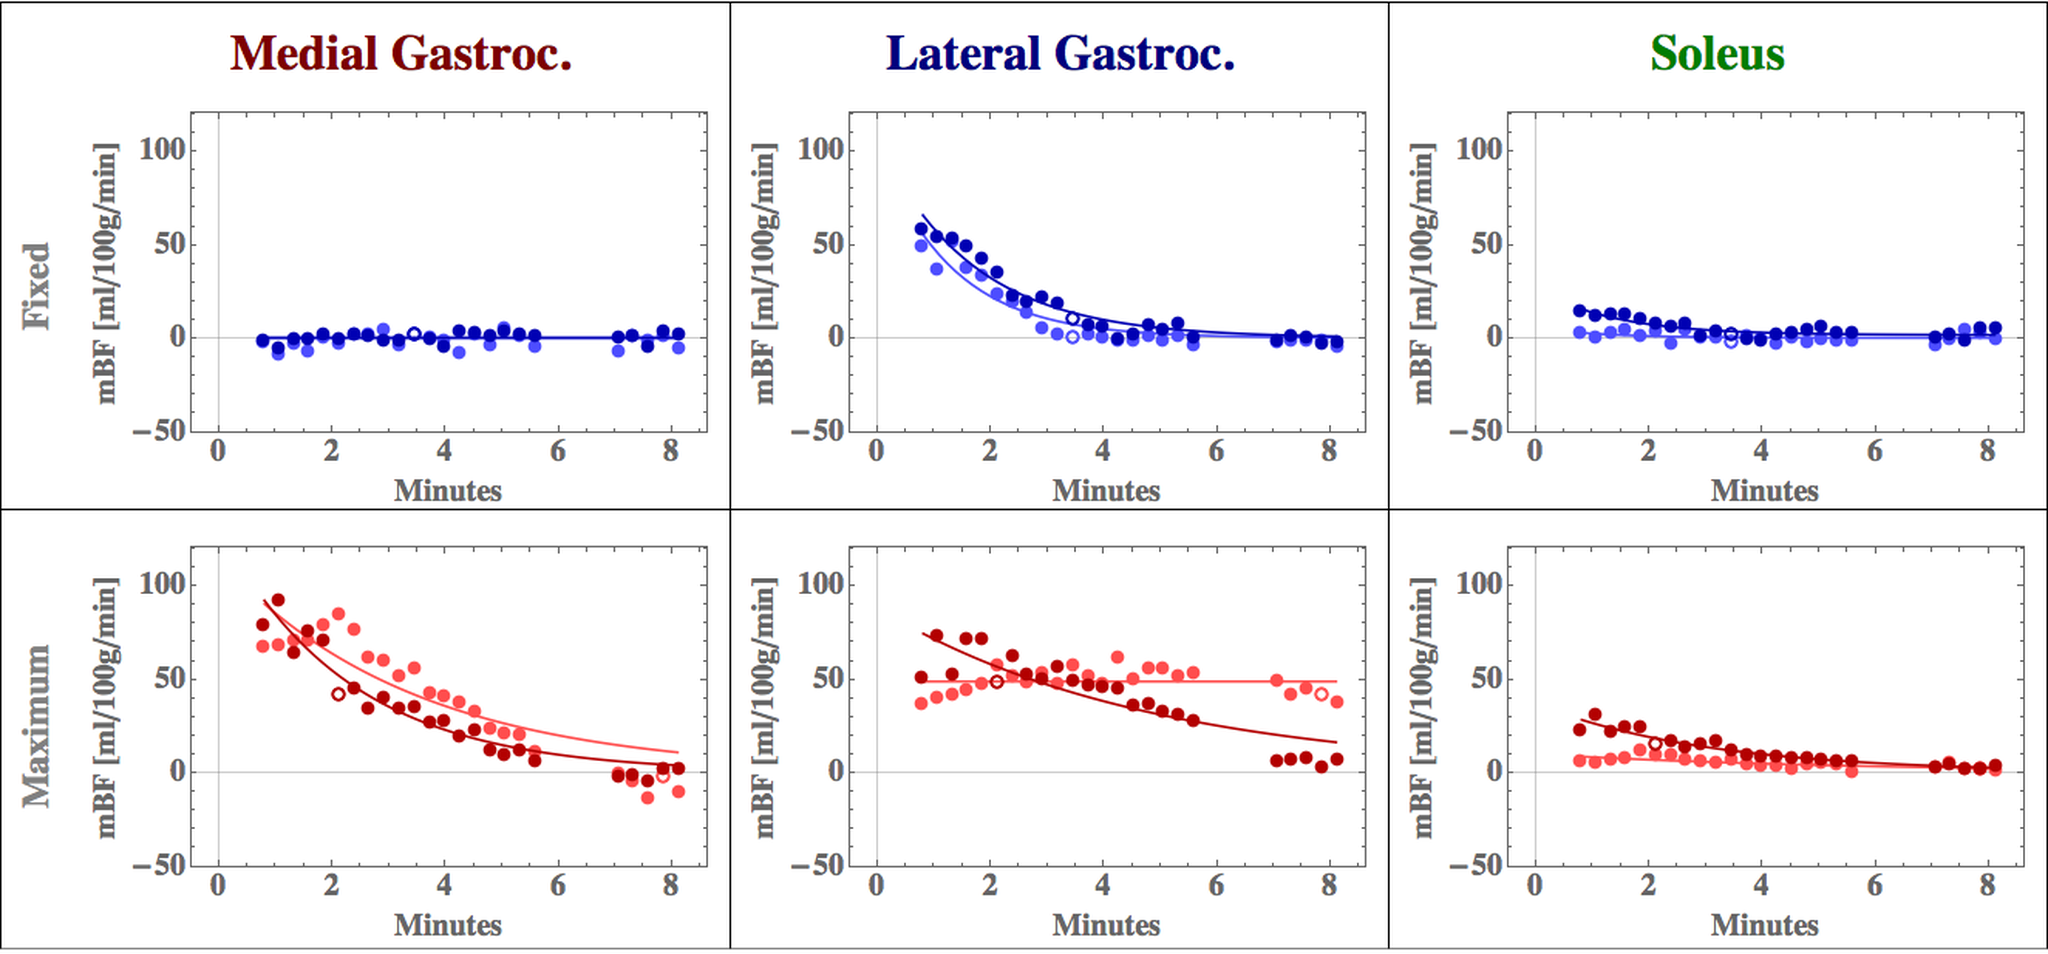
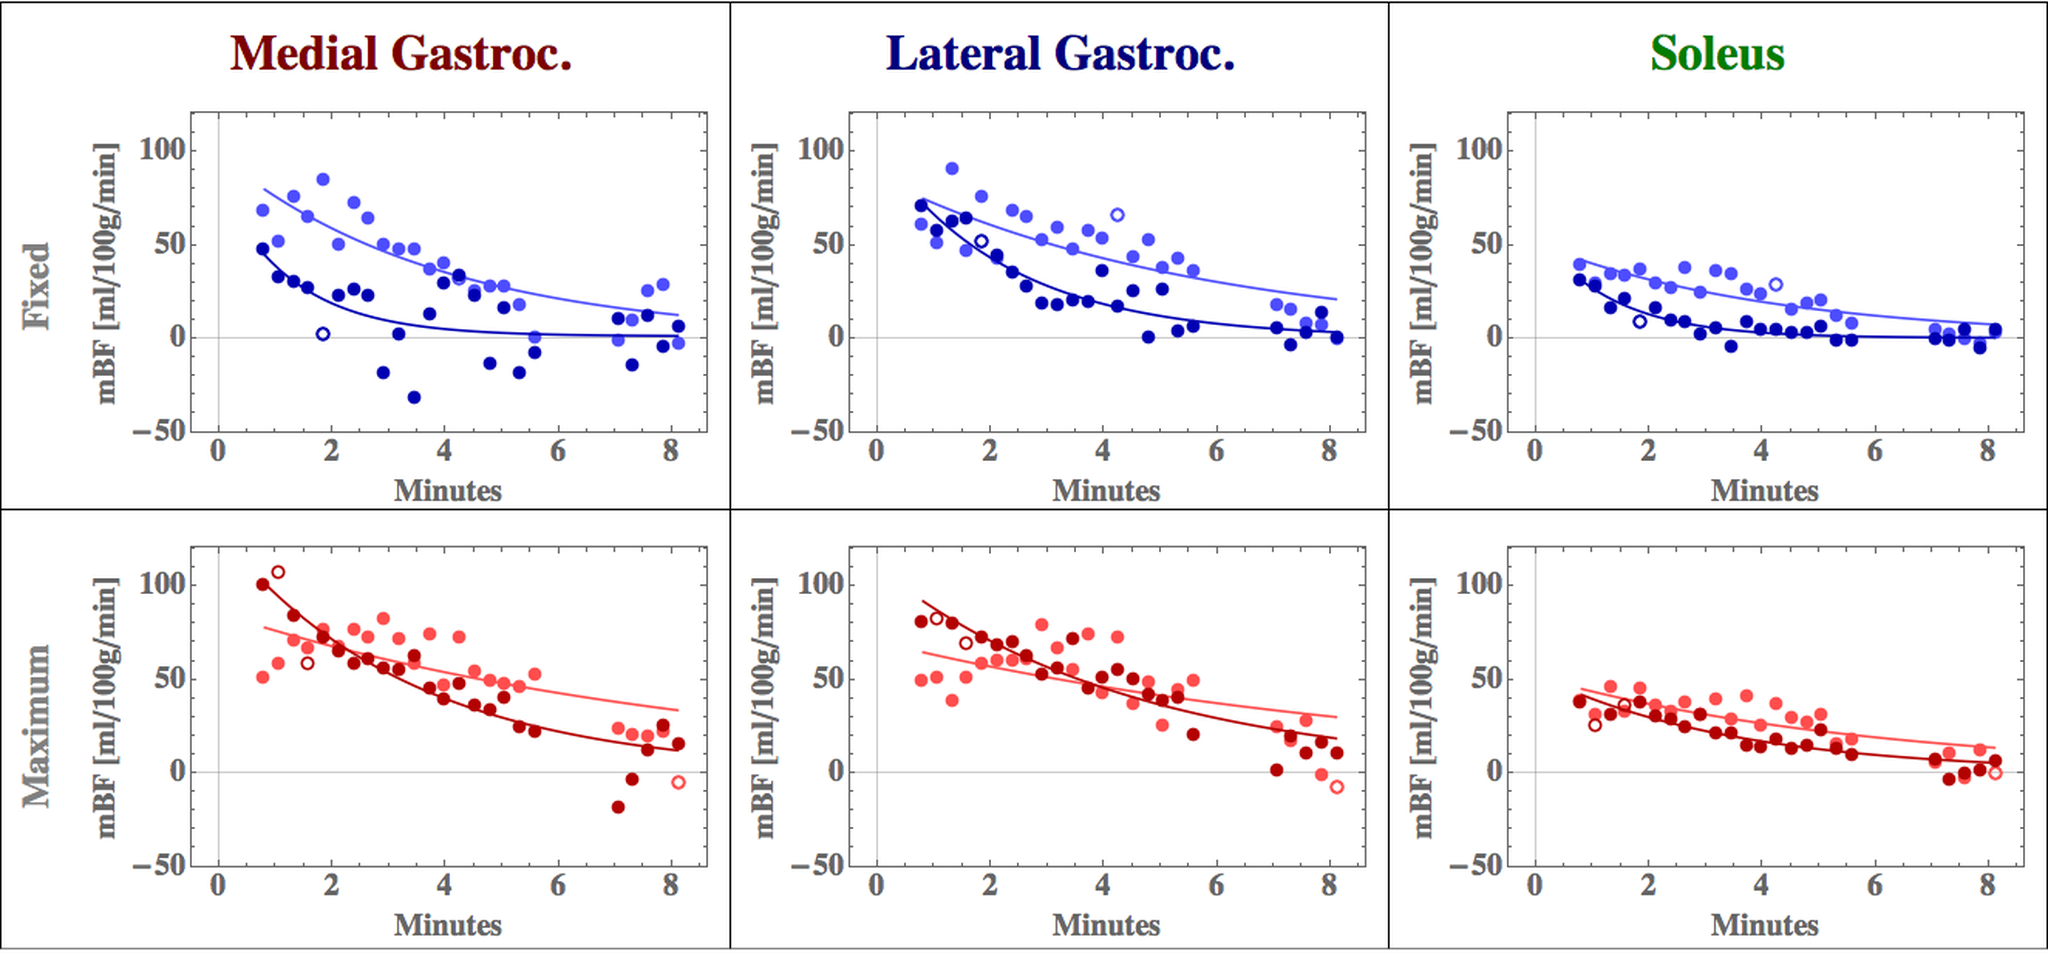
Figures 1b
and 2b are the respective individual’s MBF time course plot of the medial gastrocnemius, lateral gastrocnemius, and peroneous
muscles. A comparison of the images and MBF time course plots demonstrate that
blood flow measurements for both the fixed and maximum exercise are very similar,
suggesting the potential for good reproducibility. The improved temporal
resolution allow us to investigate blood flow recovery dynamics, which we hypothesize
will be different in HFpEF patients and healthy controls.
Discussion and Conclusion
ASL is a non-invasive
method for measuring blood flow in the calf post-exercise that has shown to be
repeatable [3]. Improvements in coil, pulse sequence, and image reconstruction
allow for better delineation of which muscles are active and allow detailed
observation of recovery dynamics. After
formally examining reproducibility in a larger group of subjects, we will
compare calf muscle perfusion before and immediately after exercise in elderly HFpEF
patients compared to age-matched healthy controls and its relationship to their
severely reduced exercise intolerance.
This work has the potential to determine a key mechanism of the severe
exercise intolerance experience by the large and growing population of elderly
HFpEF patients.Acknowledgements
Research support was provided by The Wake Forest University Claude D. Pepper Older Americans Independence Center (P30-AG21332). The authors would like Dr. Youngkyoo Jung for providing his neuroimaging pCASL sequence, which was modified for measuring skeletal muscle perfusion in this study.References
1. Haykowsky, M.J. and D.W. Kitzman, Exercise physiology in heart failure and preserved ejection fraction. Heart Fail Clin, 2014. 10(3): p. 445-52.
2. Haykowsky, M.J., et al., Impaired aerobic capacity and physical functional performance in older heart failure patients with preserved ejection fraction: role of lean body mass. J Gerontol A Biol Sci Med Sci, 2013. 68(8): p. 968-75.
3. Grozinger, G., et al., Perfusion measurements of the calf in patients with peripheral arterial occlusive disease before and after percutaneous transluminal angioplasty using Mr arterial spin labeling. J Magn Reson Imaging, 2013.
4. West, A.M., et al., Percutaneous intervention in peripheral artery disease improves calf muscle phosphocreatine recovery kinetics: a pilot study. Vasc Med, 2012. 17(1): p. 3-9.
5. Ye FQ, Frank JA, Weinberger DR, McLaughlin AC. Noise reduction in 3D perfusion imaging by attenuating the static signal in arterial spin tagging (ASSIST). Magn Reson Med. 2000;44(1):92-100. PubMed PMID: 10893526.
6. Schepers J, Van Osch MJ, Nicolay K. Effect of vascular crushing on FAIR perfusion kinetics, using a BIR-4 pulse in a magnetization prepared FLASH sequence. Magn Reson Med. 2003;50(3):608-13. doi: 10.1002/mrm.10571. PubMed PMID: 12939769.
7. Hoge WS, Tan H, Kraft RA. Robust EPI Nyquist ghost elimination via spatial and temporal encoding. Magn Reson Med. 2010;64(6):1781-91. doi: 10.1002/mrm.22564. PubMed PMID: 20665898; PMCID: PMC3038256.
Figures