4990
A quantitative relationship between R2* and deoxyhemoglobin levels in calf muscle1Department of Electrical and Computer Engineering, University of Utah, Salt Lake City, UT, United States, 2Department of Internal Medicine, University of Utah School of Medicine, Salt Lake City, UT, United States, 3Department of Exercise and Sports Science, University of Utah, UT, United States, 4Department of Radiology and Imaging Sciences, University of Utah, Salt Lake City, UT, United States
Synopsis
This study examined the relationship between R2* measurements from BOLD MRI and deoxyhemoglobin (HHb) measurements from near-infrared spectroscopy (NIRS) in calf muscle of subjects with varying degrees of peripheral artery disease (PAD). Following plantar-flexion exercise, the time required for R2* and HHb to recover to resting-state values was recorded. Linear regression was used to relate recovery time between R2* and HHb. This quantitative relationship enables estimation of HHb from MRI-measured R2*, which can help to improve the assessment of PAD since MRI can easily be performed for muscle tissue that is too deep for NIRS evaluation.
Purpose
The assessment of
calf-muscle oxygenation is important for the diagnosis and evaluation of
peripheral artery disease (PAD). Conventionally, such assessment is achieved
using near-infrared spectroscopy (NIRS), which can measure deoxyhemoglobin
(HHb) levels in tissue. A more recently developed technique for assessing
tissue oxygenation is called blood oxygen level dependent (BOLD) MRI, which
measures transverse relaxation rate (R2*). High R2* values
correspond to low tissue oxygenation levels and vice versa. While NIRS can only
measure HHb in superficial muscles like the gastrocnemius, BOLD MRI can measure
R2* from any tissue within the acquired field of view. In this
study, we used NIRS and BOLD MRI to extract both HHb and R2* from
the gastrocnemius of subjects with varying levels of PAD in order to find a
quantitative relationship between these two metrics of tissue oxygenation. Such
a relationship will enable the estimation of HHb from deep muscle tissue that
is unreachable with NIRS, but can easily be imaged with BOLD MRI.Methods
One healthy subject (age: 50 years) and three PAD patients (age: 62.6±6.4 years, ABI: 0.67±0.15) were included in this IRB-approved protocol. Each subject underwent two 3-minute plantar-flexion exercise sessions wherein the subject repeatedly pushed a pedal weighted by 4lbs of resistance. One session was immediately followed by 5-minutes of NIRS measurement of the medial gastrocnemius while the other was immediately followed by 5-minutes of BOLD MRI.
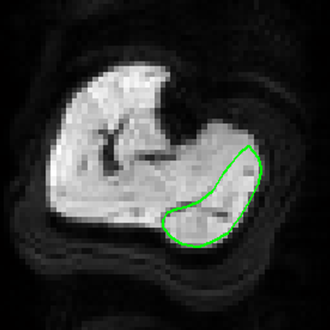
BOLD imaging was performed on a 3T MRI scanner (TimTrio, Siemens). For the 5 minutes following plantar flexion, double-echo EPI BOLD images1 were repeatedly acquired from an axial slice through the calf (Figure 1): TE 23, 58ms, FOV 160×160mm, matrix 64×64, slice thickness 10mm. Over the 5 minute imaging period, 38 double-echo acquisitions were obtained.
Post-processing of all data was performed using custom scripts written in MATLAB. For each double-echo BOLD acquisition, R2* maps were generated by fitting the signal-intensity versus TE curves from each pixel to an exponential decay function. A region of interest (ROI) was then manually defined over the medial gastrocnemius (Figure 1) and applied to each R2* map. The mean R2* within this ROI was computed for each map, resulting in an R2* versus time curve for the medial gastrocnemius. An HHb versus time curve for the medial gastrocnemius was automatically generated from the NIRS measurement data by the NIRS device.
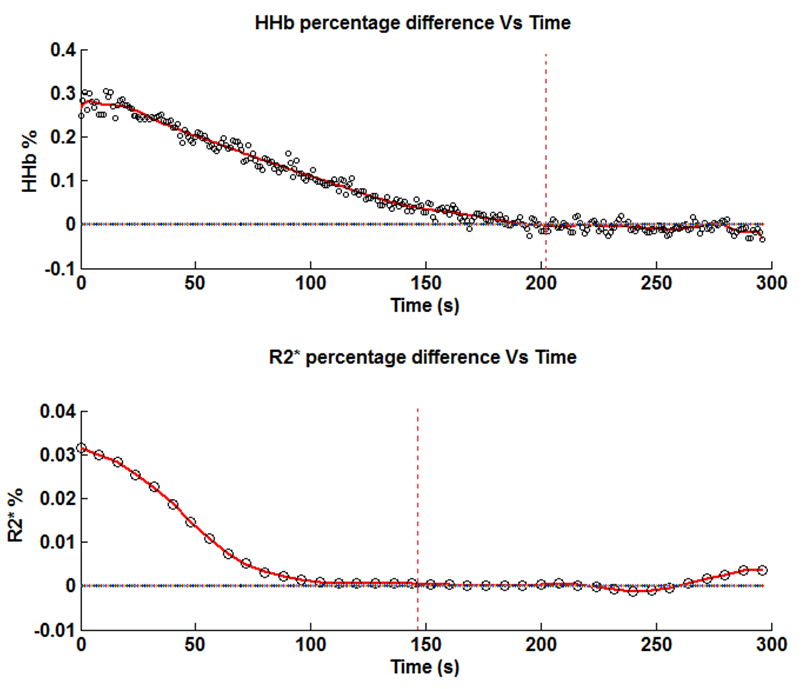
For both the R2* versus time curve from BOLD MRI and the HHb versus time curve from NIRS, we identified the time at which the curve returned to its baseline (resting-state) value. This baseline value was defined as the average HHb or R2* value from the last 60 seconds of the 5-minute measurement period (Figure 2). We refer to this time-to-baseline as the “recovery time”. Recovery time was then compared between R2* and HHb for each patient. Finally, linear regression was used to relate R2* recovery time to HHb recovery time for our subject group.
Results
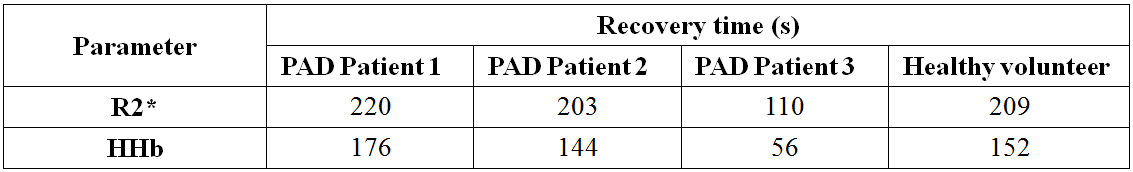
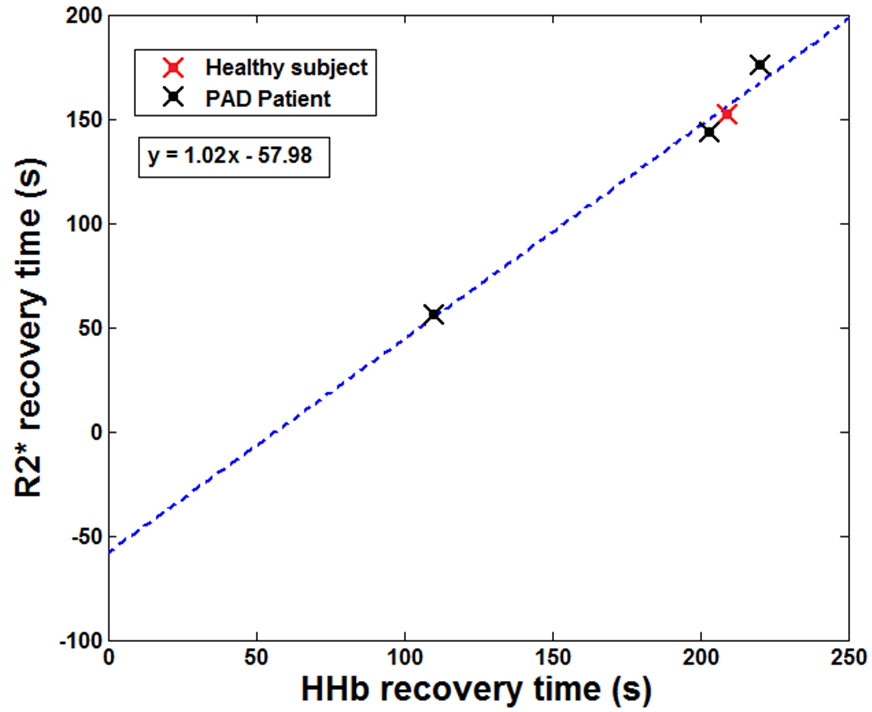
The HHb and R2* recovery times for our subjects are listed in Table 1. The linear regression equation relating these two parameters is: $$$t_{r}^{R_{2}^{*}} = 1.02 \cdot t_{r}^{HHb} - 57.98$$$, where $$$t_{r}^{R_{2}^{*}}$$$ is the recovery time for R2* and $$$t_{r}^{HHb}$$$ is the recovery time for HHb. This relationship is plotted in Figure 3.Discussion
In this study, we determined a linear relationship between post-exercise recovery times of R2* and HHb in calf muscle. With this relationship, we can estimate muscle HHb from R2* measurements obtained using BOLD MRI. This is a valuable approach because it allows us to estimate tissue oxygenation from muscles that are too deep for NIRS evaluation, thereby helping to improve the diagnosis and assessment of PAD.Acknowledgements
References
1. Mendes, JK et al. Simultaneous measurement of perfusion and BOLD changes in calf muscle during exercise. Proc. Intl. Soc. Magn. Reson. Med. 21 (2013).
Figures