4987
Measuring T1 and T2 of the small bowel wall at 3T1Sir Peter Mansfield Imaging Centre, School of Physics and Astronomy, University of Nottingham, Nottingham, United Kingdom, 2Nottingham Digestive Diseases Centre, School of Medicine, University of Nottingham, Nottingham, United Kingdom, 3NIHR Biomedical Research Unit in Gastrointestinal and Liver Diseases, Nottingham University Hospital, Nottingham, United Kingdom
Synopsis
Available techniques to measure in-vivo bowel permeability are inadequate for stratifying patients to identify those at risk of complications from increased bowel permeability. T1 and T2 measurements could potentially be indicators of changes in bowel wall structure and thus permeability. We have measured the T1 and T2 of the bowel wall to be 1.68±0.57 s and 0.08 ±0.02 s respectively. We found significant variations between and within subjects. However it is currently unknown whether some of these variations are real and some due to errors in the measurement process.
Introduction
Increased small bowel permeability and subsequent bacterial translocation is thought to herald an important transition point associated with adverse outcomes in the progression of several diseases (eg Crohn’s) [1]. Available techniques to measure in-vivo bowel permeability [2,3] are inadequate for stratifying patients to identify those at risk of complications from increased bowel permeability. This is required to target interventions and assess the efficacy of therapeutic interventions to optimize the risk: benefit ratio of treatments. T1 and T2 measurements could potentially be indicators of changes in bowel wall structure and thus permeability. Aim: to develop a protocol for measuring T1 and T2 of the bowel wall in healthy participants as a potential indicator of bowel wall permeability.Methods
All participants were scanned on a Phillips 3T Achieva (Best, the Netherlands). N=7 healthy participants were given 1L of oral bowel preparation, consisting of 2.5% mannitol and 0.2% locust bean gum. To reduce the motion of the small bowel, 20mg of Buscopan® was administered intravenously approximately two minutes before the T1 and T2 scans respectively with a minimum wait time of 8 minutes between doses. A single slice T1 recovery curve was acquired using a T1 weighted inversion recovery- spoiled TFE sequence with inversion delay times of 500, 800, 1200, 1800, 2500 and 4000ms. A TE/TR of 2.3/10ms was used. T1 images were acquired at 1.5mm x 1.8mm x 5mm voxel size with an in plane reconstruction of 0.9mmx0.98mm. For the T2 recovery a single slice spin echo prepared bTFE scan was acquired at echo times of 20,50,80,120,180,300ms[4]. A TE/TR of 1.68/3.4ms was used for the bTFE readout. The images were acquired at 1.3mm x 1.5mm voxel size with half Fourier acquisition and in plane reconstruction of 1mm x 1mm. All slices were positioned in the coronal plane where the terminal ilium enters the cecum, to ensure consistency in image locations. T1 and T2 were measured in three separate lines of interest drawn along the bowel wall at each TI/TE sample point. The location of each line of interest was adjusted for each TI to account for motion. Motion was generally foot/head in plane (due to breath holds). Each region of interest comprised of approximately 15 voxels. The data were fitted to S=So(1-Aexp-TI/T1) for T1 and a function taking account of the bTFE readout for T2. In the case of two T2 measurements we were unable to draw three regions of interest due to poor definition of the bowel wall.Results
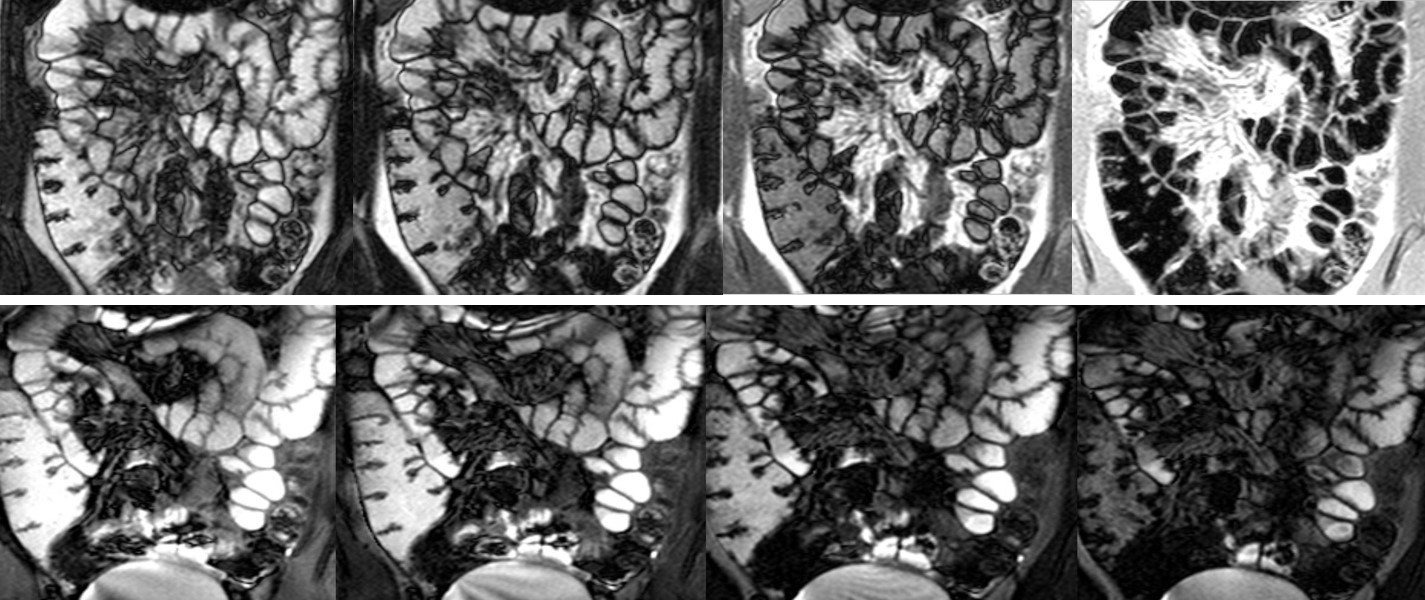
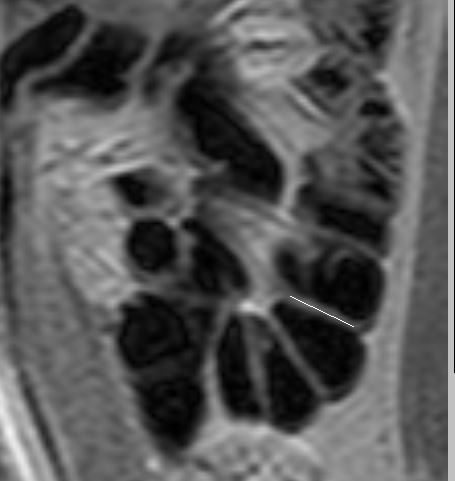
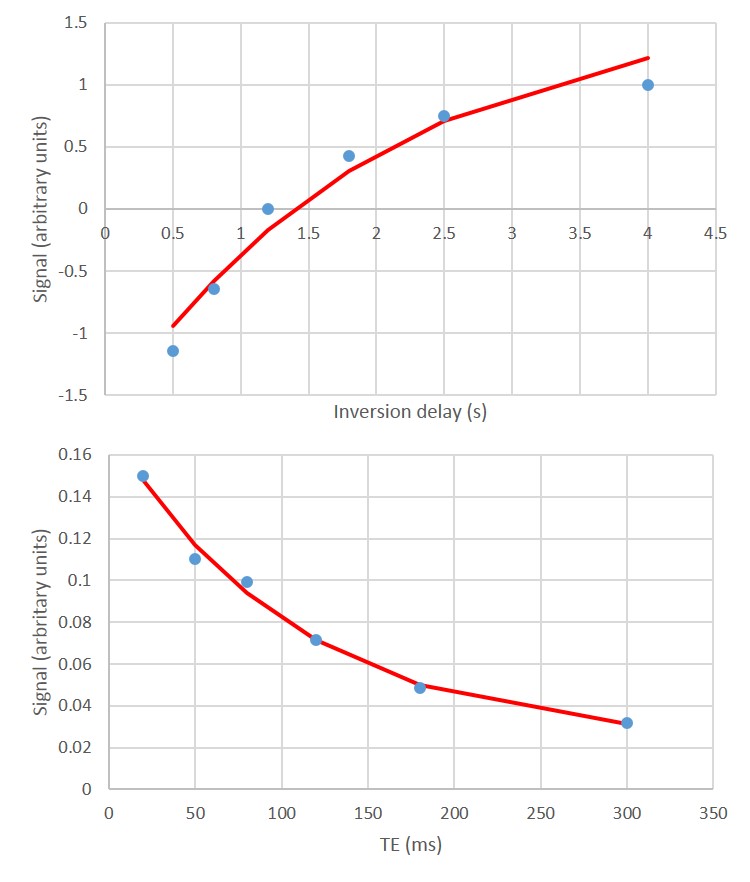
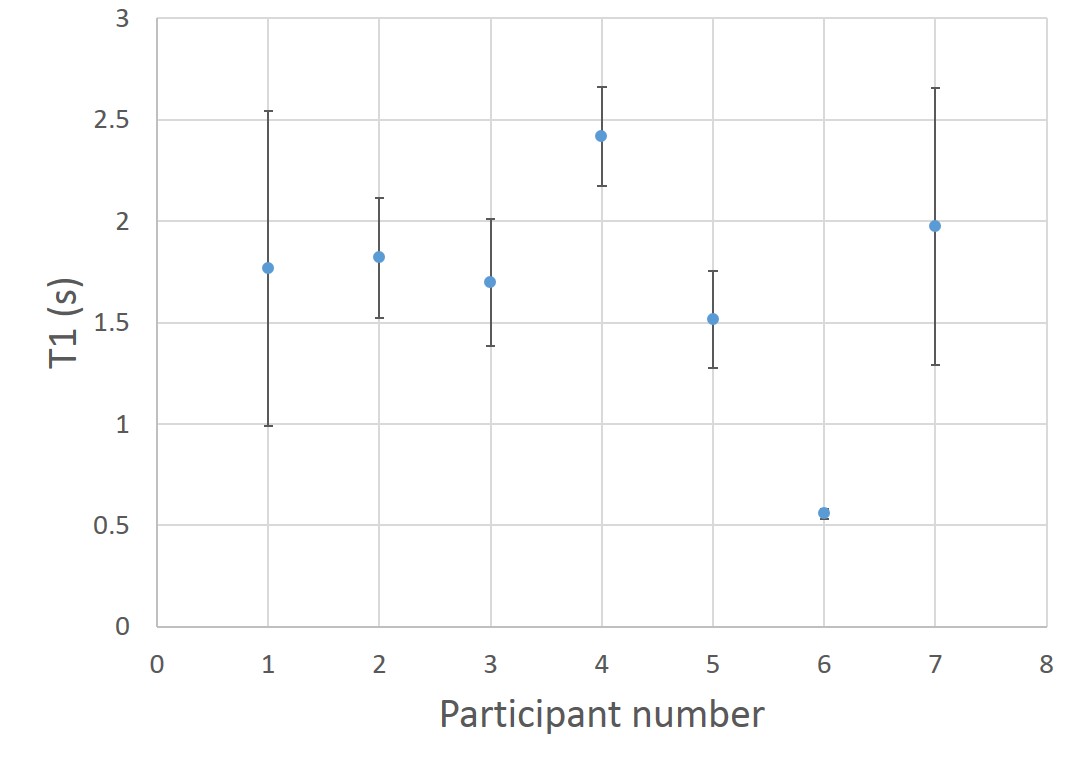
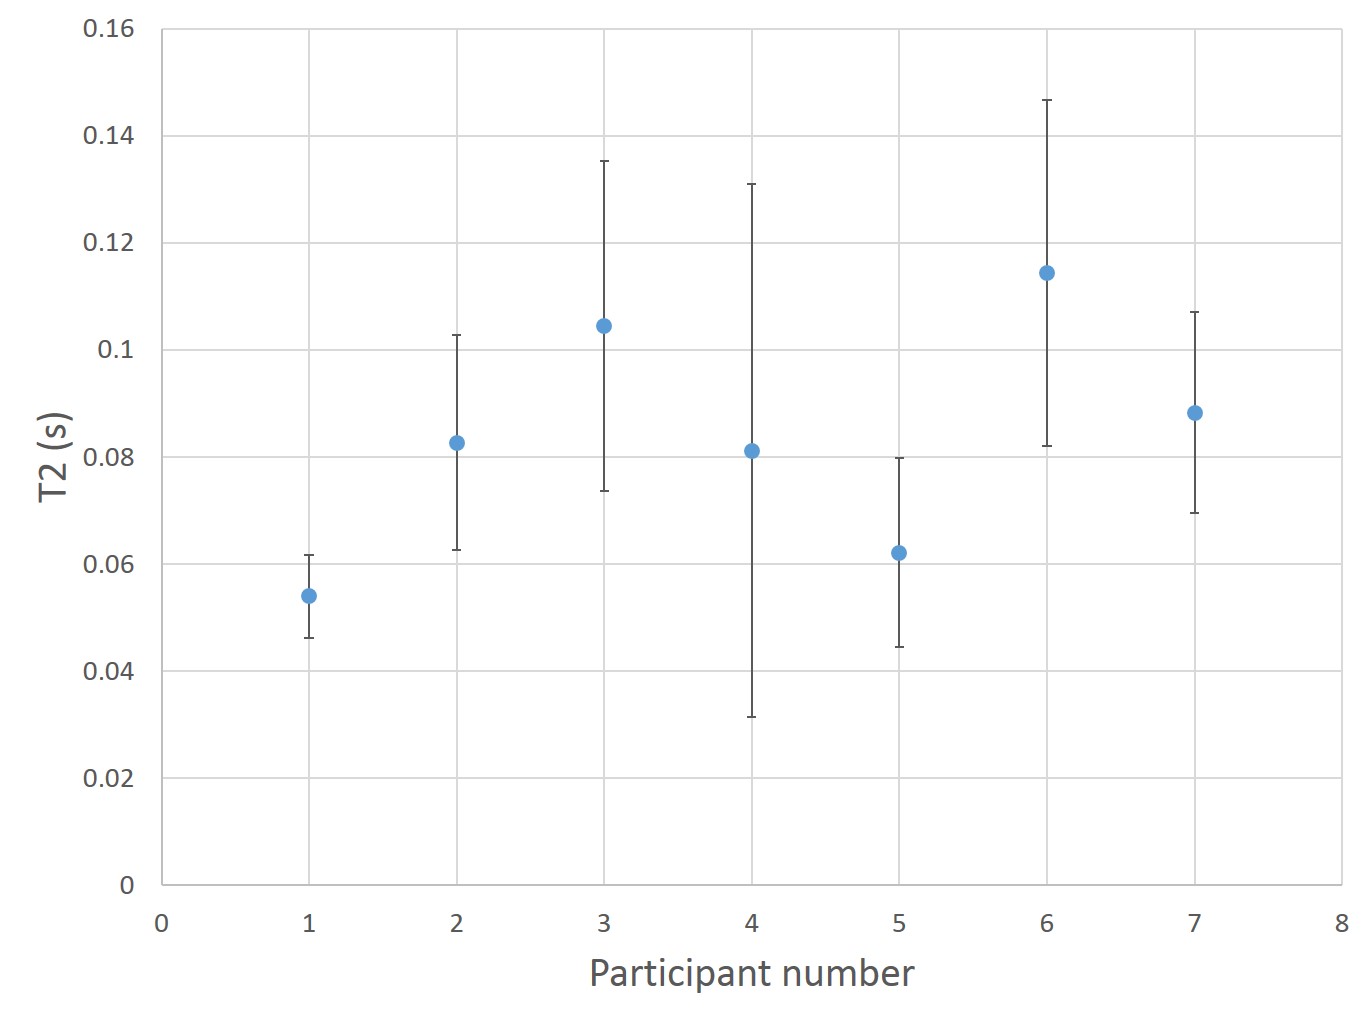
Figure 1 shows example images of a T1 recovery and T2 decay in the abdomen. Figure 2 shows an example of an ROI drawn on a T1 weighted image along the bowel wall. Figure 3 shows the T1 recovery curve with an inversion recovery fit and a T2 decay from an ROI in the bowel wall. Figure 4 summarises the T1 measurements and the standard deviation of the measurement across the three ROIs. Figure 5 shows the same results for T2. The average values for T1 and T2 along the bowel wall were 1.68±0.57s and 0.08±0.02s respectively.Discussion
Whilst both the T1 and T2 fits had a high R2, the T1 and T2 measurements showed a large variation across the three regions of interest. Figure 3 suggests that the system may not demonstrate monoexponential recovery. This is probably due to partial volume effects so future work will fit to different tissue compartments which will eliminate partial volume effects. As this is the first study measuring the T2 and T1 of the bowel wall the echo times and inversion times for the T2 and T1 measurements may not be optimal. This is the first study measuring the T1 and T2 of the bowel wall at 3T so despite the scatter, the results will enable optimization of the echo times and inversion times to be used for future measurements. The major limitation of the study was the low number of regions of interest that were able to be drawn. A posterior slice had been chosen to minimize motion artefacts but these results suggest a more anterior slice can be used which will allow a larger volume of bowel to be interrogated, and hence the values of T1 and T2 and the variability in these parameters to be better defined.Conclusion
We have measured the T1 and T2 of the bowel wall to be 1.68±0.57s and 0.08 ±0.02s respectively. We found significant variations between and within subjects. However it is currently unknown whether some of these variations are real and some due to errors in the measurement process.Acknowledgements
We would like to acknowledge the Medical Research Council for funding this work.References
1. Wiest, R., M. Lawson, and M. Geuking, Pathological bacterial translocation in liver cirrhosis. J Hepatol, 2014. 60(1): p. 197-209.
2. Camilleri, M., et al., Intestinal barrier function in health and gastrointestinal disease. Neurogastroenterol Motil, 2012. 24(6): p. 503-12.
3. Dunlop, S.P., et al., Abnormal intestinal permeability in subgroups of diarrhea-predominant irritable bowel syndromes. Am J Gastroenterol, 2006. 101(6): p. 1288-94.
4. Hoad, C.L., E.F. Cox, and P.A. Gowland, Quantification of T2 in the abdomen at 3.0 T using a T2-prepared balanced turbo field echo sequence. Magnetic Resonance in Medicine, 2010. 63(2): p. 356-364.
Figures