4984
Optimized ROI size on ADC measurements of normal pancreas, pancreatic cancer and mass-forming chronic pancreatitis1Radiology, Changhai Hospital of Shanghai, Shanghai, People's Republic of China, 2School of Pharmacy, Second Military Medical University, Shanghai, People's Republic of China, 3MR Research China, GE Healthcare, Shanghai, People's Republic of China
Synopsis
The effect of ROI size on ADC measurements in normal pancreatic tissue or pancreatic lesions have rarely been studied. This study investigated the influences of ROI size in ADC measurements for the differentiation between normal pancreas (NP), mass-forming chronic pancreatitis (MFCP) and pancreatic ductal adenocarcinoma (PDAC).
Purpose
DWI with the quantitative measurement of ADC values provides an additional promising dimension relative to conventional anatomical MRI for the detection and characterization of pancreatic diseases1. However, the use of ADC to differentiate mass-forming chronic pancreatitis (MFCP) from pancreatic ductal adenocarcinoma (PDAC) may still be challenging, possibly due to the variable proportions of fibrosis and inflammation in MFCP, fibrosis and cell density in tumors, and literature data are inhomogeneous and controversial 2-6. In terms of the measurement, this could be caused by the large variation in the region of interest (ROI) sizes in these studies (ranging from 19 to 879 mm2). The effect of ROI size on ADC measurements in normal pancreatic tissue or pancreatic lesions have rarely been studied. Thus, the aim of this study was to investigate the influences of ROI size in ADC measurements for the differentiation between normal pancreas (NP), PDAC and MFCP.
Methods
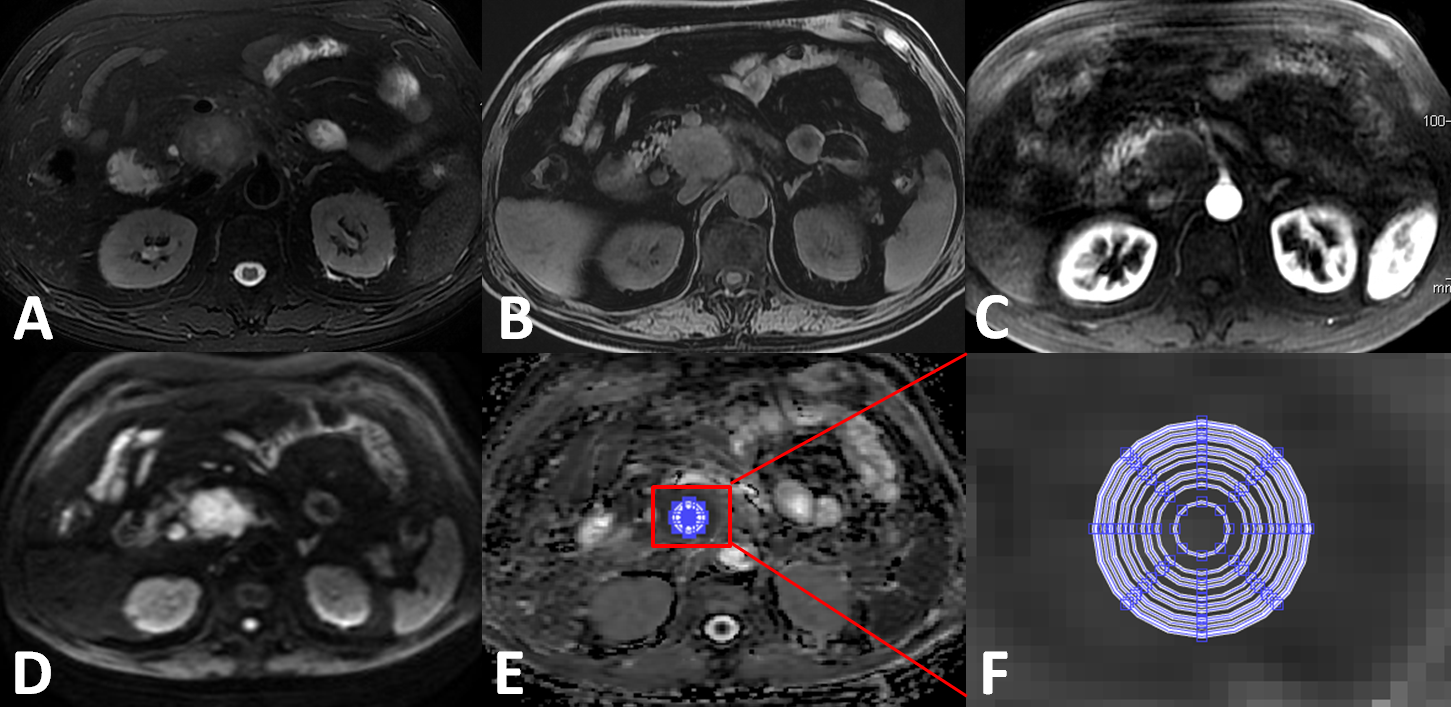
Sixty-four patients with pathology-proven PDAC, seven patients with pathology-proven MFCP, and eighteen healthy volunteers were included. ADC maps were derived from the DWI images using mono-exponential model (ADC=[ln(SIb0/SIb600)]/600), and were reconstructed automatically with 380×380 mm2 FOV and 256×256 matrix, respectively.. A homemade software was used to measure the mean ADC values of 12 concentric round ROIs (areas: 15, 46, 55, 82, 99, 121, 134, 152, 161, 189, 214, 223, and 245 mm2) for the mass of lesions and the NP tissue (Figure 1). As a reference, a phantom was also used to measure the ADC values of water.
Results
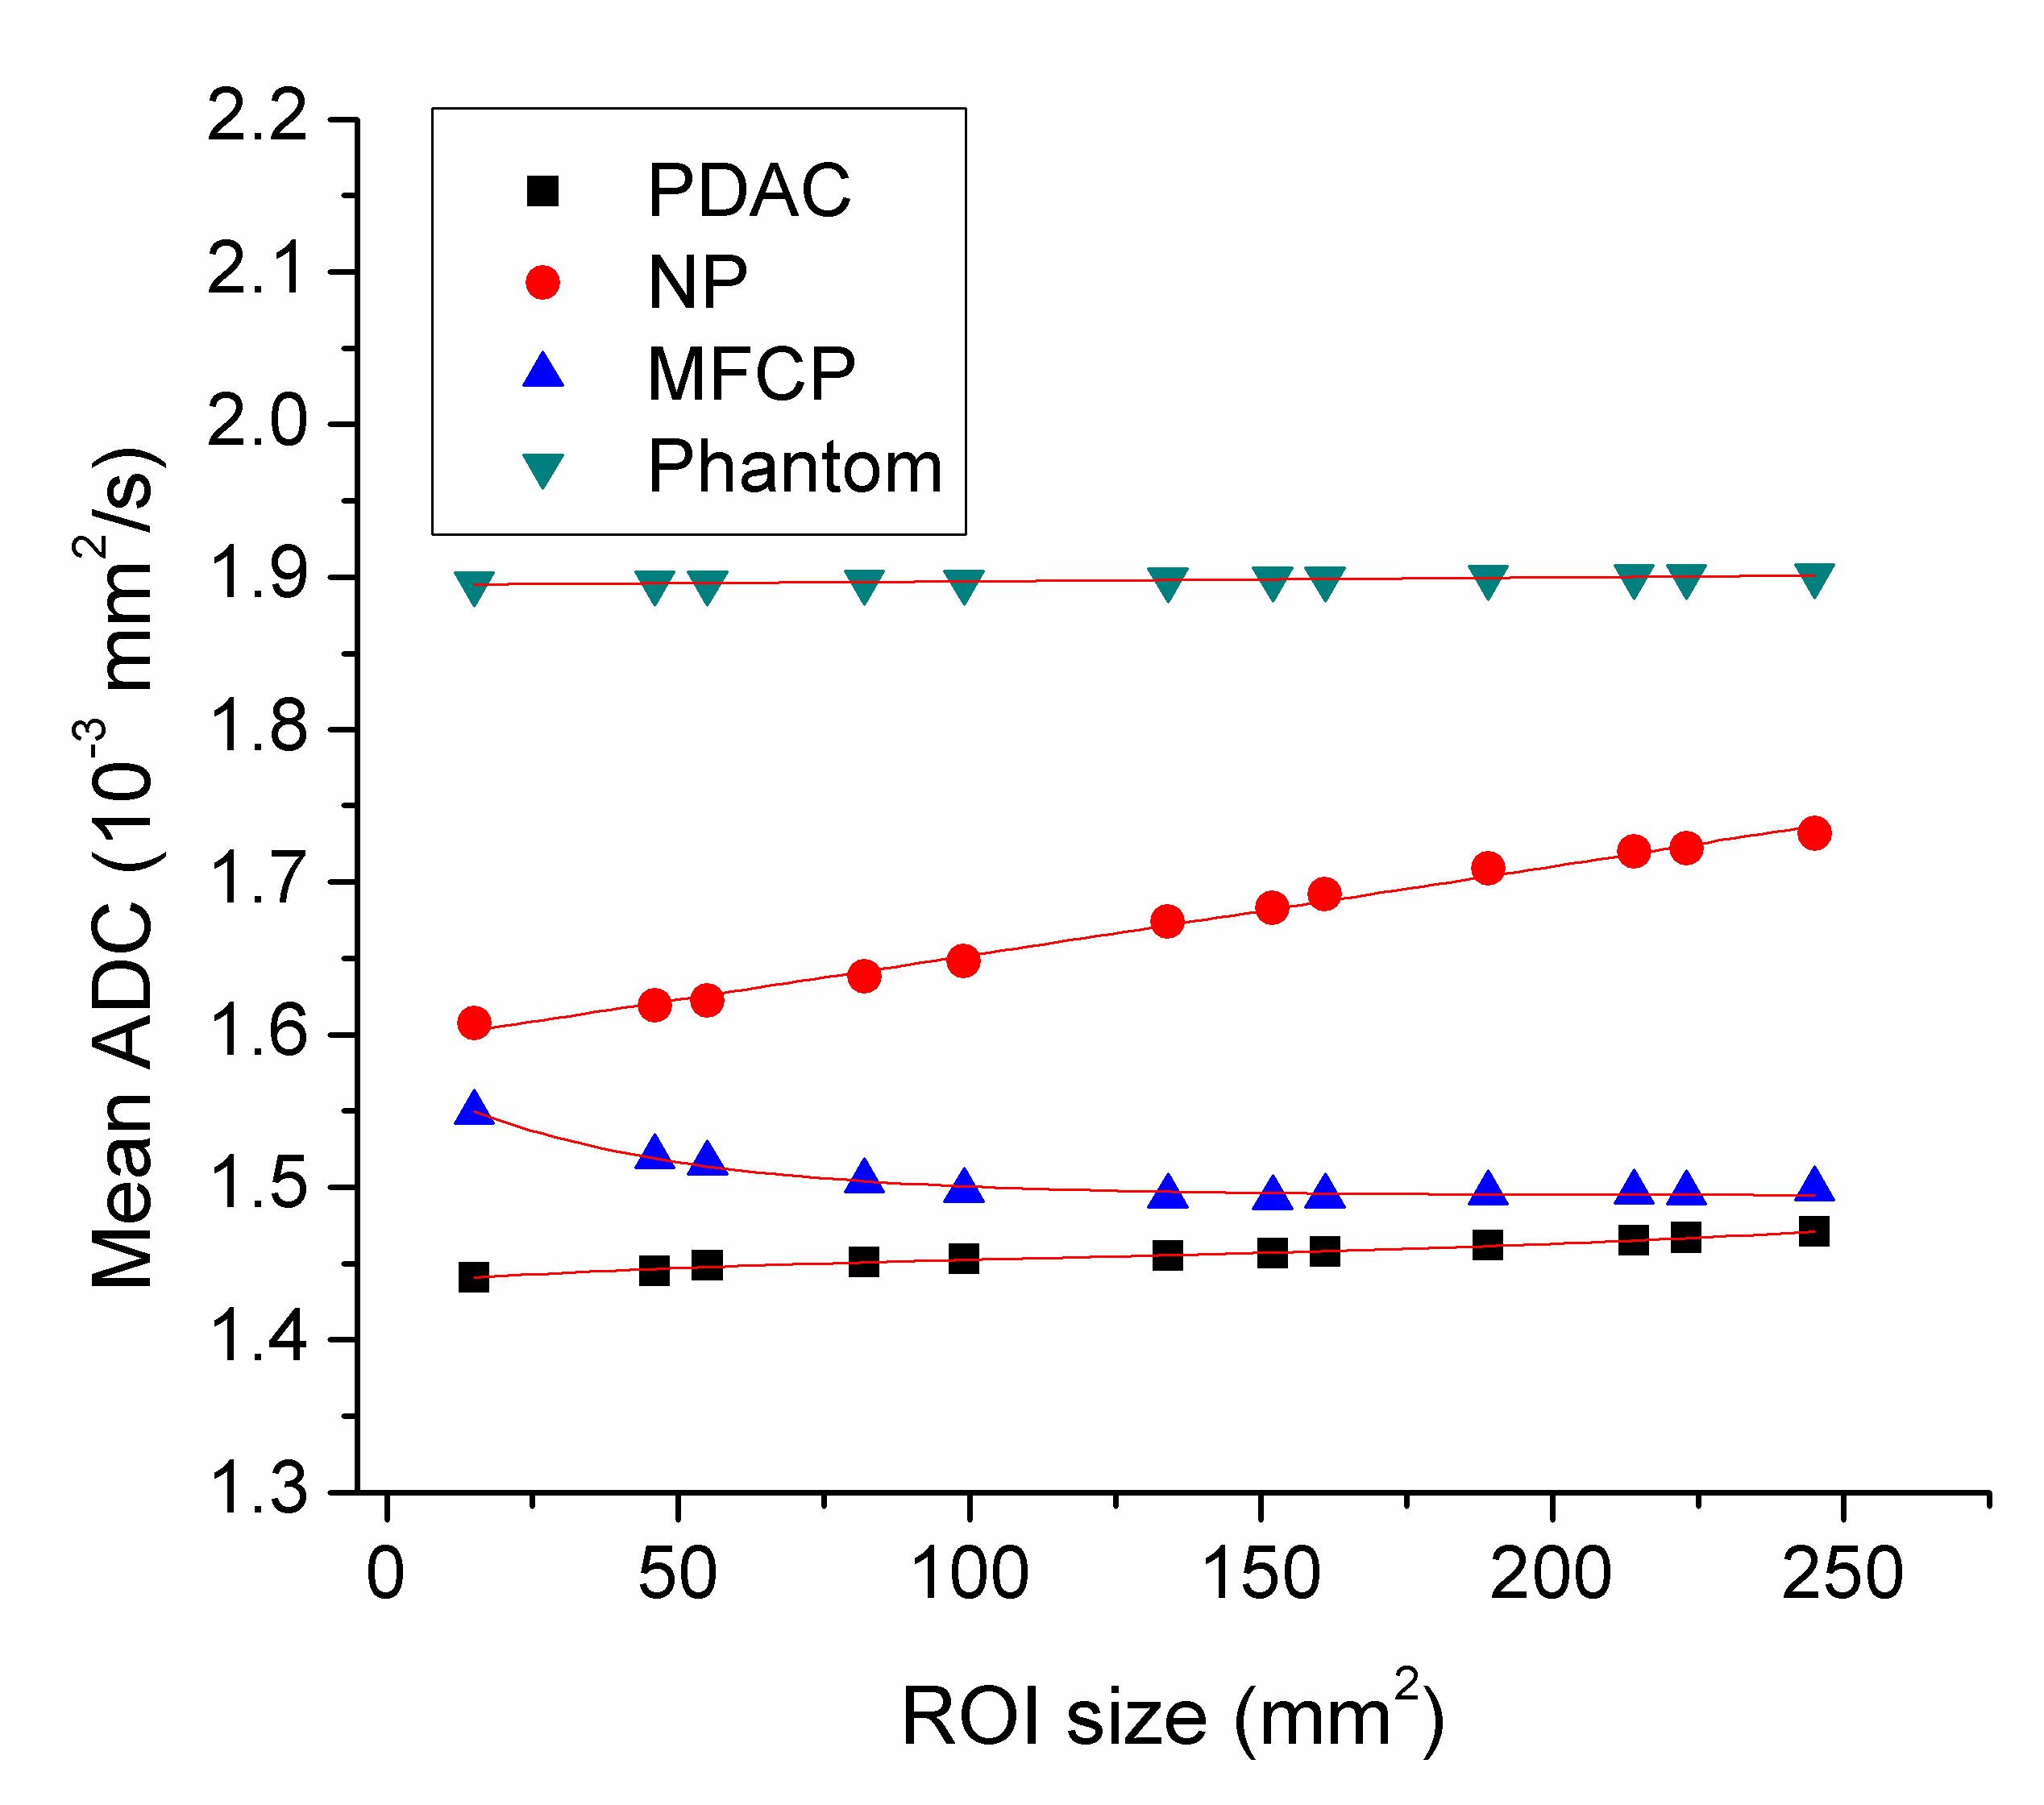
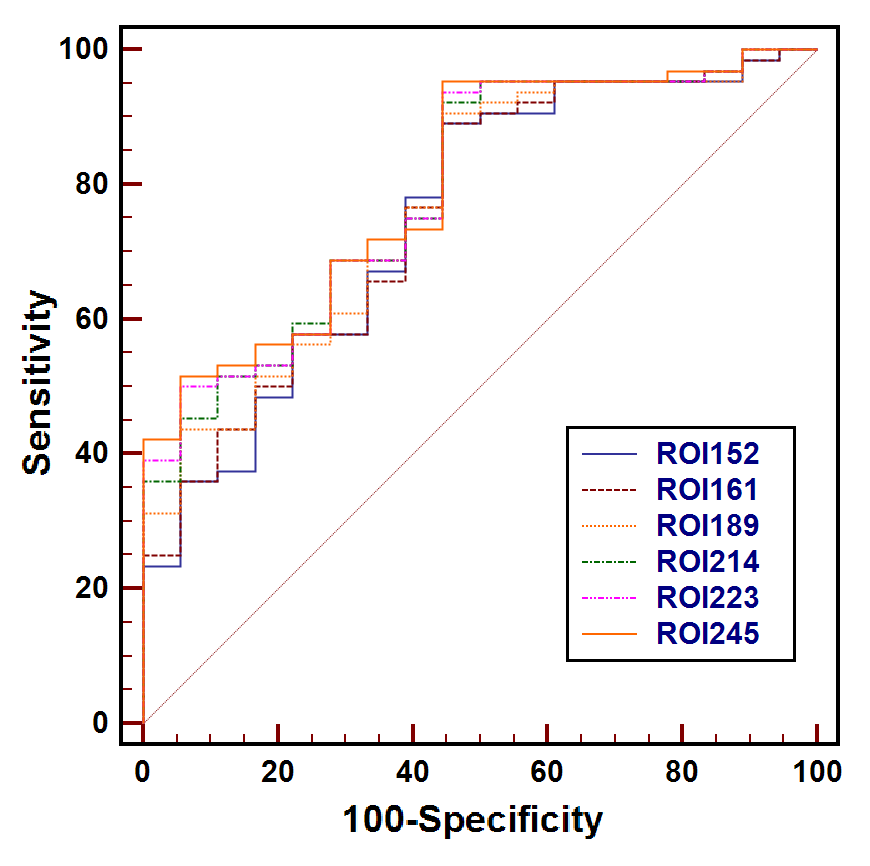
No significant differences were observed for the mean ADCs measured by 12 different-size ROIs for FP, or PDAC and NP (P=0.858-1.0) (Figure 2). With the increase of ROI size (≥55 mm2), ADCs of PDAC were significantly lower than those of NP (all P<0.05), but there was no difference of the accuracy in ADC for differentiating between the two groups only at a ROI size of ≥214 mm2. When ROI size was above 99 mm2, ADCs of MFCP were significantly lower than those of NP (all P<0.05). There were no significant differences for any of the mean ADCs measured by 12 different-size ROIs between PDAC and MFCP (P>0.05).Conclusions
In ADC measurements, the optimized ROI size is 214 mm2 for the differentiation between PDAC and NP; ROI size of ≥99 mm2 is recommended to differentiate between MFCP and NP. ADC was not useful for the differentiation of PDAC and MFCP.Acknowledgements
This work was supported by the Natural Science Foundation of Shanghai (14ZR1408300); medical guidance project of Shanghai Municipal Science and Technology Commission (14411960100); the 1255 Academic Discipline Project of Shanghai Changhai Hospital (CH125520800).References
1.Barral M, et al. Diffusion-weighted MR imaging of the pancreas: current status and recommendations. Radiology. 2015;274:45-63.
2. Lee SS, et al. Quantitative analysis of diffusion-weighted magnetic resonance imaging of the pancreas: usefulness in characterizing solid pancreatic masses. J Magn Reson Imaging 2008;28: 928-936
3. Takeuchi M, et al. High-b-value diffusion-weighted magnetic resonance imaging of pancreatic cancer and mass-forming chronic pancreatitis: preliminary results. Acta Radiol. 2008;49:383-386.
4. Fattahi R, et al. Pancreatic diffusion-weighted imaging (DWI): comparison between mass-forming focal pancreatitis (FP), pancreatic cancer (PC), and normal pancreas. J Magn Reson Imaging 2009;29: 350-356.
5. Wiggermann P, et al. Apparent diffusion coefficient measurements of the pancreas, pancreas carcinoma, and mass-forming focal pancreatitis. Acta Radiol 2012;53: 135-139
6. Sandrasegaran K, et al. Use of diffusion-weighted MRI to differentiate chronic pancreatitis from pancreatic cancer.Am J Roentgenol. 2013 ;201:1002-1008.
Figures