4976
Radiomics Model for Preoperative Prediction of Lymph Node Metastasis in Rectal Cancer after Neoadjuvant Chemoradiatherapy Therapy1Peking University Cancer Hospital and Institute, Beijing, People's Republic of China
Synopsis
Preoperative evaluation of lymph node metastasis in locally advanced rectal cancer remains a problem especially after neoadjuvant chemoradiatherapy treatment (NCT). This study proposed a MRI-based radiomics method to predict lymph node involvement in rectal after NCT. Beside the features from the tumor, features from the lymph nodes were also included for the construction of the radiomics model to increase the accuracy of prediction. 10-fold cross-validation among 300 patients produced ROC with average AUC=0.78. Independent validation with 118 patients produced ROC with AUC=0.81.
Introduction
The standard treatment for locally advanced rectal cancer is preoperative neoadjuvant chemoradiatherapy treatment (NCT) followed by standard resection of the rectum. Identification of lymph node (LN) involvement after NCT is crucial for treatment- decision-making. However, evaluation of lymph node metastasis in rectal cancer remains a problem especially after NCT1. With the rapid development of radiomics2-5, a CT-based radiomics nomogram has shown the capability of discriminating LN metastasis in colorectal cancer6. In this study, a MRI-based radiomics method was proposed to predict LN involvement in rectal after NCT. Beside the features from the tumor, feature from the lymph nodes were also included for the construction of the radiomics model to increase the accuracy of prediction.Method
The primary cohort of this study comprised an evaluation of 300 patients from the institutional database for medical records from July 2010 to Jun 2013 histologically confirmed rectal cancer who underwent surgical resection with curative intent. An independent validation comprised of 118 patients was recruited using the same criteria as primary cohort from July 2013 to Jun 2015. All patients received twice MR examinations with 3.0 Tesla MR scanner (Discovery 750, GE Healthcare) using an 8-channel phased array torso coil in the supine position. The first MR examination is before NCT, and another one is within one week before surgery. The tumor and the largest lymph node was chosen to analyze for every patient. Region of interest (ROI) of both tumor and LN were outlined by two experienced radiologists on high-resolution-axial T2-weighted images and diffusion weighted images (b=1000 s/mm2). Feature extraction and modeling was performed on Matlab (MathWorks, 2011b). Totally 98 features were extracted from the MR images, including 41 features from the largest LN in post-NCT T2-weighted images, 41 features from tumor in post-NCT T2-weighted images, 6 features from tumor in post-NCT apparent diffusion coefficient (ADC) map and 10 features from pre-NCT measurement. The least absolute shrinkage and selection operator (LASSO) algorithm7 were used for feature reduction and linear model construction. In the primary study, 10-fold cross-validation was performed by randomly dividing 300 patients into 10 groups and choosing each one group for validation and other 9 groups for training. The regularization parameter λ with maximum average AUC was chosen for independent validation that used all 300 patients in primary cohort for training and other 118 patients in independent group for validation.Result
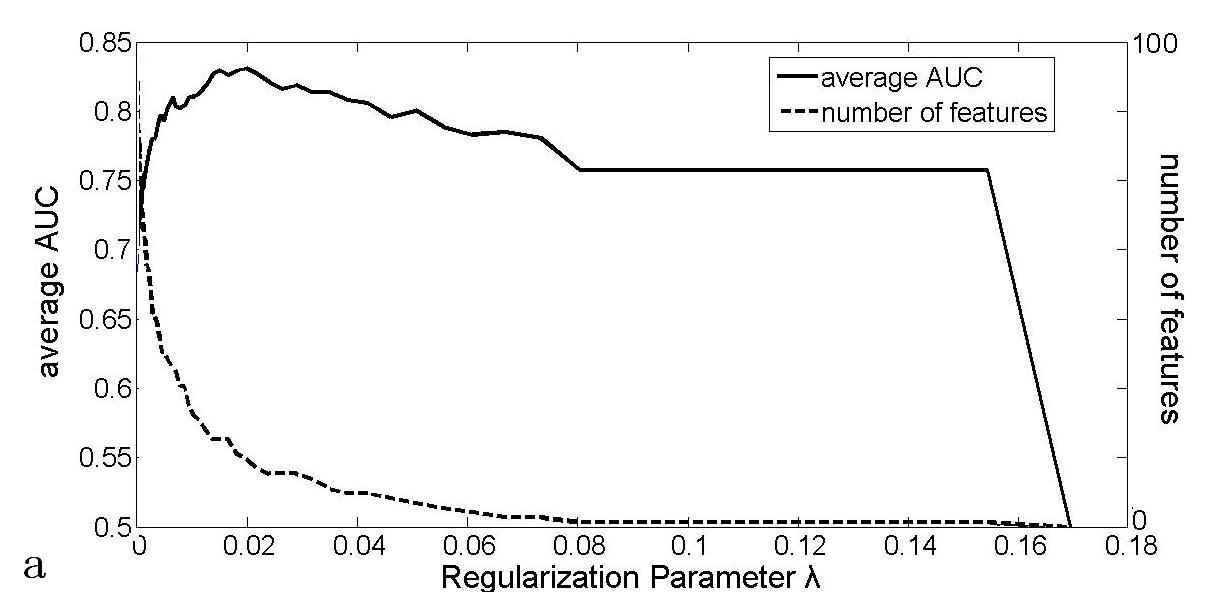
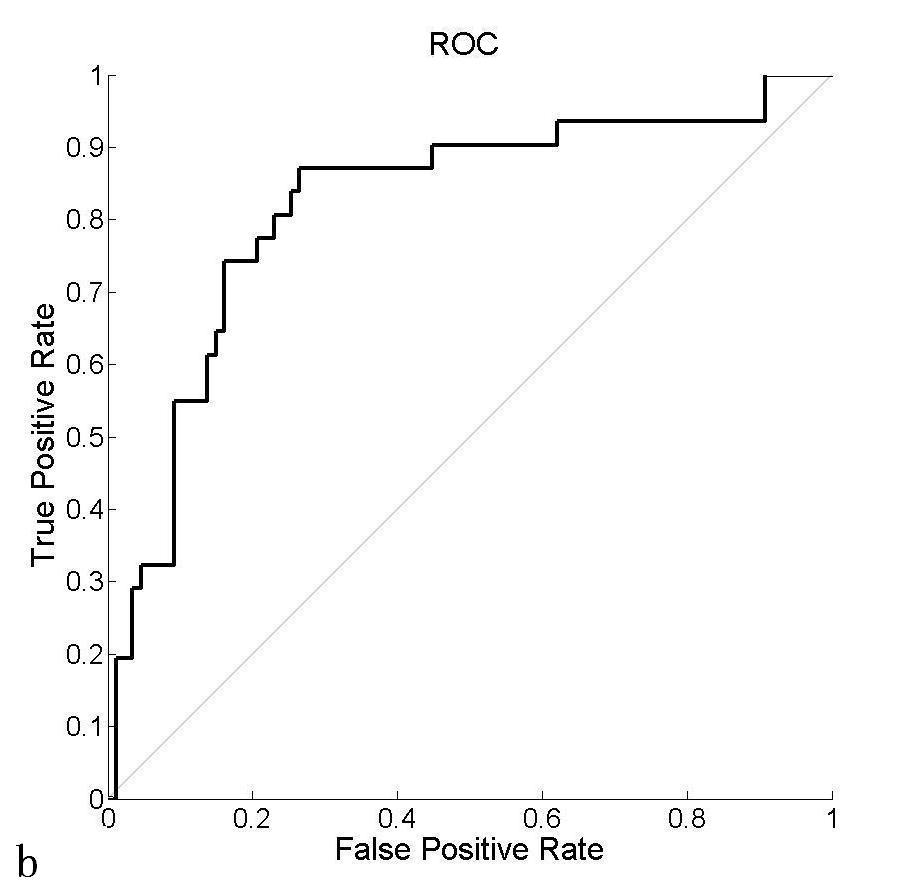
16 features were selected into the final model, including minimum intensity value, 4 Haralick texture8 features values from co-occurrence matrix (cluster shade, maximum possibility and inverse variance from two distances), 3 geometric features (the minor axial length, the elongation and orientation of the largest cross-section) of LN in post-NCT T2-weighted images, 4 features from image-based measurement (the distance between the lowest boundary of tumor and levator ani muscle, the length and depth of tumor from pre-NCT T2-weighted images, LN number from post-NCT T2-weighted images), 3 ADC features (average ADC value from pre-NCT tumor, minimum and maximum ADC value from post-NCT tumor) and 1 texture feature (Haralick value, the inertia) from tumor region in post-NCT T2-weighted images. The average AUC of 10-fold cross-validation is depicted in Fig.a with maximum value 0.78 appearing at regularization parameter λ=0.0199. This λ corresponds to the ROC curve in Fig. b that produced AUC=0.81 in the independent validation from 118 patients.Discussion
The study proposed a radiomics model for the preoperative prediction of LN metastasis in rectal cancer after NCT. Features from both LN and tumor were extracted. Clinically, larger LN has high possibility of metastasis. LN larger than 8 mm are generally considered as metastasis. In this study, we extracted features from the largest LN to avoid the variance of assessing all the LN from different individuals. It can be noticed that only one feature was selected from post-NCT tumor T2-weighted image. For comparison, another prediction model was built by excluding 41 from tumor in post-NCT T2-weighted images and produced average AUC equal to 0.78 in 10-fold cross-validation. On the contrary, if all features from LN in post-NCT T2-weighted images were excluded, the average AUC dropped to 0.75. Therefore, LN T2-weighted images and tumor diffusion weighted images are preferred by radiomics in predicting LN metastasis in rectal cancer after NCT.Acknowledgements
No acknowledgement found.References
[1] Li XT, Sun YS, Tang L, Cao K, Zhang XY.Evaluating Locally Lymph Node Metastasis with Magnetic Resonance Imaging, Endoluminal Ultrasound and Computed Tomography in Rectal Cancer: A Meta-Analysis. Colorectal Dis 2015; 17(6):O129-35.
[2] Lambin P, Rios-Velazquez E, Leijenaar R, et al. Radiomics: Extracting more information from medical images using advanced feature analysis. European Journal of Cancer 2012; 48, 441-446.
[3] Kumar V, Gu Y, Basu S, et al. Radiomics: the process and the challenges. Magnetic Resonance Imaging 2012;30:1234-1248.
[4] Aerts H, Rios-Velazquez E, Leijenaar R, et al. Decoding tumour phenotype by noninvasive imaging using a quantitative radiomics approach. Nature Communication 2013;5:4006.
[5] Nie K, Shi L, Chen Q, et al. Rectal cancer: assessment of neoadjuvant chemo-radiation outcome based on radiomics of multi-parametric MRI. Clinical cancer research 2016;22:12
[6] Huang Y, Liang C, He L, et al. Development and validation of a radiomics nomogram for preoperative prediction of lymph node metastasis in colorectal cancer. Journal of Clinical Oncology 2016;18:2157-2164.
[7] Sauerbrei W, Royston P, Binder H: Selection of important variables and determination of functional form for continuous predictors in multivariable model building. Stat Med 2007;26:5512-28.
[8] Robert M. Haralick, Statistical and structural approaches to texture, Proc. IEEE 1979;67(5): 786-804.
Figures