4973
Assessment of Histological Differentiation in Gastric Cancers Using Whole-Volume Histogram Analysis of Apparent Diffusion Coefficient Maps1Department of Radiology, Drum Tower Hospital, School of Medicine, Nanjing University, Nanjing, People's Republic of China, 2Department of Radiology, Drum Tower Hospital, School of Medicine, Nanjing University, 3Philips Healthcare, Shanghai, People's Republic of China
Synopsis
Seventy-eight patients with gastric cancer were underwent MRI to investigate whether the histogram analysis of the entire tumor volume in ADC maps could differentiate between histological grades. A series of histogram parameters were calculated and correlated with the histological grade of the surgical specimen. There were significant differences in the 5th, 10th, 25th, and 50th percentiles, skew, and kurtosis between poorly and well-differentiated gastric cancers. There were correlations between the degrees of differentiation and histogram parameters, including the 10th percentile, skew, kurtosis, and max frequency. Histogram analysis of the ADC maps can be useful in differentiating between histological grades.
PURPOSE
To investigate the efficacy of histogram analysis of the entire tumor volume in apparent diffusion coefficient (ADC) maps for differentiating between histological grades in gastric cancer.METHODS
Seventy-eight patients with gastric cancer were enrolled in a retrospective 3.0T magnetic resonance imaging (Achieva 3.0T TX; Philips Medical Systems, Best, theNetherlands) study. ADC maps were obtained at two different b values (0 and 1000 sec/mm2) for each patient.Tumors were delineated on each slice of the ADC maps, and a histogram for the entire tumor volume was subsequently generated. A series of histogram parameters were calculated and correlated with the histological grade of the surgical specimen. The diagnostic performance of each parameter for distinguishing poorly from moderately well-differentiated gastric cancers was assessed by using the area under the receiver operating characteristic curve (AUC).RESULTS
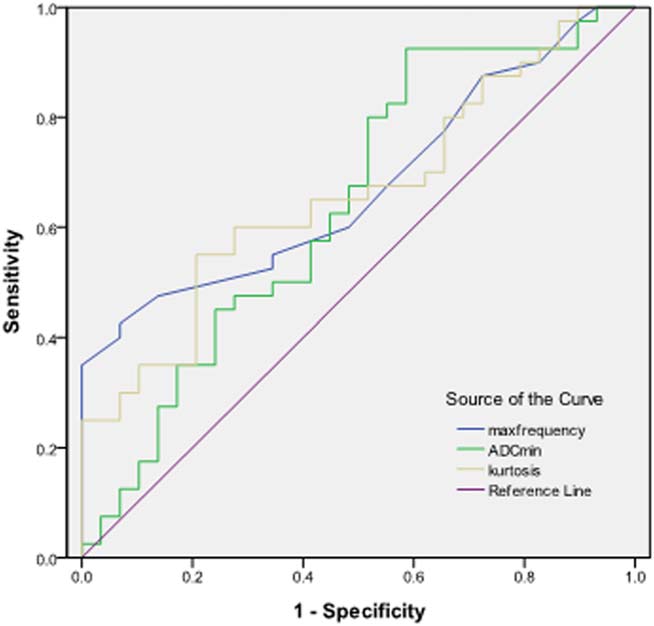
There were significant differences in the 5th, 10th, 25th, and 50th percentiles, skew, and kurtosis between poorly and well-differentiated gastric cancers (P < 0.05). There were correlations between the degrees of differentiation and histogram parameters, including the 10th percentile, skew, kurtosis, and max frequency; the correlation coefficients were 0.273, –0.361, –0.339, and –0.370, respectively. Among all the histogram parameters, the max frequency had the largest AUC value, which was 0.675.DISCUSSION
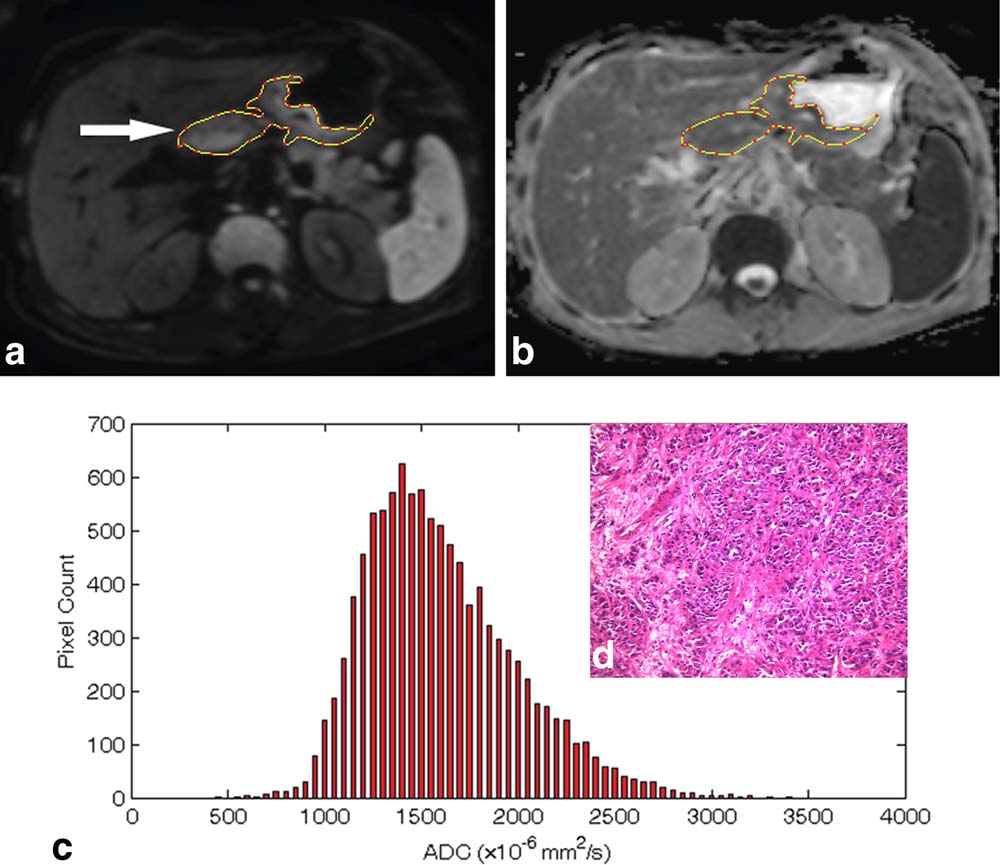
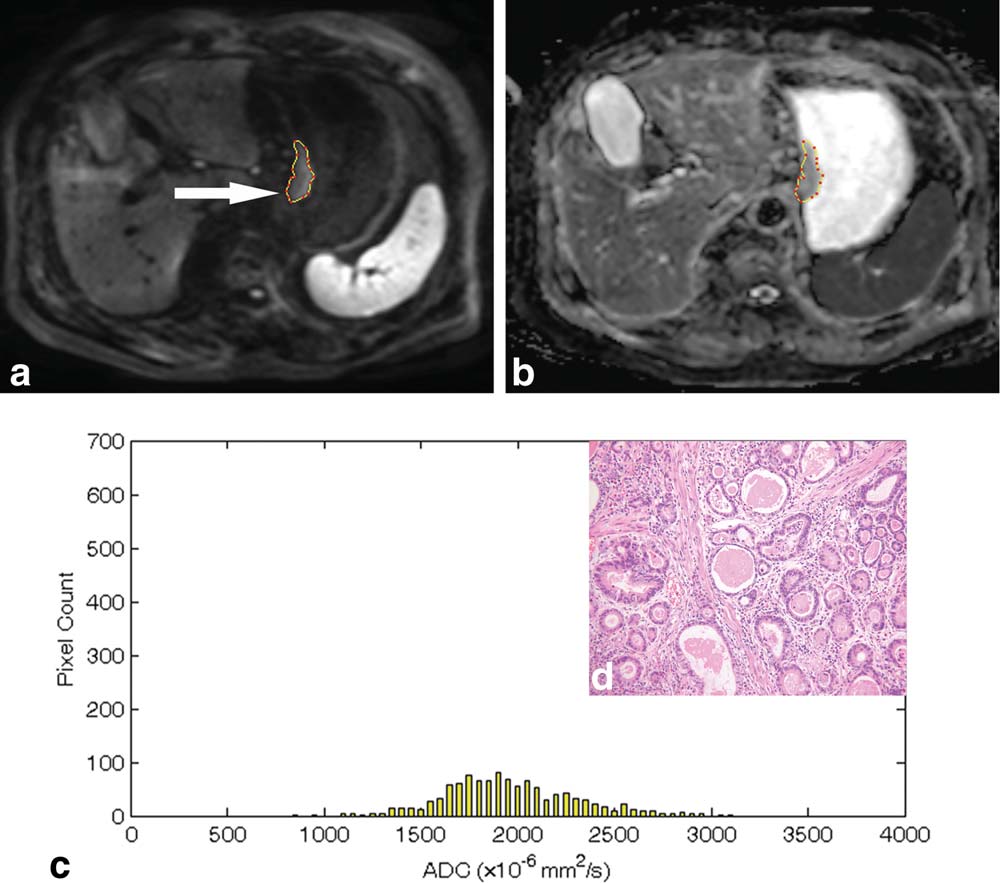
In this study, the lower (5th, 10th, and 25th) percentiles of the accumulative histogram analysis, which represent the areas with the highest level of restricted water motion, seemed effective in assessing the pathologic subtypes and histological differentiation of gastric cancers. By contrast, the higher percentile (50th, 75th, and 90th), representing areas with less restricted molecules or necrosis and cystic components, seemed to be less effective in assessing gastric cancers. As the degrees of gastric carcinoma differentiation increased (from poorly to well differentiation), the values of the skew, kurtosis, and max frequency gradually decreased. Histograms of the poorly differentiated gastric carcinomas appeared to be asymmetric, and they shifted to low ADC values with a high peak, while histograms of well-differentiated lesions tended to be symmetric and shifted to a high intensity area with a low peak. A possible explanation for this observation is that normal glandular structures and the cell arrangement are more or less maintained in well-differentiated lesions, while loss of the epithelium polarity and distortion of the normal glandular structures were more obvious in the poorly differentiated lesions.CONCLUSION
Histogram analysis of the ADC maps on the basis of the entire tumor volume can be useful in differentiating between histological grades for gastric cancer.Acknowledgements
No acknowledgement found.References
1. Lee IS, Park YS, Lee JH, et al. Pathologic discordance of differentiation between endoscopic biopsy and postoperative specimen in mucosal gastric adenocarcinomas. Ann Surg Oncol 2013;20:4231–4237.
2. Liu S, Wang H, Guan W, et al. Preoperative apparent diffusion coefficient value of gastric cancer by diffusion-weighted imaging: Correlations with postoperative TNM staging. J Magn Reson Imaging 2015, 42(3):837–843
3. Liu S, Guan W, Wang H, et al. Apparent diffusion coefficient value of gastric cancer by diffusion-weighted imaging: correlations with the histological differentiation and Lauren classification. Eur J Radiol 2014;83:2122–2128.
4. Choi MH, Oh SN, Rha SE, et al. Diffusion-weighted imaging: Apparent diffusion coefficient histogram analysis for detecting pathologic complete response to chemoradiotherapy in locally advanced rectal cancer. J Magn Reson Imaging JMRI 2015 [Epub ahead of print].
Figures