4972
Phase Contrast Magnetic Resonance Imaging using Non-contrast-enhanced Magnetic Resonance Angiography using Balanced Steady-State Free-Precession Sequence and Time-Spatial Labeling Inversion Pulse: Measuring Left Gastric Vein Flow Velocity to Predict Esophageal Varices Development and Rupture1Kyoto University, Kyoto, Japan
Synopsis
LGV flow velocity is clinically important to foresee esophageal varices development and rupture. But it is difficult to measure it's velocity exactly by echo or only phase contrast MRI (PC-MRI). To measure LGV flow velocity, 2D PC-MRI were set perpendicularly across vessel segments in the cross-sectional slice position determined from 3D selective visualized LGV using non-contrast-enhanced MRA with balanced steady-state free-precession sequence and time-spatial labeling inversion pulse. LGV flow velocity of all subjects could be measured exactly. This method is useful to measure LGV flow velocity.
Purpose
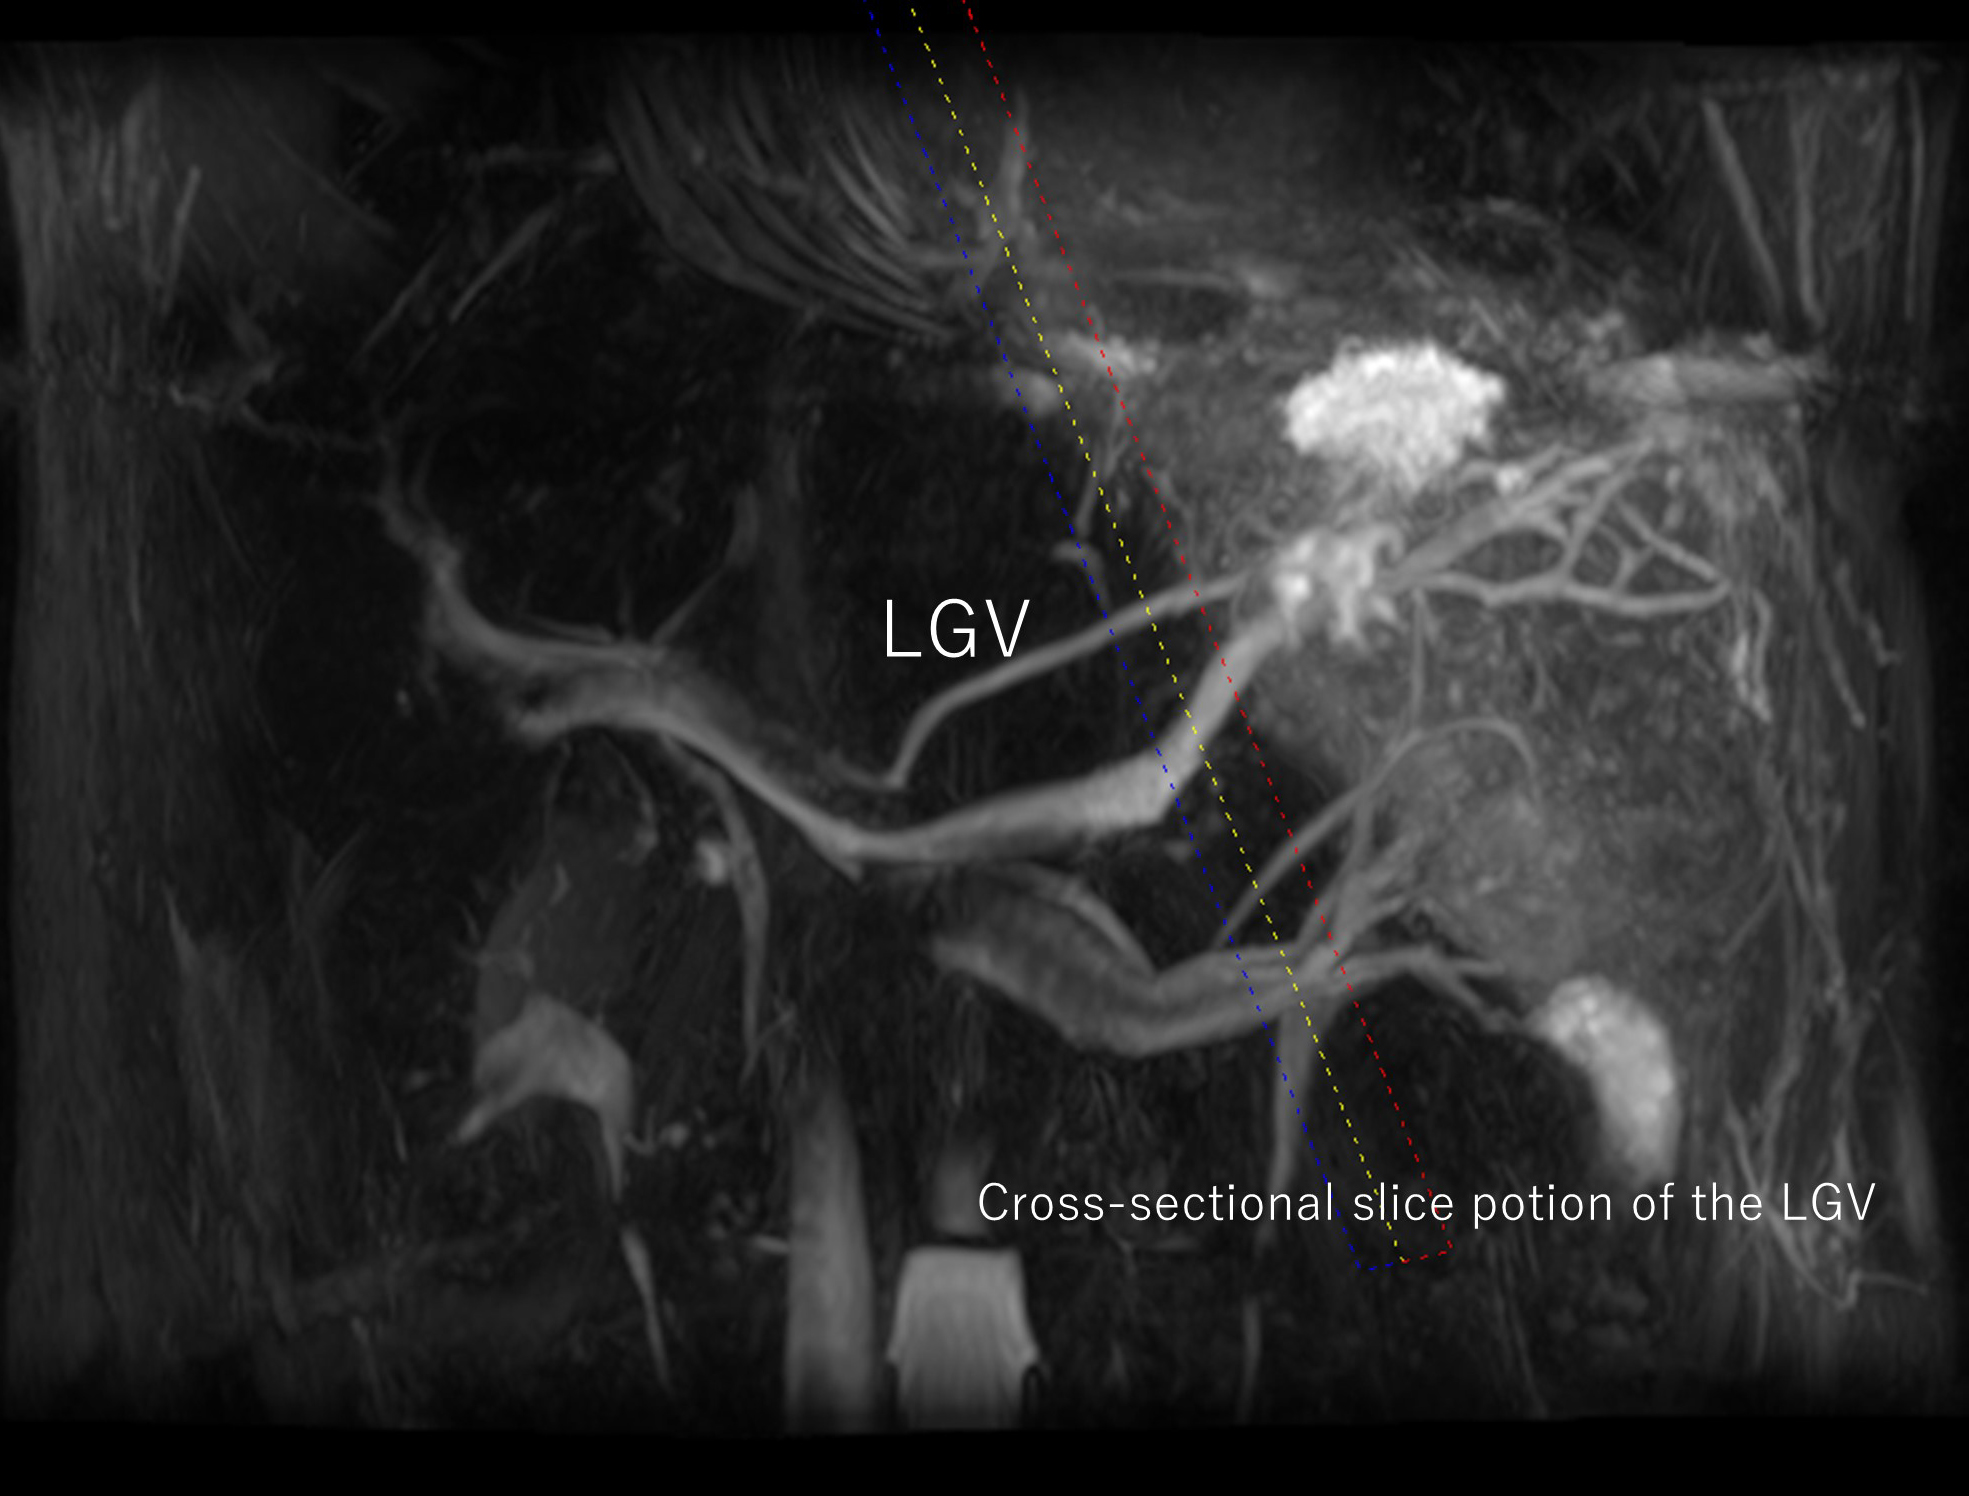
The reported incidence rate of esophageal varices in patients with liver cirrhosis is 30%–60%, depending on the severity of portal hypertension [1, 2]. Esophageal variceal hemorrhage is the second most common cause of death in patients with cirrhosis [3]. Esophageal varices are mainly supplied by an enlarged hepatofugal left gastric vein (LGV).As portal vein (PV) pressure increases, LGV flow in the PV system transforms to a portal systemic shunt by changing the flow direction from normal (toward the liver: hepatopetal) to reversed (away from the liver: hepatofugal, and esophageal varices are gradually formed [4]. Also, higher hepatofugal LGV flow velocity, the higher the risk of esophageal varices rupture becomes [4, 5]. Therefore, LGV flow velocity is clinically important to foresee esophageal varices development and rupture. Some studies reported LGV flow velocity by Doppler Ultrasonograghy (US) [6-8]. However, limitations of the Doppler US are significantly operator- and apparatus-dependent, and the dependency of the measurement of velocity on the angle of insonation [8-11].Phase contrast Magnetic resonance imaging (PC-MRI) has also been used for quantization of blood flow in various vessels , and it has been reported that PC-MRI can measure PV flow velocity with a lower variability and higher reproducibility than Doppler US [12-14]. But, it has not reported about measuring the LGV flow using PC-MRI.To measure LGV flow velocity, PC-MRI are acquired perpendicularly across vessel segments in the cross-sectional slice position determined from the gradient-echo acquisitions [15]. But, it is hard to acquired cross-sectional slice position of the LGV by using non-contrast-enhanced MRA. Because it is difficult to detect the LGV for the reason that there are many vessels near the LGV around the stomach and the LGV has a variety of running courses. (fig.1). Non-contrast-enhanced MRA with balanced steady-state free-precession sequence (bSSFP) and time-spatial labeling inversion pulse (Time-SLIP) can visualize the 3D selective visualized LGV, and acquire cross-sectional slice position of the LGV easily.The purpose of our study was to measure the LGV flow velocity by PC-MRI using non-contrast-enhanced MRA with bSSFP and Time-SLIP in healthy subjects. Herein, we report our initial experience.
Methods
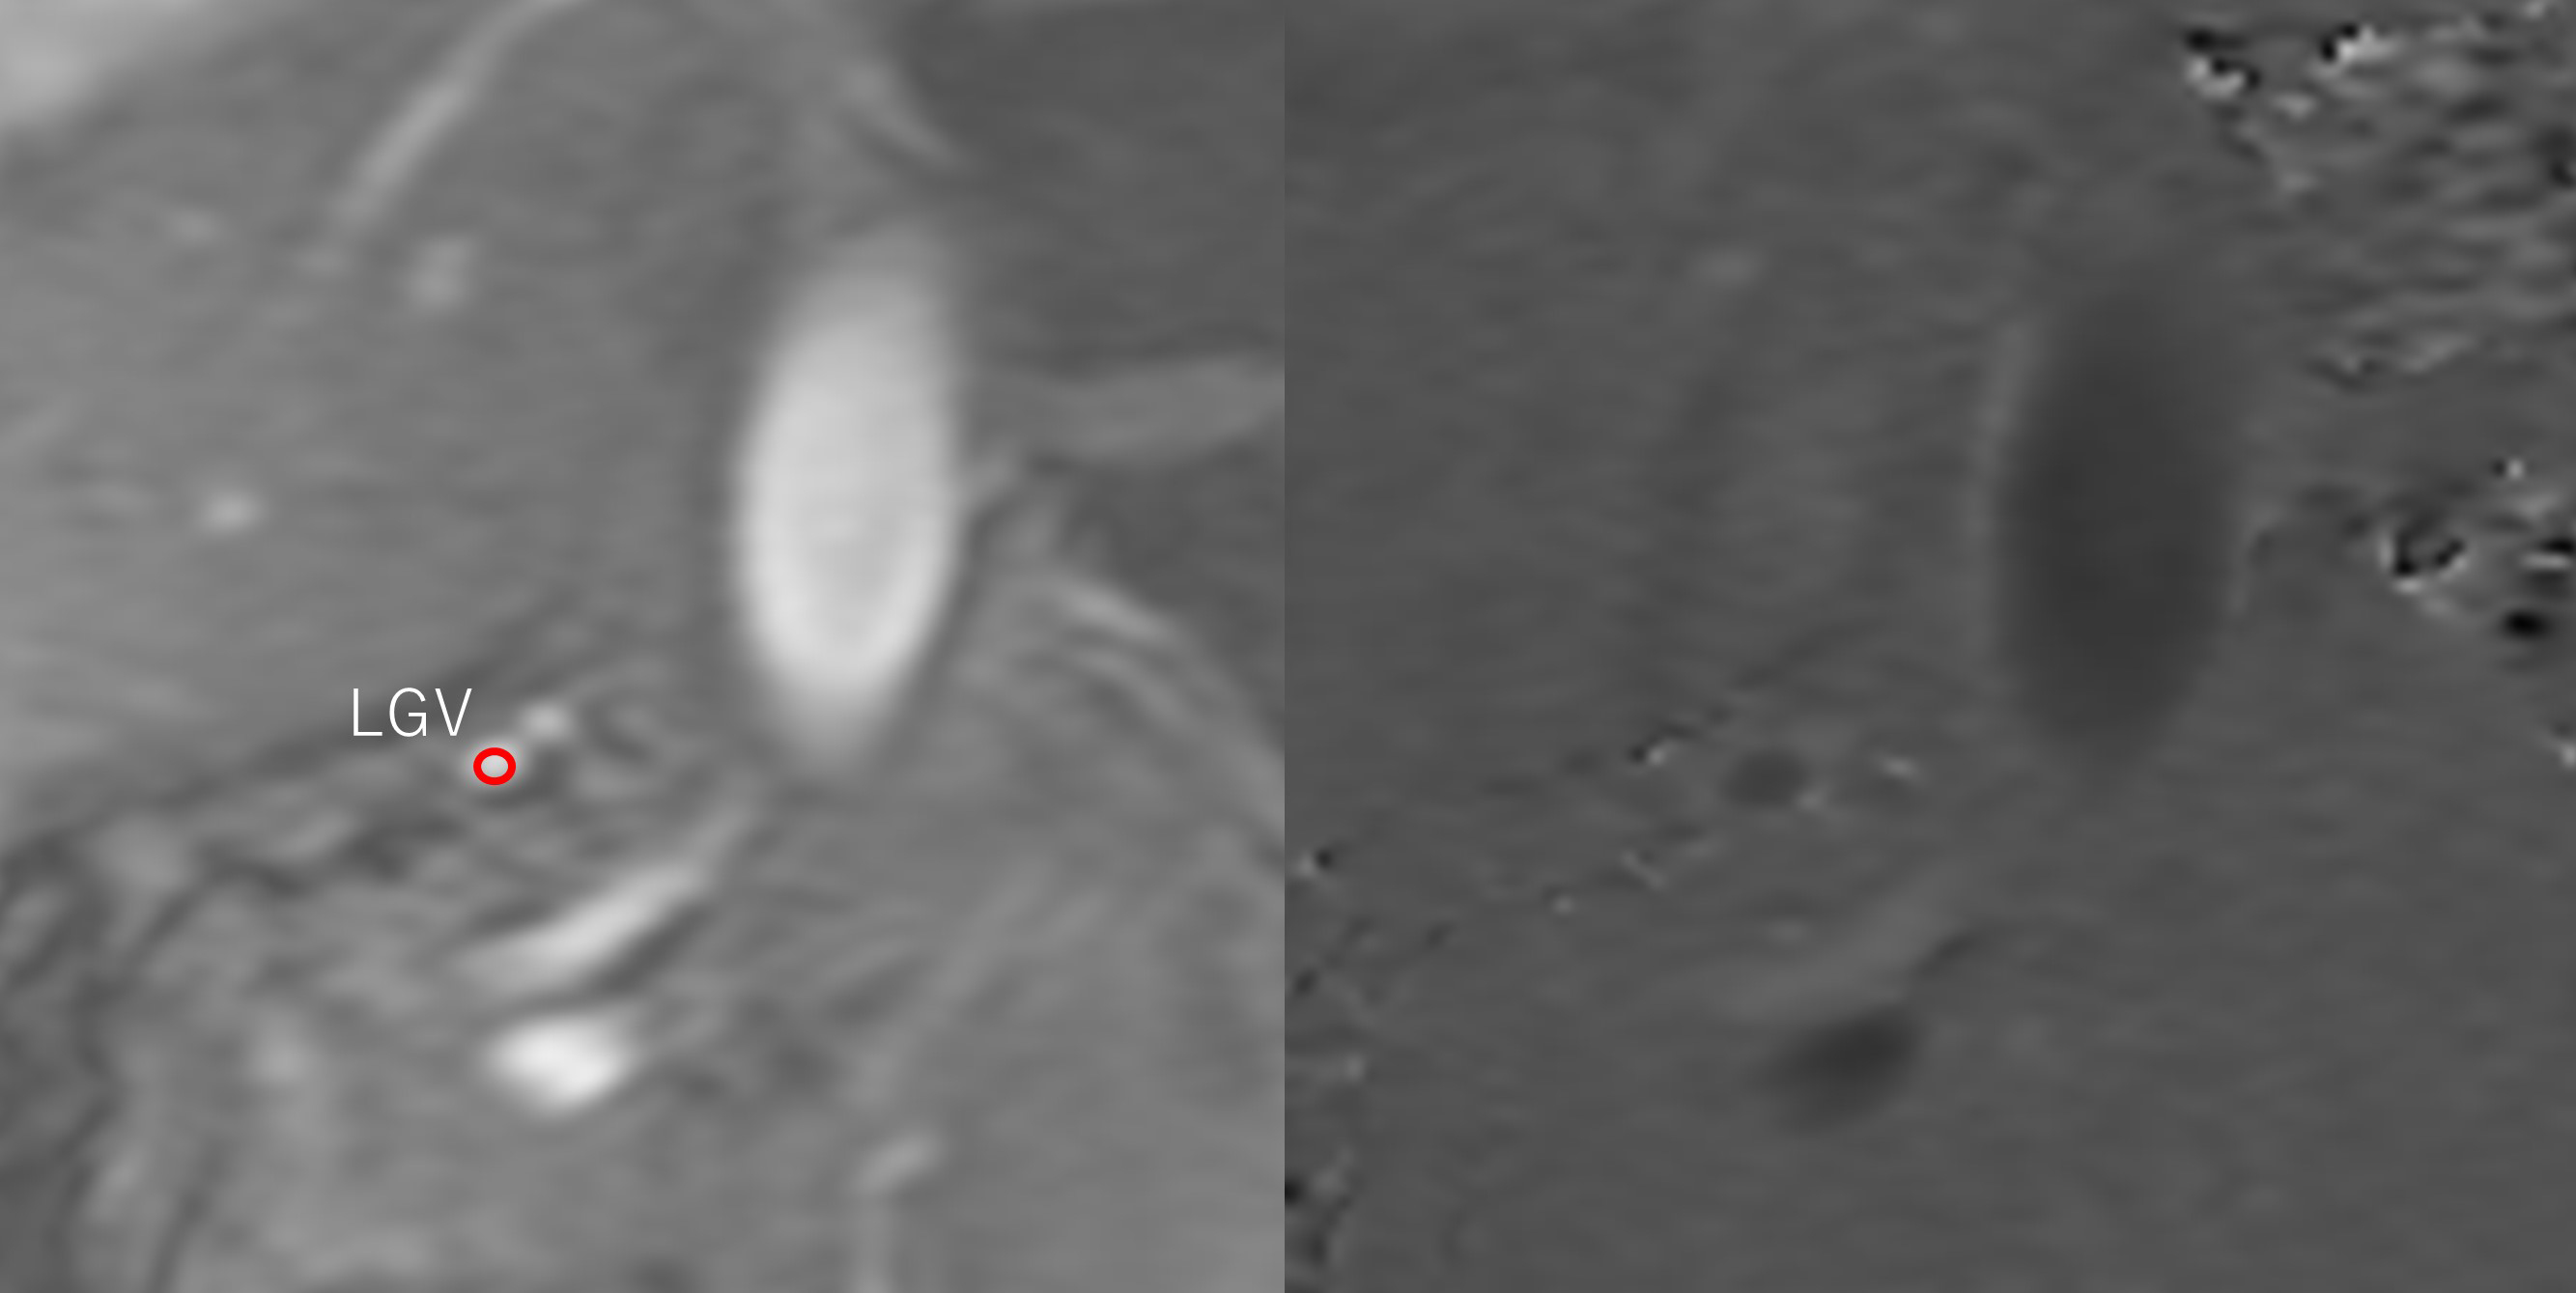
Ten healthy volunteers were examined using respiratory-triggered 3D bSSFP and PC-MRI for the LGV at a 3T MR unit (Vantage, Toshiba Medical Systems Co, Otawara, Japan). A respiratory triggered 3D bSSFP imaging sequence with fat saturation was performed with the following parameters: TR/TE/FA = 4.8 msec/2.4 msec/90°, receiver bandwidth = 781 Hz/pixel, FOV = 330 × 200 mm2, matrix size = 256 × 256, slice thickness = 2 mm, number of slices = 38-50 without a gap, and number of acquisitions = 1. The parallel imaging was applied in the phase direction with a factor of 2. LGV visualization with hepatopetal flow were as follows: One Time-SLIP was placed on the whole abdomen to suppress signals using TI = 1,513 ms. The other Time-SLIP was placed on the spatial area from the gastric fornix to the gastric upper body to recover signals of the area, which was considered the source of LGV. The Time-SLIP thickness was 80 mm, and TI was 1,500 ms. To measure flow, 2D PC-MRI were set perpendicularly across vessel segments in the cross-sectional slice position determined from 3D selective visualized LGV (fig.2, 3). A PC-MRI with electrocardiogram gating in expiratory phase of respiration was conducted with the following parameters: TR/TE/FA = 10.5 ms/5 ms/20° and receiver bandwidth =±97.5 Hz/pixel. FOV = 140 × 200 mm2, matrix size = 80 × 256, slice thickness = 6 mm, number of segments = 16, acceleration factor=2., wrap= 2 × 1, NEX = 1. Measurement point (per 1heart beat) were 7-9 points, and acquisition time =17-21 sec. These depended on heart rate. Encoding velocities were set to 70 cm/s. Hepatopetal defined plus flow.Results
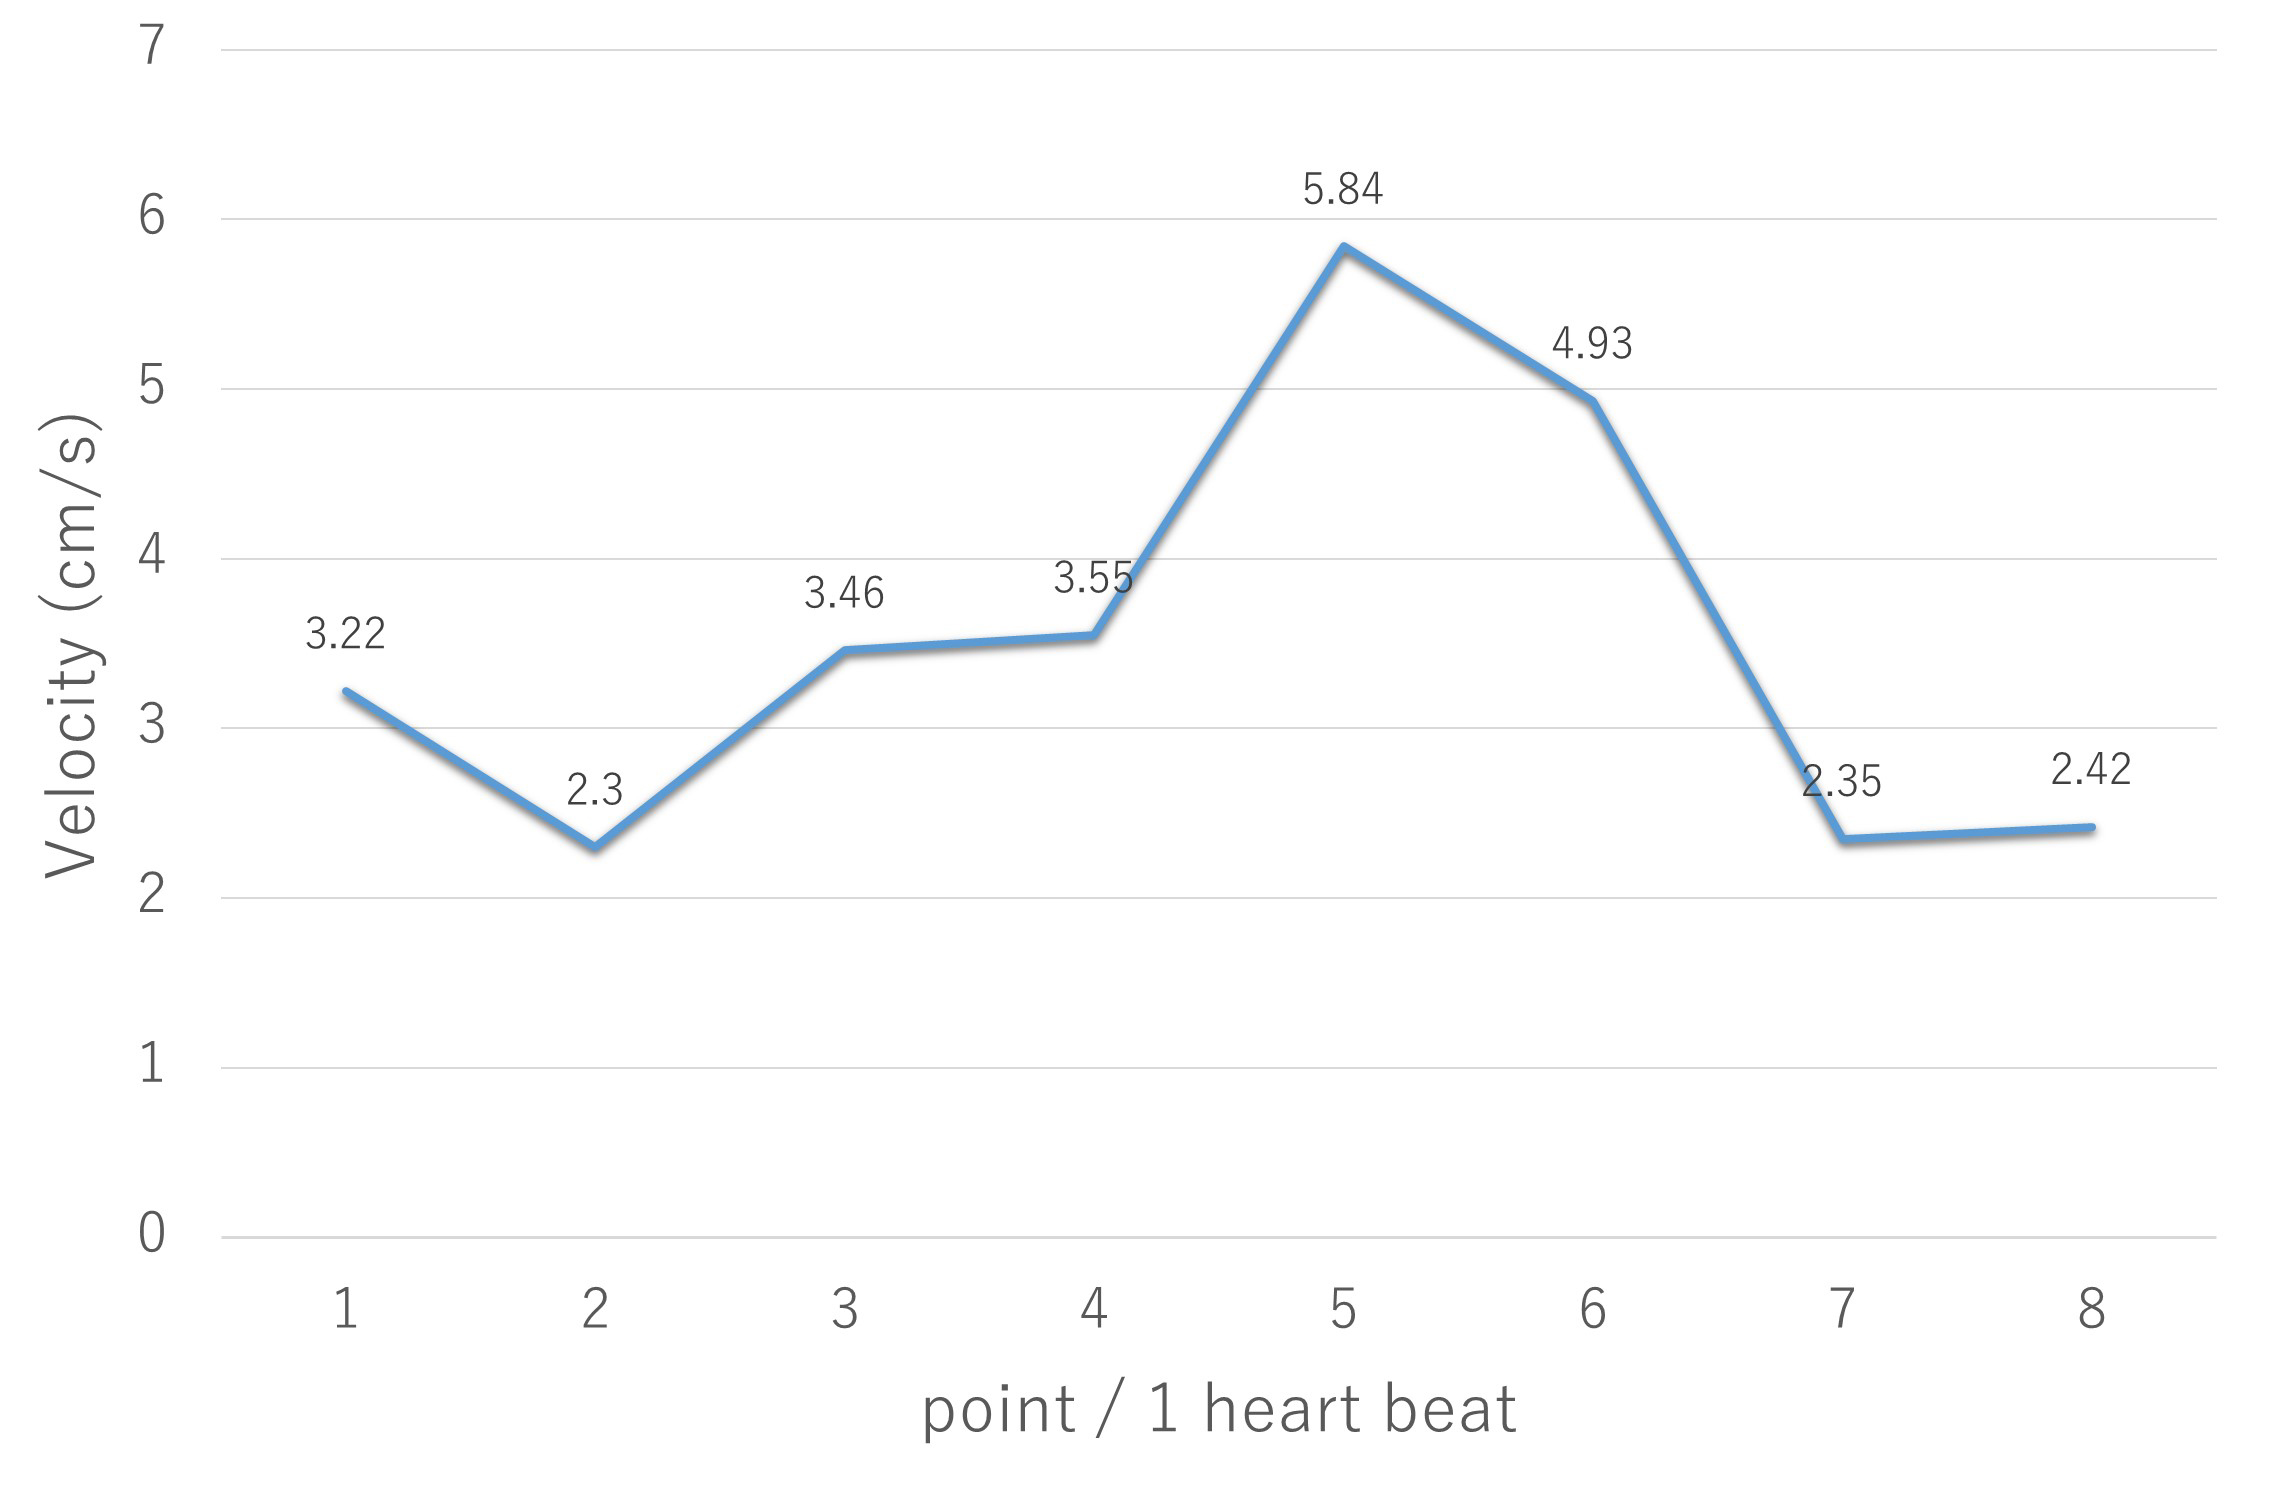
The LGV flow velocity of all subjects could be performed (fig.4). Average velocity of each subject’s mean velocity was 5.3 ± 2.1 cm/s, average velocity of each subject’s maximum velocity was 7.8 ± 2.7cm/s and average velocity of each subject’s minimum velocity was 2.3 ± 2.6 cm/s. In one subject, LGV’s flow was almost hepatopetal but became hepatofugal temporary.Conclusions
The LGV flow velocity by PC-MRI using non-contrast-enhanced MRA with bSSFP and Time-SLIP was able to be measured easily and exactly.Acknowledgements
The authors thank Ms. Kyoko Takakura, RT (Kyoto University Graduate School of Medicine) for her excellent technical assistance and advice on sequence optimization and all volunteers who were willing to participate in our study.References
1. Bosch, J., et al., The management of portal hypertension: rational basis, available treatments and future options. J Hepatol, 2008. 48 Suppl 1: p. S68-92.
2. Merli, M., et al., Incidence and natural history of small esophageal varices in cirrhotic patients. J Hepatol, 2003. 38(3): p. 266-72.
3. Garcia-Tsao, G., et al., Prevention and management of gastroesophageal varices and variceal hemorrhage in cirrhosis. Hepatology, 2007. 46(3): p. 922-38.
4. Matsutani, S. and H. Mizumoto, To-and-fro waveforms in the left gastric vein in portal hypertension. Journal of Medical Ultrasonics, 2012. 39(2): p. 101-104.
5. Li, F.H., et al., Hemodynamic analysis of esophageal varices in patients with liver cirrhosis using color Doppler ultrasound. World J Gastroenterol, 2005. 11(29): p. 4560-5.
6. Hino, S., et al., Hemodynamic assessment of the left gastric vein in patients with esophageal varices with color Doppler EUS: Factors affecting development of esophageal varices. Gastrointestinal Endoscopy, 2002. 55(4): p. 512-517.
7. Adithan, S., et al., Color Doppler evaluation of left gastric vein hemodynamics in cirrhosis with portal hypertension and its correlation with esophageal varices and variceal bleed. Indian J Radiol Imaging, 2010. 20(4): p. 289-93.
8. Matsutani, S., et al., Hemodynamics of the left gastric vein in portal hypertension. Gastroenterology, 1993. 105(2): p. 513-8.
9. de Vries, P.J., et al., Duplex Doppler measurements of portal venous flow in normal subjects. Inter- and intra-observer variability. J Hepatol, 1991. 13(3): p. 358-63.
10. Annet, L., et al., Hepatic flow parameters measured with MR imaging and Doppler US: correlations with degree of cirrhosis and portal hypertension. Radiology, 2003. 229(2): p. 409-14.
11. Gill, R.W., Measurement of blood flow by ultrasound: accuracy and sources of error. Ultrasound Med Biol, 1985. 11(4): p. 625-41.
12. Gouya, H., et al., Chronic liver disease: systemic and splanchnic venous flow mapping with optimized cine phase-contrast MR imaging validated in a phantom model and prospectively evaluated in patients. Radiology, 2011. 261(1): p. 144-55.
13. Hara, A.K., et al., Variability of consecutive in vivo MR flow measurements in the main portal vein. AJR Am J Roentgenol, 1996. 166(6): p. 1311-5.
14. Yzet, T., et al., Hepatic vascular flow measurements by phase contrast MRI and doppler echography: a comparative and reproducibility study. J Magn Reson Imaging, 2010. 31(3): p. 579-88.
15. Underwood, S.R., et al., Magnetic resonance velocity mapping: clinical application of a new technique. Br Heart J, 1987. 57(5): p. 404-12.
Figures