4970
Comparison of Measurement of Abdominal Visceral Adipose Tissue in Men and Women by MRI vs. DXACherie R Shook1, Bret H Goodpaster1, and Heather H Cornnell1
1Translational Research Institute for Metabolism and Diabetes, Florida Hospital, Orlando, FL, United States
Synopsis
Visceral adipose tissue (VAT) has been identified as a significant contributing factor to the metabolic complications of obesity and cardio-metabolic disease, thus its precise measurement is becoming more clinically relevant. Both MRI and DXA were used to measure different components of body composition including VAT, and these results were compared by gender. Both scan acquisitions took similar amounts of time, but DXA results were calculated automatically while MR data processing was completed offline, thus took more time. The results from this study indicate that DXA is a precise measure of only a portion of VAT while MRI can give a more accurate measurement of total VAT across the entire abdomen, potentially avoiding gender bias.
Purpose
To compare the measurement of abdominal visceral adipose tissue in men and women using Magnetic Resonance (MR) Imaging with Dual X-ray Absorptiometry (DXA).Methods
Volunteers (17 men and 12 women) on one of two study protocols, approved by the Institutional Review Board at the Florida Hospital, consented to imaging on both a GE iLunar DXA whole body scanner (GE Healthcare, enCORE v 14.1 with CoreScan) and a 3T Philips Acheiva (Philips Healthcare, MR Systems Acheiva Release 3.2.2.0 2011-08-11), or the MR only, on site at the Translational Research Institute for Metabolism and Diabetes, Orlando FL. DXA total body scans reported body composition (fat mass, fat free mass, tissue fat % etc.) and VAT mass and volume estimates from internal (automatic) GE enCORE calculations. A T1 weighted 3D THRIVE sequence (with enough stacks to cover the entire length of the participants) was completed using the Philips whole-body table extender and resultant images were exported as DICOMs. The DICOMs were processed to segment different tissue volumes using Analyze 11.0 (AnalyzeDirect, BIR Mayo Clinic); abdominal visceral adipose tissue was segmented in axial images spanning the dome of the diaphragm through the pubic symphysis.Results
3D THRIVE images were reformatted to display the whole body (Figures A and B) and the abdomen (red polygon) was defined as the dome of the diaphragm through the pubic symphysis. Axial images within the abdomen (C) were segmented (D) into Visceral Adipose Tissue (VAT, in green), Subcutaneous Adipose Tissue (SAT, in red) and lean tissue (including muscle, organs and bone; in yellow). The reproducibility of these measurements was calculated using the participants imaged twice in one day with repositioning or within a week and resulted in a CV of 4.42% and 0.79% and an R2 of 0.9791 and 0.9986 for VAT and SAT respectively. The DXA VAT measurements were taken from the ‘android’ region (highlighted in red in E) which GE defines as the lower 20% of the distance between the bottom of the skull and the top of the iliac crest. Reproducibility was calculated using participants imaged on consecutive days and resulted in a CV of 2.98% and R2 of 0.9979 for the VAT volume estimate. For participants who received a DXA and an MRI, the VAT calculations were compared, and show loose correlation (F; R2 = 0.7352) and the calculated MR VAT volume was approximately twice the DXA estimate. This correlation was considerably better in males (G, R2 = 0.8602) than females (H, R2 = 0.2500).Discussion
Visceral adipose tissue has been identified as a significant contributing factor to the metabolic complications of obesity (Smith 2001) and cardio metabolic disease (Rothney 2013), thus its precise measurement is becoming more clinically relevant. Previous studies have shown good correlation (r=0.93) between DXA and CT VAT results (Micklesfield, 2012). However, these results compared the CT images to the corresponding android region in the DXA. This suggests that the DXA VAT estimate is an accurate measurement of the VAT in the android region. The MR results reported here span the length of the abdomen, in an attempt to encompass all of the visceral adipose tissue. The MR VAT is measured across a larger body volume than the android region, thus the total VAT measured is greater (~ 2x). However, the distribution of VAT across the entire abdomen is not uniform, which is the likely cause of the poor correlation between the DXA and MR VAT results. The differences in fat distribution between males and females exacerbates the poor correlation in women.Conclusion
The DXA VAT estimate is a precise, reproducible measure of a portion of the visceral adipose tissue, with the advantage of a quick measure of total body composition; and the DXA results are automatically calculated at the time of the scan. MRI provides a more accurate, albeit potentially less precise, measurement of total visceral adiposity, with the ability to simultaneously measure subcutaneous adipose tissue and other tissue depots. Additionally, the MR measurements may be considerably more accurate in females than DXA, justifying any loss of precision. While the post processing of MRI data takes significantly more time than DXA, the MR scan provides absolutely no ionizing radiation. In summary, both DXA and MRI provide a reproducible method to quantify visceral adipose tissue, but MRI does so over the entire abdomen avoiding potential gender bias.Acknowledgements
The work presented in this project was supported by unrestricted funds from the Florida Hospital, part of the Adventist Health System.References
Mellis, M. G., et al., (2014). European Journal of Clinical Nutrition. Micklesfield, L. K. et al., (2012). Obesity (Silver Spring, Md.), 20(5), 1109–1114. Rothney, M. P. et al., (2013). Obesity (Silver Spring, Md.), 21(9), 1798–1802. Smith, S. R. et al.,(2001). Metabolism: Clinical and Experimental, 50(4), 425–435.Figures
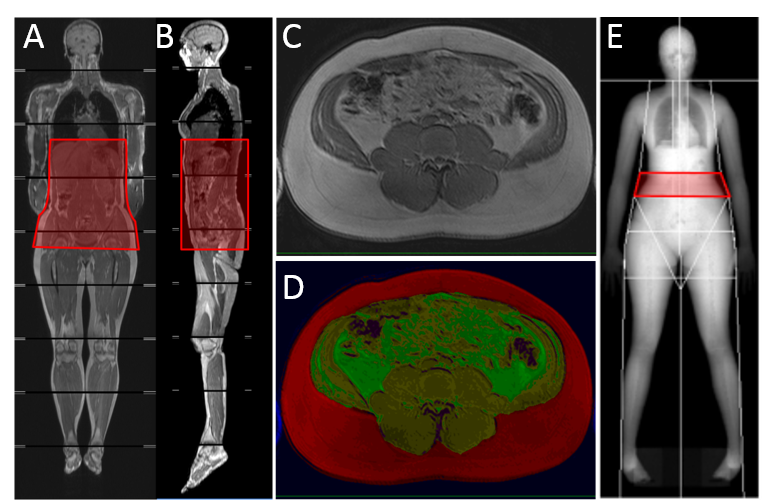
Coronal
(A) and Sagittal
(B)
Reconstruction of whole body MR images; red box indicates measurement area of
Visceral Adipose Tissue (VAT) from the
dome of the diaphragm through the pubic symphysis. A representative MR axial slice before
(C) and after (D) segmentation; Subcutaneous Adipose Tissue (SAT) is
highlighted in red, VAT in green, and lean tissue in yellow. (E) Sample DEXA Image projection, VAT area
estimate (android region) highlighted in red.
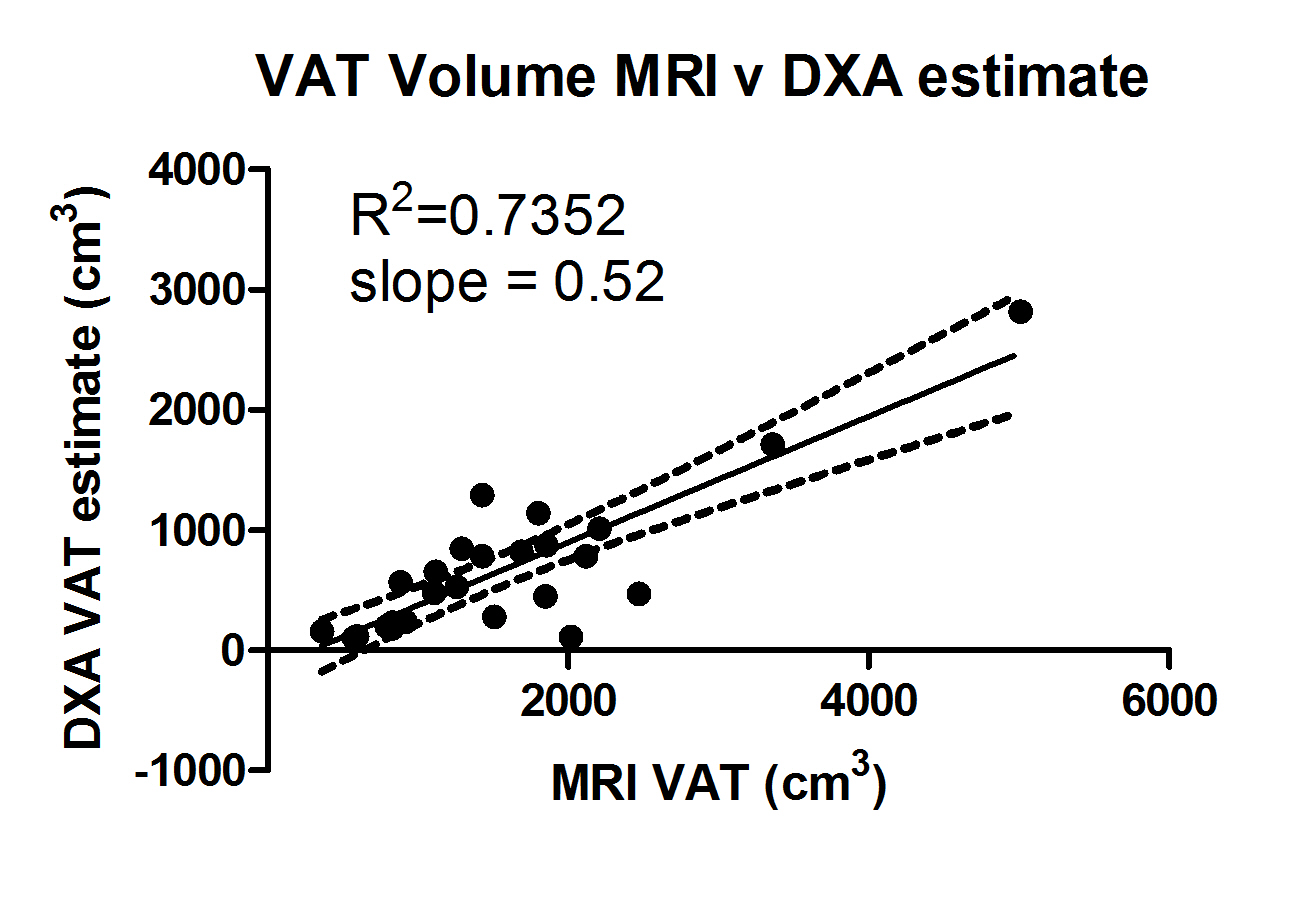
(F) Comparison of VAT Volume measured by MRI vs. DXA.
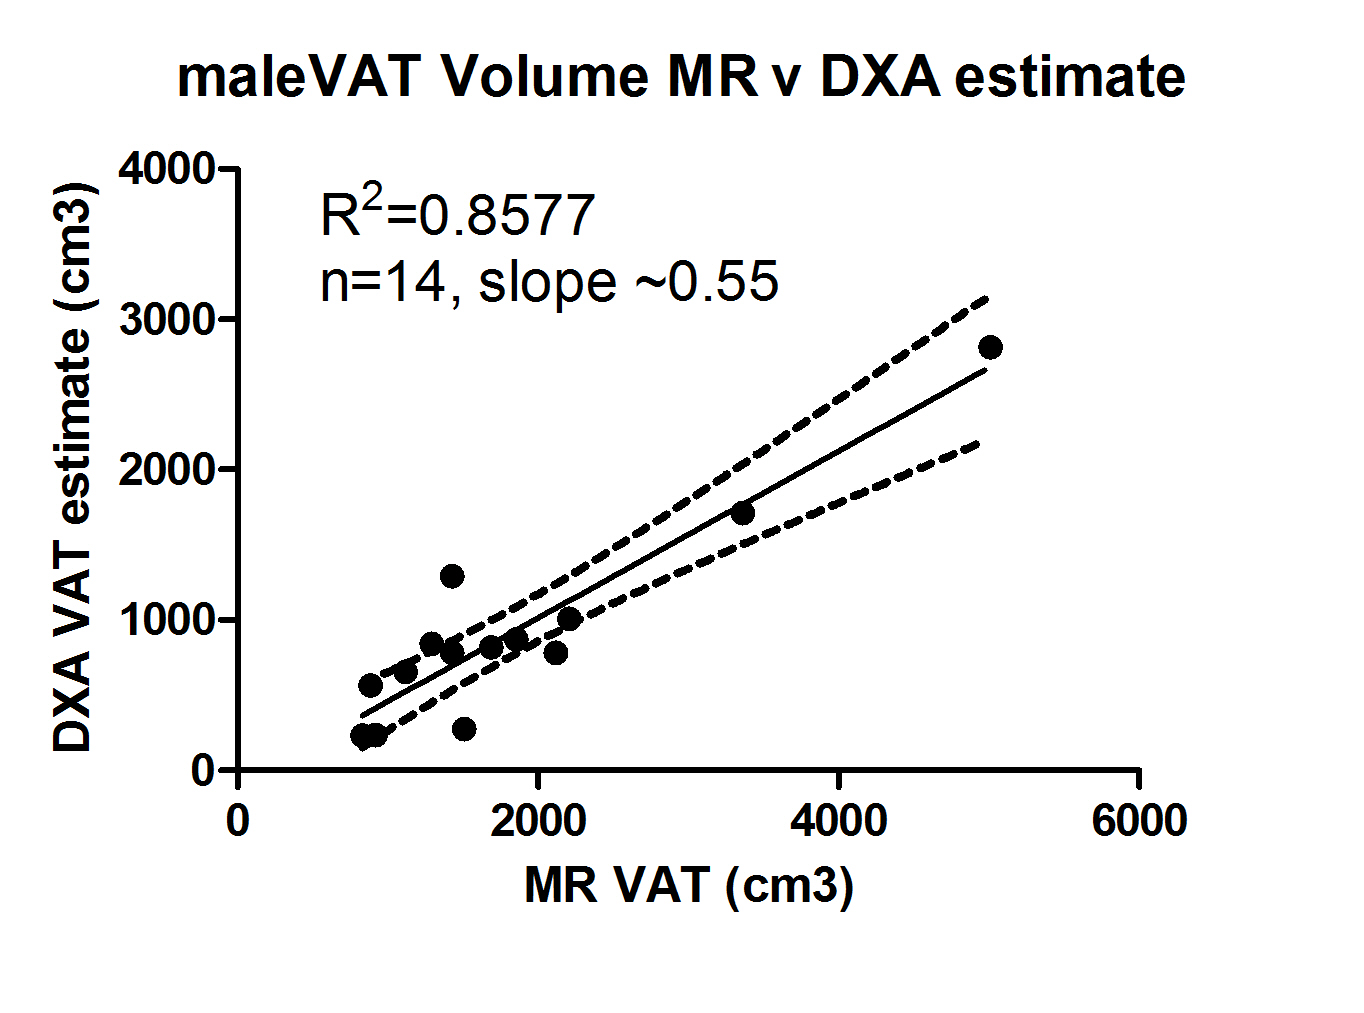
(G) VAT Volume Measurements in Males
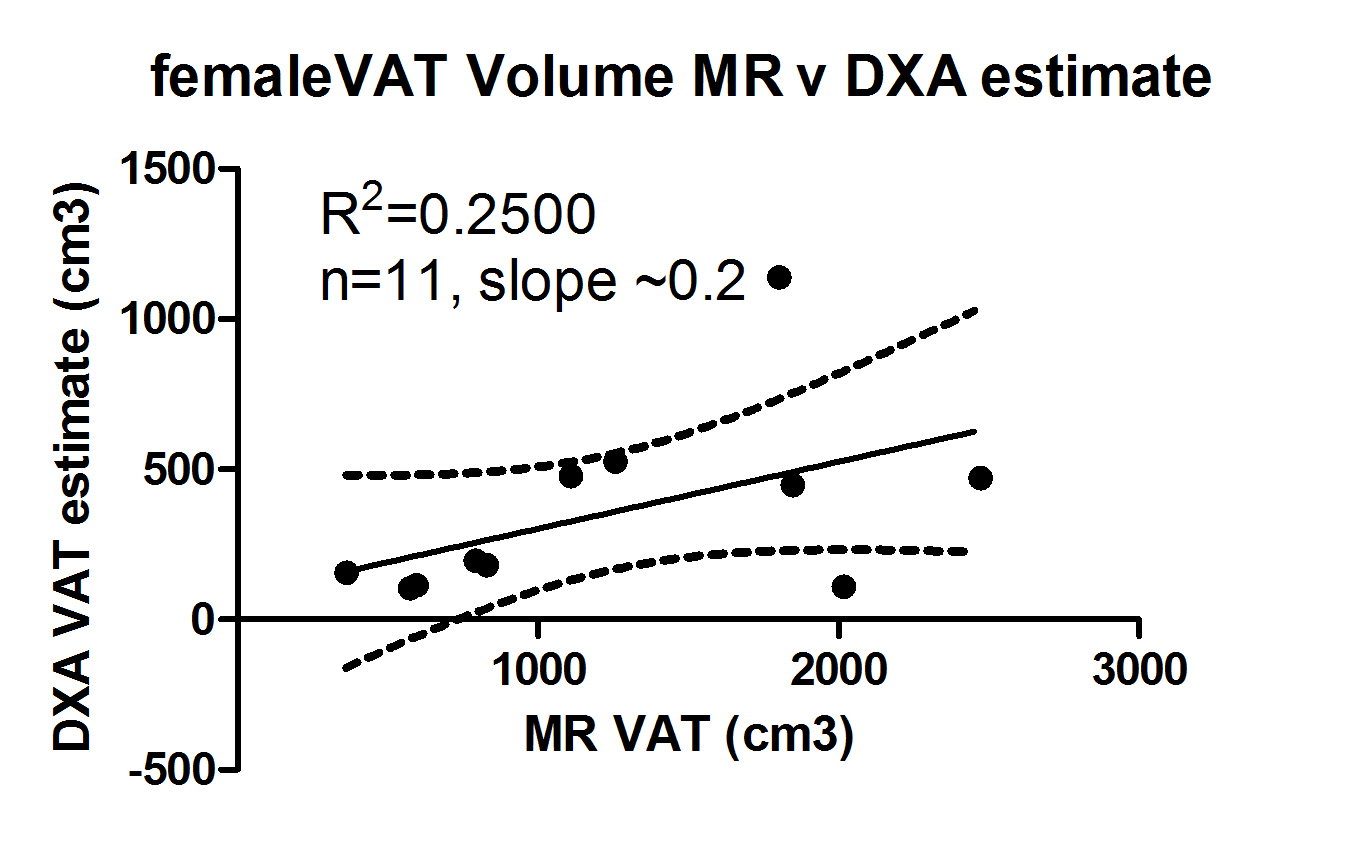
(H) VAT Volume Measurements in Females