4967
Analysis of motility in apparently normal small bowel – relationship to Crohn’s symptoms1Centre for Medical Imaging, University College London (UCL), London, United Kingdom, 2Department of Radiology, Academic Medical Center (AMC), Amsterdam, Netherlands, 3Quantitative Imaging Group, Delft University of Technology, Delft, Netherlands
Synopsis
Crohn’s disease (CD) patients often suffer abdominal symptoms even when their disease is apparently in remission with no identifiable active inflammation.1 Ongoing aberrant gut motility has been postulated as a cause, and this can now be quantified using MRI.2 This study tested the association between abdominal symptoms based on the Harvey-Bradshaw Index (HBI) and MRI derived motility metrics in morphologically healthy small bowel in CD patients. An inverse association was found between reduced motility spatial variation across the small bowel and symptoms, particularly diarrhoea. This association was strongest when HBI scores were higher.
Background
Crohn’s disease (CD) is a lifelong chronic inflammatory bowel disease characterised by periods of disease activity and clinical remission.3 Current treatments are directed at managing inflammatory activity, but even when inflammation is apparently controlled, many patients suffer disabling abdominal symptoms which adversely impact quality of life.1 Symptom burden can be quantified using patient questionnaires such as the Harvey-Bradshaw Index (HBI) which sums components including abdominal pain, impaired feeling of wellbeing and severity of diarrhoea, traditionally defining remission (HBI<5), mild (HBI 5-7), moderate (HBI 8-16) or severe disease activity (HBI>16).4 However it is now recognized that the link between HBI and inflammatory burden is relatively weak, and many patients in remission still have high HBI scores due to ongoing abdominal symptoms. Optic-flow based registration of cine MRI can be used to quantify small bowel motility.5 Recent data in a single site study of 53 patients suggested aberrant motility in apparently healthy bowel may be linked to patient symptom burden in CD.2 The purpose of the current study was to evaluate the proposed association between abdominal symptoms and MRI quantified small bowel motility metrics as part of a prospective large multi-centre patient study (VIGOR++), investigating MRI in patients with a range of CD activity.Methods
Subjects: 93 datasets from the VIGOR++ cohort (n=135) were suitable for analysis (43 male, 50 female, aged 20-71). Patients were recruited from AMC (Amsterdam) and UCL (London).
Scanning: Dynamic “cine motility” MRI following oral mannitol ingestion was performed in CD patients using a Phillips 3T Achieva or 3T Ingenia. Patients completed a HBI symptom questionnaire the day before scanning. Motility was imaged using a cine series of 2D coronal, balanced (BTFE) sequences acquired during breath-holds to cover the whole small bowel volume with parameters: flip angle 60o, TR = 3.8ms, TE = 1.9ms, 1x1mm in-plane resolution, slice thickness 10mm and temporal resolution of 1 frame per second.
Step 1: Generation of the motility index score (MIS) - Frames from a 2D cine sequence were registered using an optic-flow based registration technique providing deformation fields.5 MIS was calculated from the standard deviation of the Jacobian determinant of the deformation fields. This summarises the variations in local expansion and contraction on a per pixel basis and is displayed on a reference frame (figure 1).
Step 2: Motility analysis - Regions of interest (ROIs) were drawn to encompass all morphologically normal small bowel (i.e. explicitly excluding Crohn’s affected bowel based on standard MRI morphological criteria such as bowel wall thickening and hyperenhancement). The 1) mean and 2) variance of the MIS values within the ROIs drawn in all slices of the same subject were used to derive two motility metrics.
The mean metric gives an indication of the overall motility of the bowel with a high value suggesting increased global motility.
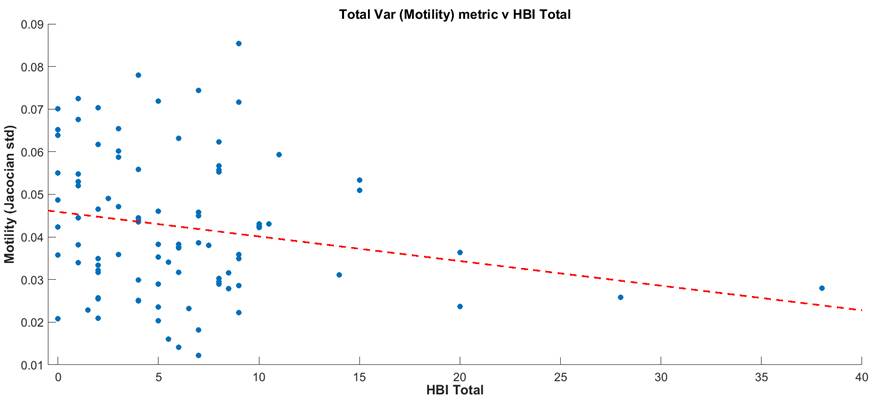
The variance metric gives an indication of the spatial variability of motility e.g. a high variance score corresponds to a wide range of motilities across the small bowel with areas of higher and lower motility. Conversely a low variance score corresponds to more homogenous motility (either high or low).
Correlation was performed between motility metrics and total HBI symptoms using Spearman’s correlation statistics. An additional analysis was restricted to those with a HBI score >10. A HBI score of 10 is the maximum HBI score excluding objective measures such as fever.
Results
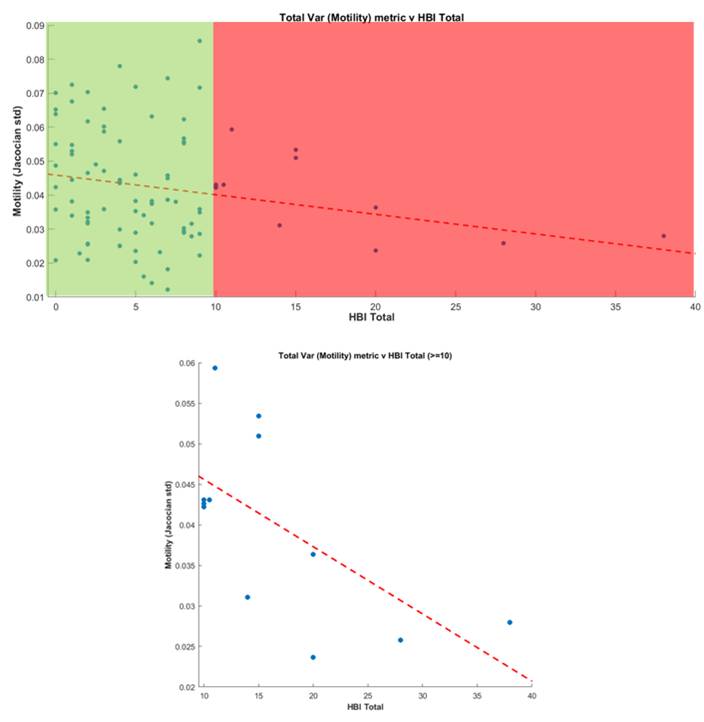
There was a negative correlation between the variance metric and total HBI score (r=-0.20, P=0.05) (figure 2). When a threshold of 10 or above was applied to the HBI score (i.e. high patient symptom load) there was a significant negative correlation between the variance metric and HBI (r=-0.634, P=0.027) (figure 3).
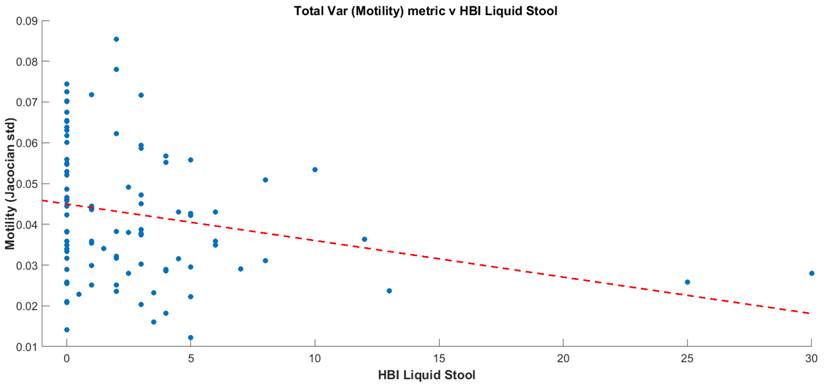
There was also a significant negative correlation between the variance metric and the number of diarrhoeal stools (r=-0.30, P<0.01) (figure 4).
There were no significant correlations between the mean motility metric and HBI scores.
Conclusion and Discussion
Our data suggests an inverse association between global motility variance in apparently normal small bowel and patient symptom burden in CD, but no such correlation between mean global motility and symptoms. A possible explanation is that impaired coordination in the bowel, rather than changes in the absolute level of motility, leads to worsening of patient symptoms, particularly diarrhoea.
Our data suggests the association between impaired motility variation and patient symptoms is strongest at the higher end of HBI scores (i.e. in those with a greater symptom burden). The utility of motility metrics in future mechanistic research may therefore be greatest in patients with moderate and severe abdominal symptoms.
Acknowledgements
This work is supported by the EPSRC-funded UCL Centre for Doctoral Training in Medical Imaging (EP/L016478/1) and the Department of Health’s NIHR-funded Biomedical Research Centre at University College London Hospital.
EU VIGOR++ funding
References
1. Dignass, G. Van Assche, J. O. Lindsay, M. Lémann, J. Söderholm, J. F. Colombel, S. Danese, A. D’Hoore, M. Gassull, F. Gomollón, D. W. Hommes, P. Michetti, C. O’Morain, T. Oresland, A. Windsor, E. F. Stange, and S. P. L. Travis, “The second European evidence-based Consensus on the diagnosis and management of Crohn’s disease: Current management.,” J. Crohns. Colitis, vol. 4, no. 1, pp. 28–62, Mar. 2010.
2. A. Menys, J. Makanyanga, A. Plumb, G. Bhatnagar, D. Atkinson, A. Emmanuel, and S. A. Taylor, “Aberrant Motility in Unaffected Small Bowel is Linked to Inflammatory Burden and Patient Symptoms in Crohn’s Disease.,” Inflamm. Bowel Dis., vol. 22, no. 2, pp. 424–32, Feb. 2016.
3. L. Peyrin-Biroulet, E. V Loftus, J.-F. Colombel, and W. J. Sandborn, “The natural history of adult Crohn’s disease in population-based cohorts.,” Am. J. Gastroenterol., vol. 105, no. 2, pp. 289–97, Mar. 2010.
4. R. Harvey and J. Bradshaw, “A simple index of Crohn’s-disease activity.,” Lancet, vol. 315, no. 8167, p. 514, 1980.
5. F. Odille, A. Menys, A. Ahmed, S. Punwani, S. A. Taylor, and D. Atkinson, “Quantitative assessment of small bowel motility by nonrigid registration of dynamic MR images.,” Magn. Reson. Med., vol. 68, no. 3, pp. 783–93, Sep. 2012.
Figures