4965
To quantitatively investigate the contrast ratio of prostate cancer of computed high diffusion-weighted imaging (DWI) from DWIs acquired from lower b-values and correlation to tumour aggressiveness1DEPARTMENT OF DIAGNOSTIC & INTERVENTIONAL RADIOLOGY, HONG KONG SANATORIUM & HOSPITAL, HONG KONG, Hong Kong
Synopsis
Apparent Diffusion Coefficient (ADC) maps obtained diffusion weighted imaging (DWI) have been shown to detect prostate cancer (PCa) and also correlate with tumor aggressiveness. Recent studies showed that improve detection of prostate cancer by high b-value DWI. However, high b-value images have an inherently low signal-to-noise ratio (SNR) and are prone to increased susceptibility artefact. Computed DWI (cDWI) is a method capable of obtaining high b-value images, which avoids the technical challenges of actually measuring them. Previous studies with limited sample size have evaluated the cDWI with high b-value but results were not conclusive. Current study may give an insight whether high b-value cDWI is valuable for differentiation of high risk versus low risk PCa.
Introduction
Recent studies [1-2] showed that improve detection of prostate cancer (PCa) by high b-value DWI. However, high b-value images have an inherently low signal-to-noise ratio (SNR) and are prone to increased susceptibility artefact. Maas et al. demonstrated that Computed DWI (cDWI) is a method capable of obtaining high b-value images, which avoids the technical challenges of actually measuring them[3]. Limited studies [4] have evaluated the cDWI with high b-value and investigate the correlation of prostate tumour aggressiveness.Purpose
Quantitative evaluation of the contrast ratio (CR) of prostate cancer (PCa) of computed high b-value (1600s/mm2) DWI (cDWI1600) from DWIs acquired from lower b-values and correlation to tumour aggressiveness.Methods
39 consecutive patients (mean age, 67.6years; age range, 39-86 years) with 39 peripheral zone (PZ) prostate cancers (PCa), 11 Gleason score ≤6 (low risk) and 28 Gleason score ≥ 7 (high risk cancer) with biopsy proven peripheral PCa were included. MPMRI with b-values of 0, 400, 800 s/mm2 DW-MR images were acquired using a 1.5T clinical MR scanner (MAGNETOM Aera(®); Siemens Healthcare, Erlangen, Germany); 16-channel phased-array body coil and an endorectal coil ( BPX-15 Medrad, Pittsburgh, PA, USA). T2-weighted and DWI images were acquired at the same orientation and thickness. Regular DWI scan was obtained with (TR=5100 ms; TE=113ms; field of view = 200× 200 mm; slice thickness/gap = 3.0 mm/0.3 mm; acquisition time = 203sec) The ADC map (using b value of 0, 400, 800 s/mm2) and cDWI1600 images were generated ‘inline’ on Siemens MR system (Syngo E11) on voxel basis using monoexponential model. With reference to T2-weighted and ADC map images, circular regions of interest (ROIs) were manually put to the images that displayed the largest PCa dimension and copied to cDWI1600 image and regular counterpart DW images (one for the lesion and one for the healthy counterpart with reference to the report of histopathology). Mean ADC values over the PCa ROI were computed. Contrast Ratio (CR) was analyzed by computing the contrast between PCa and healthy peripheral zone. CR over images was calculated from the following equation: CR = ( IPCa – IPZ ) /( IPCa + IPZ ) where IPCa is the mean intensity of the PCa ROI and IPZ is the mean intensity of the PZ ROI without tumour. The ADC values and contrast ratio of cDWI1600 from normal peripheral and PCa regions from low and high risk PCa compared by using student’s t-test. Diagnostic performance of ADC and CR cDWI1600 for differentiating high risk from low risk PCa were evaluated using receiver-operating-characteristics (ROC) analysis. Pearson Correlation coefficient (r) between ADC values, CR cDWI1600 to Gleason score to analyze any correlation.Results
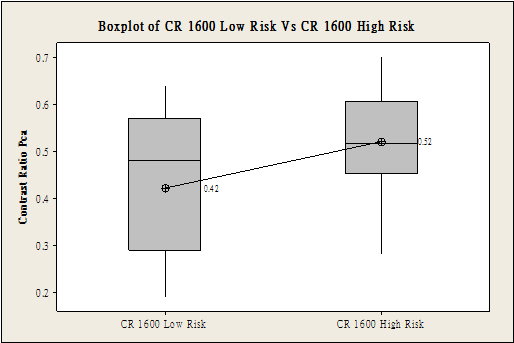
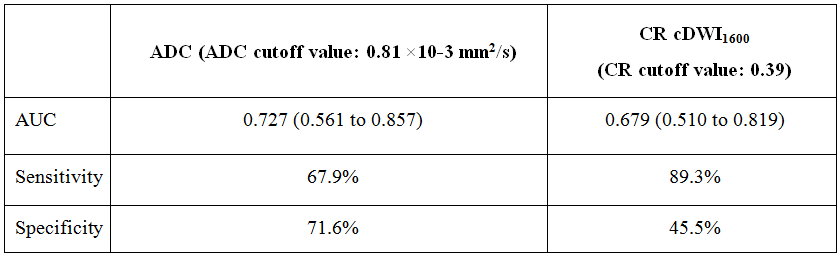
The ADC values between normal PZ and PCa showed significant difference (p<0.01). Mean ADC value of normal PZ (1.88 ± 0.312) ×10-3 mm2/s was significantly (P<0.001) higher than that of PCa (0.79 ± 0.201) ×10-3 mm2/s. Mean ADC value of low risk Pca (0.91 ± 0.224) ×10-3 was significantly (P<0.05) higher than in high risk PCa (0.75 ± 0.176) ×10-3 mm2/s (Figure 2). Mean CR in cDWI1600 (0.49 ± 0.13) image set was significantly (P<0.001) higher than DWI0 (-0.29 ± 0.22), and DWI800 (0.11 ± 0.17) image set. However, no significant difference (P=0.07) was obtained in mean CR in cDWI1600 between low risk PCa (0.42 ± 0.16) and high risk PCa (0.52 ± 0.11) (Figure 3). For differentiating high risk from low risk PCa, ADC showed the higher AUC than CR cDWI1600 (0.727 and 0.679, respectively) but without statistically significant difference (p = 0.704) (Table 1). ROC curves analysis revealed that ADC, at a cut-off value of 0.81 ×10⁻³ mm2/s showed sensitivity of 67.9% and a specificity of 71.6% whereas for CR cDWI1600, at a cut-off value of 0.39 showed sensitivity of 89.3% and a specificity of 45.5% Pearson correlation showed significant (p<0.05) negative correlation (r=-0.388) between Gleason score and ADC values and positive correlation (r=0.21) but without statistical significant (p=0.19).Discussion and Conclusion
Our results concord with the previous studies that the use ADC value for differentiation high risk versus low risk PCa and showed that computed high b-value cDWI1600 is a promising technique in detection of high risk PCa based on the high sensitivity (89.3%). This suggests that ADC and CR cDWI1600 have complementary value in separating PCa into different risk. However, by using CR cDWI1600 independently, we could not demonstrate a diagnostic benefit compared to standard ADC as there is considerable overlap among the low and high risk PCa groups. In conclusion, computed DWI is a potential tool in prostate cancer detection and prostate cancer aggressiveness when combined with standard ADC evaluation.Acknowledgements
No acknowledgement found.References
1. K. Katahira, T. Takahara, T. C. Kwee et al., “Ultra-high-b-value diffusion-weighted MR imaging for the detection of prostate cancer: evaluation in 201 cases with histopathological correlation,. European Radiology, vol. 21, no. 1, pp. 188–196, 2011.
2. Y. Ueno, K. Kitajima, K. Sugimura et al., “Ultra-high b-value diffusion-weighted MRI for the detection of prostate cancer with 3-T MRI,” Journal of Magnetic Resonance Imaging, vol. 38, no. 1, pp. 154–160, 2013
3. M. C. Maas, J. J. F?utterer, and T. W. Scheenen, “Quantitative evaluation of computed high b value diffusion-weighted magnetic resonance imaging of the prostate,” Investigative Radiology, vol. 48, no. 11, pp. 779–786, 2013.
4. Metin et al, “Conspicuity of Peripheral Zone Prostate Cancer on Computed Diffusion-Weighted Imaging: Comparison of cDWI1500, cDWI2000, and cDWI3000,” BioMed Research International, Volume 2014, Article ID 768291, 6 pages.
Figures
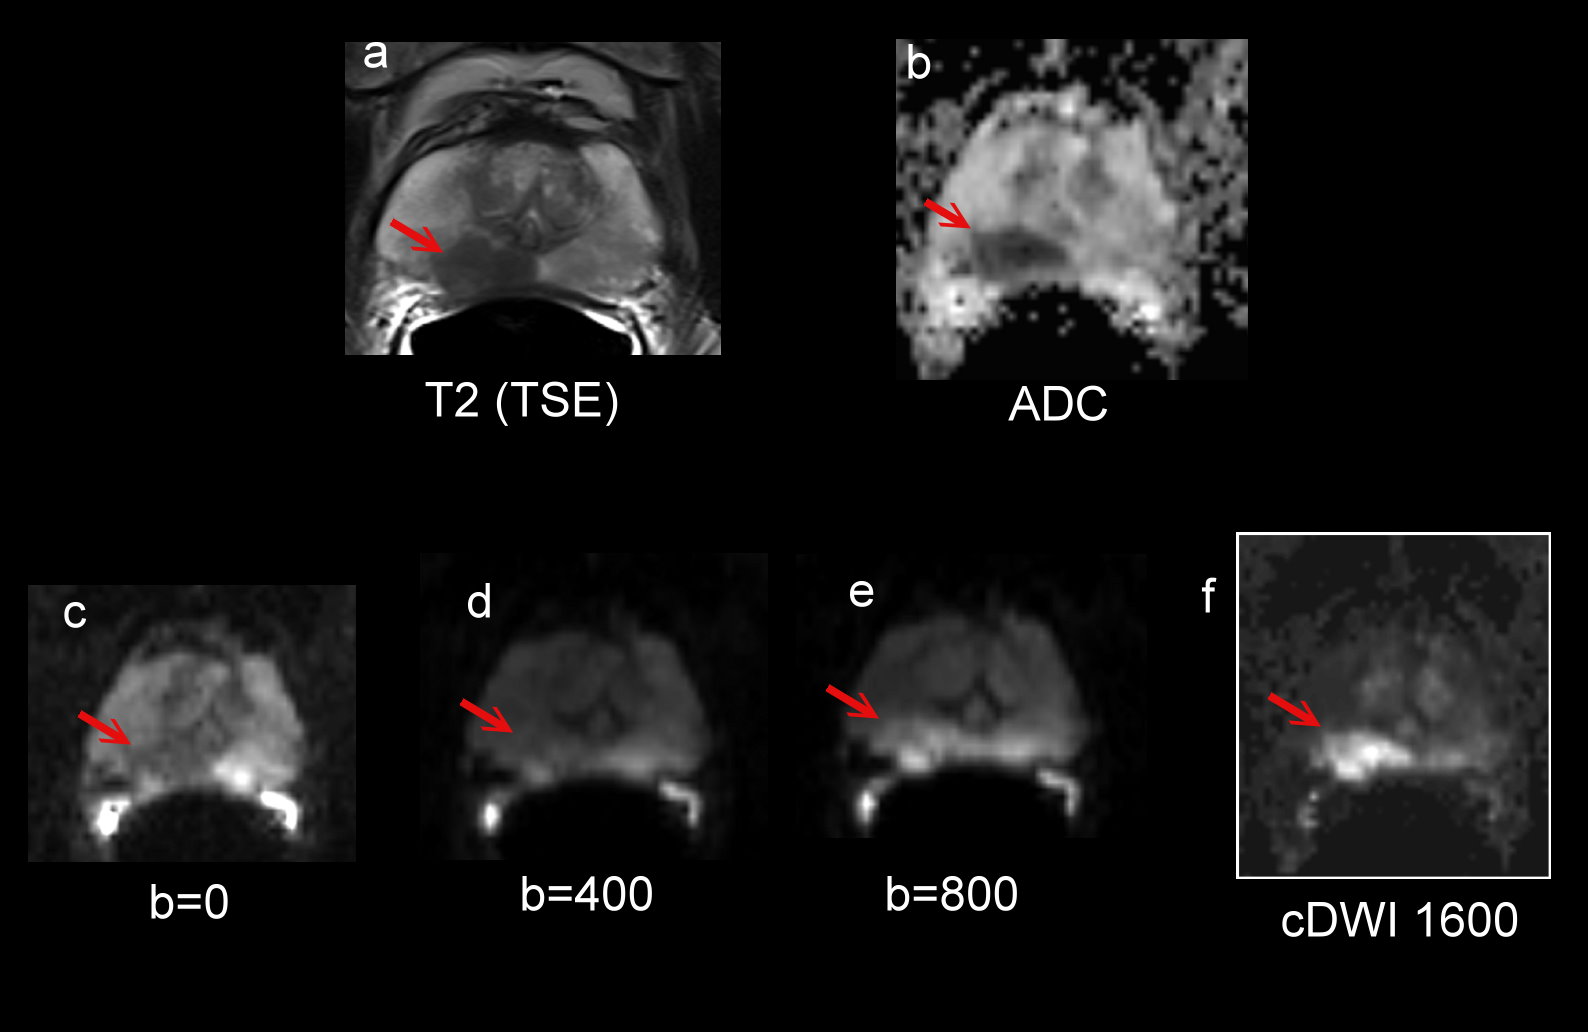
67 year-old gentleman with a PSA level of 9.18ng/mL and a Gleason Score 4+4 Pca,
a. Transverse T2-weighted turbo spin echo MR image shows abnormal hypointense focus was identified in the right peripheral zone (arrow)
b. ADC map with reduced SI, ADC value: 0.59 ×10⁻³ mm2/s.
c-e. Acquired DWI0, DWI400 , DWI800 with contrast ratio -0.4,-0.18 and -0.04 respectively.
f. cDWI1600 with contrast ratio 0.47 (significantly higher than acquired DWI0, DWI400 , DWI800 ).