4964
Texture analysis of prostate MRI by using the Gray-Level Co-Occurrence Matrix (GLCM) for the characterization of prostate cancer, normal prostatic peripheral zone, and transition zone1Radiology, Kyung Hee University Hospital, College of Medicine, Kyung Hee University, Seoul, Korea, Republic of, 2Biomedical Engineering, College of Electronic Information Engineering, Kyung Hee University, Korea, Republic of
Synopsis
GLCM is a mathematical method that extracts the various quantitative parameters representing texture features of the images. Our hypothesis is that the texture analysis of prostate MRI can be an additional problem-solving tool in differentiating cancer and normal prostate tissue. The texture parameters of ROIs in prostate cancer, normal peripheral zone, and normal transitional zone in T2WI were extracted and compared statistically in 20 prostate cancer patients. The correlation, energy, and maximum probability in prostate cancer and peripheral zone are significantly different. The texture analysis can be used for the characterization and differentiation of prostate cancer and normal prostate tissue.
Introduction
Multiparametric prostate MRI is widely used for the detection, staging, treatment planning, and treatment response assessment of prostate cancer. Diffusion-weighted imaging (DWI), and dynamic contrast-enhanced (DCE) MRI are usually used with conventional T1- & T2-weighted imaging (T2WI) and interpreted according to the some kinds of combinations of image findings. However, there are still many limitations in the accurate diagnosis of prostate cancer despite the multiparametric MRI. GLCM is a mathematical method that extracts the various quantitative parameters representing texture features of the images. Our hypothesis is that the texture analysis of prostate MRI can be an additional problem-solving tool in differentiating cancer and normal prostate tissue.Purpose
The purpose of this study is to investigate the texture analysis of T2-weighted images (T2WI) prostate MRI by using the grey-level co-occurrence matrix (GLCM) for the characterization of prostate cancer (PC), normal prostatic peripheral zone (PZ), and transition zone (TZ).Materials & Methods
Twenty consecutive patients who were diagnosed as prostate cancers, underwent prostate MRI after prostate biopsy, and had PI-RADS category 5 cancers according to the PI-RADS system version 2 in MR assessement. One radiologist drew region of interests (ROI) in prostate cancer (PC), normal peripheral zone (PZ), and normal transitional zone (TZ) of prostate gland on a single representative slice of T2WI in each patient. Texture parameters of contrast, correlation, energy, entropy, homogeneity, maximum probability, and variance were extracted in 3 ROIs (PC, PZ, and TZ) in each patient. Texture analysis was done by using the GLCM statistics algorithm. The GLCM texture processing was performed in Matlab tool (MathWorks, Natick, MA, USA). Gleason scores (GS) of biopsy and prostatectomy specimens were reviewed in each patient as well. The comparison of 3 areas (PC, PZ, and TZ) and the correlation between GS and texture parameters were evaluated by using Oneway ANOVA test and Spearman correlation and performed in IBM SPSS ver. 22.
Results
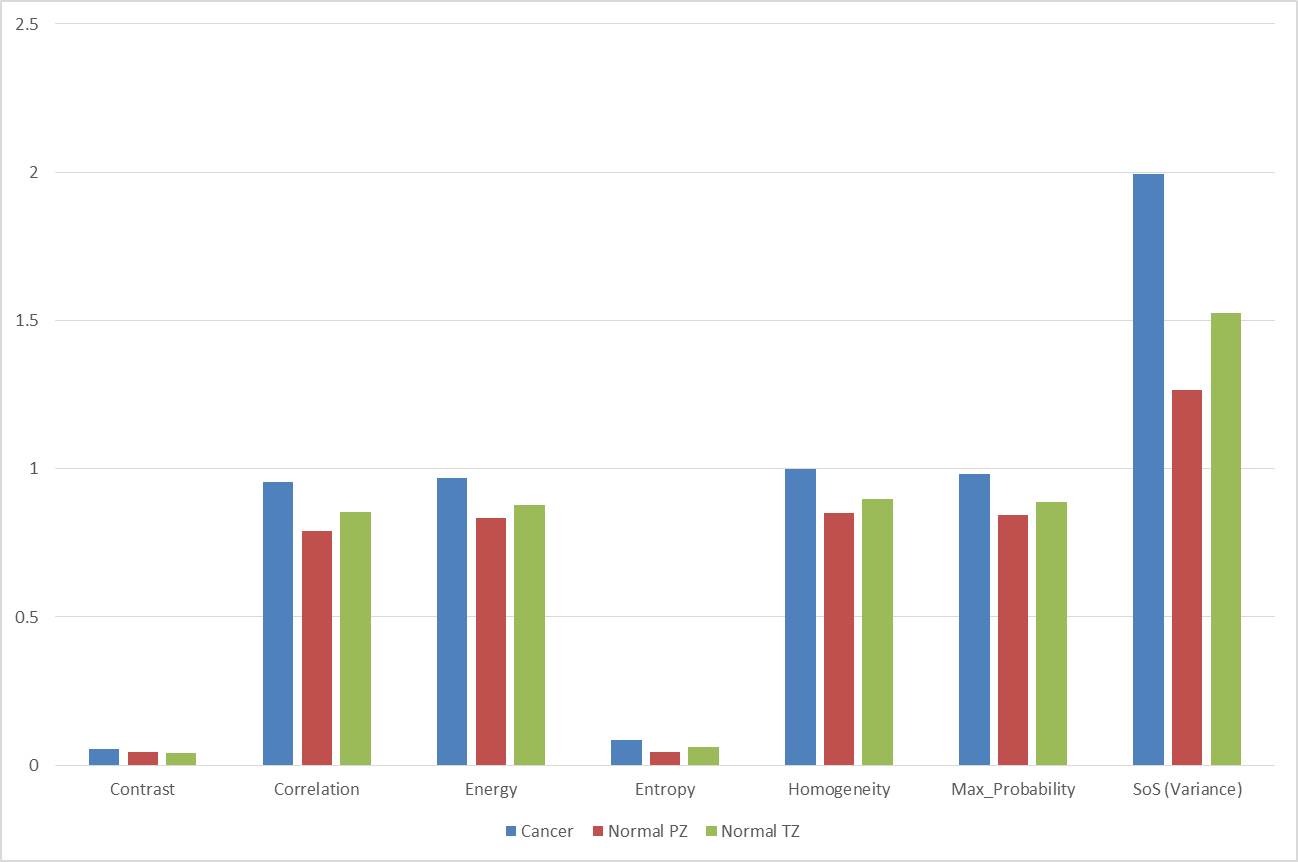
Figure 1. shows the table about the mean values of texture parameters in each ROI zone. There were significant differences of following texture parameters of correlation, energy, and maximum probability among PC, PZ, and TZ. Multiple comparison results showed the significant differences of texture parameters between PC and PZ (p values <0.05). Figure 2 showed the diagrams about the texture parameter values according to the There was no significant difference of texture parameters between PC and TZ. Entropy also showed the difference among 3 areas without statistical significance (p = 0.056). There were no significant correlation between GS and texture parameters of PC (p > 0.05).Discussion
This study showed the differences of texture parameter values among PC, PZ, and TZ on T2WIs. The results showed that texture characteristics of PC and PZ are somewhat different from each other. However, TZ showed no significant differences of texture characteristics from that of PC. This may explain the more difficulties in differentiating PC which are located in TZ than in PZ in daily practice with prostate MRI. There are some limitations in this study. First, the study population was quite small for the statistical analysis. Second, the texture parameters might be affected by the post-biopsy hemorrhage within the prostate cancer. Third, there might be the selection bias of PI-RADS category 5 cases. Forth, only T2WI was used in the texture analysis without DWI or DCE MRI. Lastly, the texture analysis was performed in 2-dimensional methods. 3-dimensional texture analysis with various sequences of multiparametric MRI will be the future study of prostate cancer and multiparametric MRI.
Conclusions
In conclusion, some texture parameters of prostate cancer and peripheral zone are significantly different in T2WI of prostate MRI. The texture analysis by using the grey-level co-occurrence matrix (GLCM) can be used for the characterization and differentiation of prostate cancer (PC), normal prostatic peripheral zone (PZ), and transition zone (TZ).Acknowledgements
This research was supported by the National Research Foundation of Korea (NRF) grand funded by Ministry of Science, ICT, and Future planning (MSIP) of the Korea government (2016R1C1B1013368).References
1. D A. Clausi, Can. J. Remote Sensing, vol. 28, no.1, pp. 45-62, 2002
2. Avinash Uppuluri (2008), GLCM texture features, MATLAB Central File Exchange. Retrived Nov 25, 2008
3. Sidhu HS, Benigno S, Ganeshan B, et al. Eur Radiol. 2016 Sep 12. [Epub ahead of print]
4. Wibmer A1, Hricak H, Gondo T, Matsumoto K, et al. Eur Radiol. 2015 Oct;25(10):2840-50.
Figures
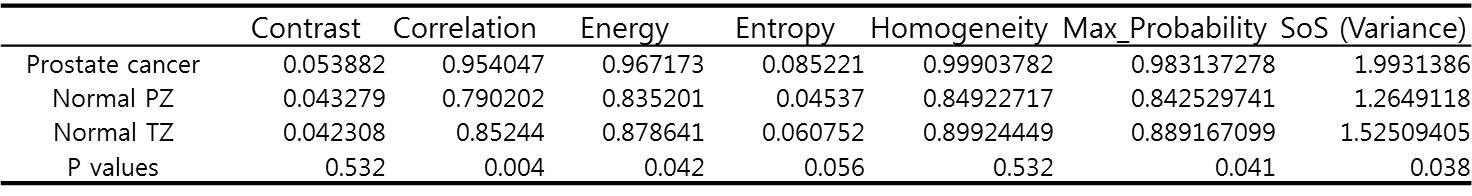
Fig. 1 A table of texture analysis parameters of prostate cancer (PC), normal perpiheral zone (PZ), and normal transitional zone (TZ). There were significant differences of following texture parameters of correlation, energy, and maximum probability among PC, PZ, and TZ. Multiple comparison results showed the significant differences of texture parameters between PC and PZ (p values <0.05).