4954
Contribution of Radiomics Features from DCE-MRI and DWI in Differentiating Benign from Malignant Lesions in Suspicious Breast (MRI BI-RADS Category 4) FindingsBin Hu1, Lina Zhang2, Ke Xv2, Shu Li2, Songbai Li2, Ning Huang3, and Yan Guo3
1First Affiliated hospital of China Medical University, Shenyang, People's Republic of China, 2First Affiliated hospital of China Medical University, 3GE Healthcare, Lifescience, China
Synopsis
We aimed to find a promising tool to improve the diagnostic efficiency of suspious breast lesions classified in BI-RADS Category 4 from malignant lesions in order to avoid unnecessary biopsy,surgery,even psychological pressure. 33 patients (all female, 27y-82y) were included in our retrospective study and all underwent pre-operative breast DCE-MRI and DWI using a 3.0T MRI (SIEMENS Magntom Verio 3.0T).The radiomics features were acquired by Omni-Kinetics software (GE Healthcare).Non-parametric test and ROC curve were used in statistical analysis.The results implied that the radiomics parameters,especially skewness, kurtosis,IDM and inertia in Ktrans and ADC had great potential.
Objective
To differentiate benign from malignant lesions in suspicious breast findings with MRI BI-RADS category 4, using radiomics features extracted from dynamics contrast enhanced MRI (DCEMRI) and apparent diffusion value (ADC).Materials and Methods
This retrospective study was approved by local IRB. 33 patients (all female, 27y-82y, Table 1) were included. All patients underwent pre-operative breast DCE-MRI and DWI using a 3.0T MRI (SIEMENS Magntom Verio 3.0T), and were rated in MRI BI-RADS category 4 of suspicious [1] by 2 experienced radiologists. Among them, 20 were malignant (61%) and 13 were benign (39%), confirmed by biopsy or later by surgery. DWI were acquired first using an EPI sequence with b = 800s/mm2, TR/TE=9300/76ms, matrix 168x168, FOV 32CM, slice thickness 4mm. DCEMRI were acquired with TR/TE 4.67/1.66ms, matrix 384X296, FOV 36CM, slice thickness 2.5mm, with 9 phases, 59 seconds each phase and a total of 541s. 0.1mmol/kg body weight of Gd-DTPA-BMA (Omniscan, GE) was injected after the first phase, at a rate of 3ml/s and followed by 20ml saline flush. Two breast radiologists reviewed the MRI images and defined the 2D ROI at the slice with the maximum diameter of the lesion. Semi-quantitative parameters: AUC, max concentration and max slope were extracted. The Reference-Region model [1][2] which utilized contralateral pectoralis major muscle instead of arterial input function (AIF) was used to calculate kinetic parameter of Ktrans using DCE-MRI. ADC value was extracted from DWI using the mono-exponential model. Mean, median and 66 radiomics features of Ktrans and ADC were generated automatically using Omni-Kinetics software (GE Healthcare). Mann-Whitney U-test and ROC curve were used to assess the diagnostic efficiency of the radiomics features in malignant and benign breast lesionsResults
Kolmogorov-Smirnov test showed that most features were not in normal distribution, so median values were used. Median value of both DCE-MRI and ADC values had no statistical difference between the benign and malignant groups. Skewness, kurtosis and IDM of both Ktrans and ADC were significantly higher, while inertia was significantly lower in malignant group than in benign group (all P<0.05, shown in table 2). Two examples of ktrans color map and histogram were shown in Figure 1. Uniformity and energy of ADC were significantly lower while entropy was higher in malignant group (P<0.05) than in benign group. When Skewness(ADC) ≥0.32, Kurtosis (ADC) ≥2.49, Inertia (ADC) ≤134.43 or IDM (ADC)≥0.10, area under the ROC curve (AUC) to diagnose malignant breast lesions were 0.758, 0.923, 0.938 and 0.946 respectively. Sensitivities were 65.0%, 80.0%, 75% and 85.0% respectively, and specificities were 92.3%, 92.3%, 100% and 100.0% respectively (Figure 2). When Skewness(ktrans) ≥1.81, Kurtosis (ktrans) ≥8.34, Inertia (Ktrans) ≤17.44 or IDM (ktrans)≥0.38, area under the ROC curve (ktrans) to diagnose of malignant breast lesions were 0.755. 0.784, 0799 and 0.821 respectively, sensitivities were 71.4%, 71.4%, 57.1% and 76.2% respectively, and specificities were 84.6%, 92.3%, 100% and 92.3% respectively (Figure 3)Conclusions
Computer extracted radiomics features of DCE-MRI and ADC could effectively differentiate benign from malignant lesions in suspicious breast findings which median or mean values failed. Skewness, kurtosis, inertia and IDM are the most effective radiomics features for both of Ktrans and ADC.Discussion
Breast MRI has been widely applied for clinical diagnosis. Unfortunately the relatively low specificity for diagnosing malignant requires additional examinations including biopsy[3]. Although ADC and ADC ratio were reported as helpful supplementary parameters with complicated and uncertain mechanism [4-9], overlapping values of benign and malignant lesions may still result in uncertainty. ADC values were even reported with no difference in the diagnosis of some special benign diseases [10,11]. In this study, 13 benign breast lesions showed characteristics of malignancy, resulting in suspicious diagnosis of MRI BI-RADS category 4. 10 of the 13 benign lesions were pathologically confirmed as fibrocystic disease in which benign proliferation is mainly involved. The median ADC value is higher in the benign group as reported [4-9], but without statistical difference. Woodhams et. al. revealed that ADC values could be affected by tumor cellularity, size, distribution and tissue component. The major factor for overestimation of cancer is benign proliferative change [12]. The pathology of the benign group in our study may cause the failure of ADC. Meanwhile radiomics features demonstrated great differentiation values. The internal heterogeneity of tumor revealed by histogram and texture features correlated well with the aggravation of breast disease, while median value could only reflect the tumor as a whole. These radiomics features showed good differential diagnosis values. In our future study, radiomics features will be used to correlate with breast cancer molecular subtypes.Acknowledgements
No acknowledgement found.References
[1] Morris EA, Comstock CE, Lee CH, et al ACR BI-RADS ATLAS Magnetic Resonance Imaging. In: ACR BI-RADS ATLAS, Breast Imaging Reporting and Data System. Reston, VA, American College of Radiology; 2013 [2]Yankeelov TE, Cron GO, Addison C. Magn Reson Med 2007;57(2):353–361. [3] Cárdenas-Rodríguez J, Howison C.M., and Pagel M.D. Magnetic Resonance Imaging 2013: 31(4) 497-507 [4] DeMartini W, Lehman C. A review of current evidence-based clinical applications for breast magnetic resonance imaging. Top Magn Reson Imaging 2008;19:143–150 [5] Wenkel E, Geppert C, Schulz-Wendtland R et al (2007) Diffusion weighted imaging in breast MRI: comparison of two different pulse sequences. Acad Radiol 14:1077–1083 [6] Yankeelov TE, Lepage M, Chakravarthy A et al (2007) Integration of quantitative DCE-MRI and ADC mapping to monitor treatment response in human breast cancer: initial results. Magn Reson Imaging 25:1–13 [7] Marini C, Iacconi C, Giannelli M et al (2007) Quantitative diffusion-weighted MR imaging in the differential diagnosis of breast lesion. Eur Radiol 17:2646–2655 [8] Kuroki-Suzuki S, Kuroki Y, Nasu K et al (2007) Detecting breast cancer with non-contrast MR imaging: combining diffusion-weighted and STIR imaging. Magn Reson Med 6:21–27 [9] Hatakenaka M, Sodea H, Yabuuchi H et al (2008) Apparent diffusion coef?cients of breast tumors: clinical application. Magn Reson Med Sci 7:23–29 [10] Guo Y, Cai YQ, Cai ZL et al (2002) Differentiation of clinically benign and malignant breast lesions using diffusion-weighted imaging. J Magn Reson Imaging 16:172–178 [11] Aslan H, Pourbagher A, Colakoglu T (2015) Idiopathic granulomatous mastitis: magnetic resonance imaging ?ndings with diffusion MRI. Acta Radiol. Oct 26 [12] Ravza Y, Ali AD, Atilla K et al (2016) Magnetic resonance imaging features of idiopathic granulomatous mastitis: is there any contribution of diffusion-weighted imaging in the differential diagnosis? Radiol med 121:857–866 [13]Reiko W, Keiji M, Keiichi I et.al (2005)Diffusion-Weighted Imaging of Malignant Breast Tumors.J Comput Assist Tomogr 29:644–649Figures
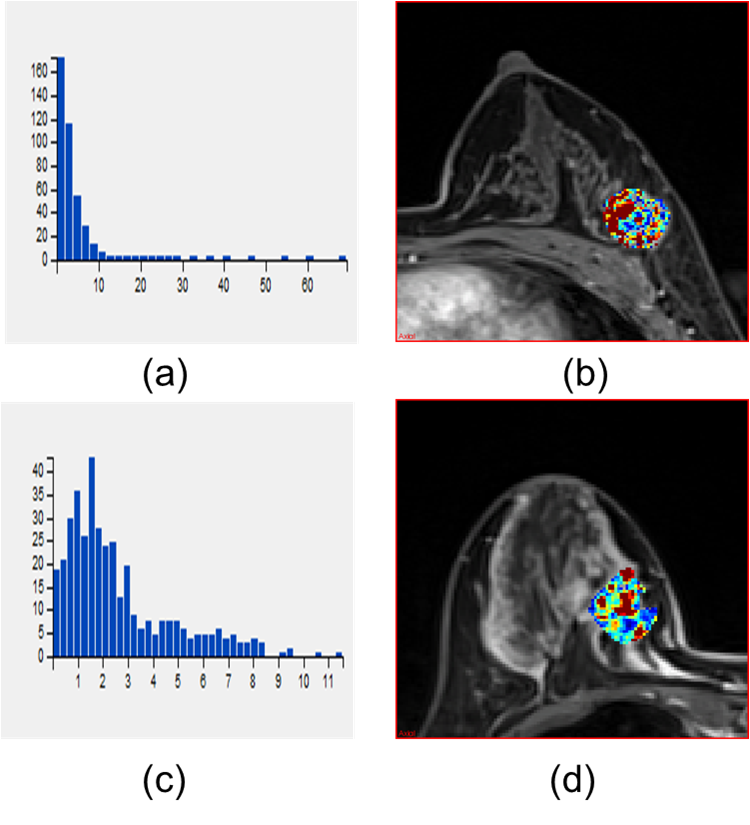
Figure 1: (a)
and (b) were Ktrans histogram and the corresponding
color map of one malignant lesion, median value=2.95 min-1, mean value=3.05 min-1,
skewness=5.20, kurtosis=38.63, IDM=0.60. (c) and (d) were Ktrans
histogram and the corresponding color map of one benign lesion, median
value=2.30 min-1, mean value=2.96 min-1, skewness=1.46,
kurtosis=5.26, IDM=0.27
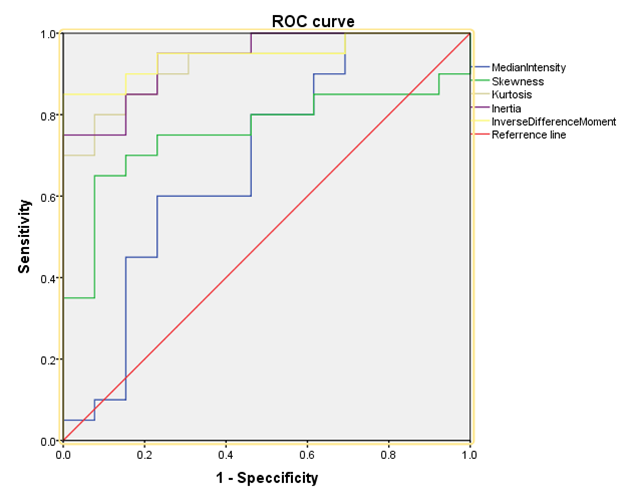
Figure 2: ROC analysis using
Skewness, Kurtosis, Inertia, IDM
and median value from ADC. AUC were 0.758. 0.923, 0.946, 0.938 and 0.685,
respectively
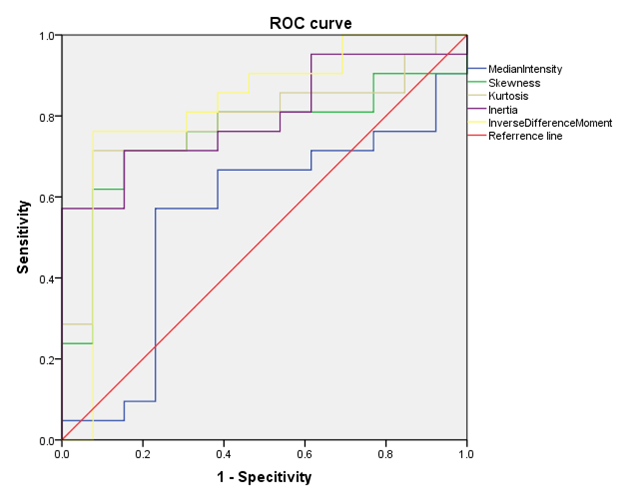
Figure 3: ROC analysis using
Skewness, Kurtosis, Inertia, IDM
and median value from Ktrans. AUC were 0.755. 0.784, 0.799, 0.822 and
0.553, respectively
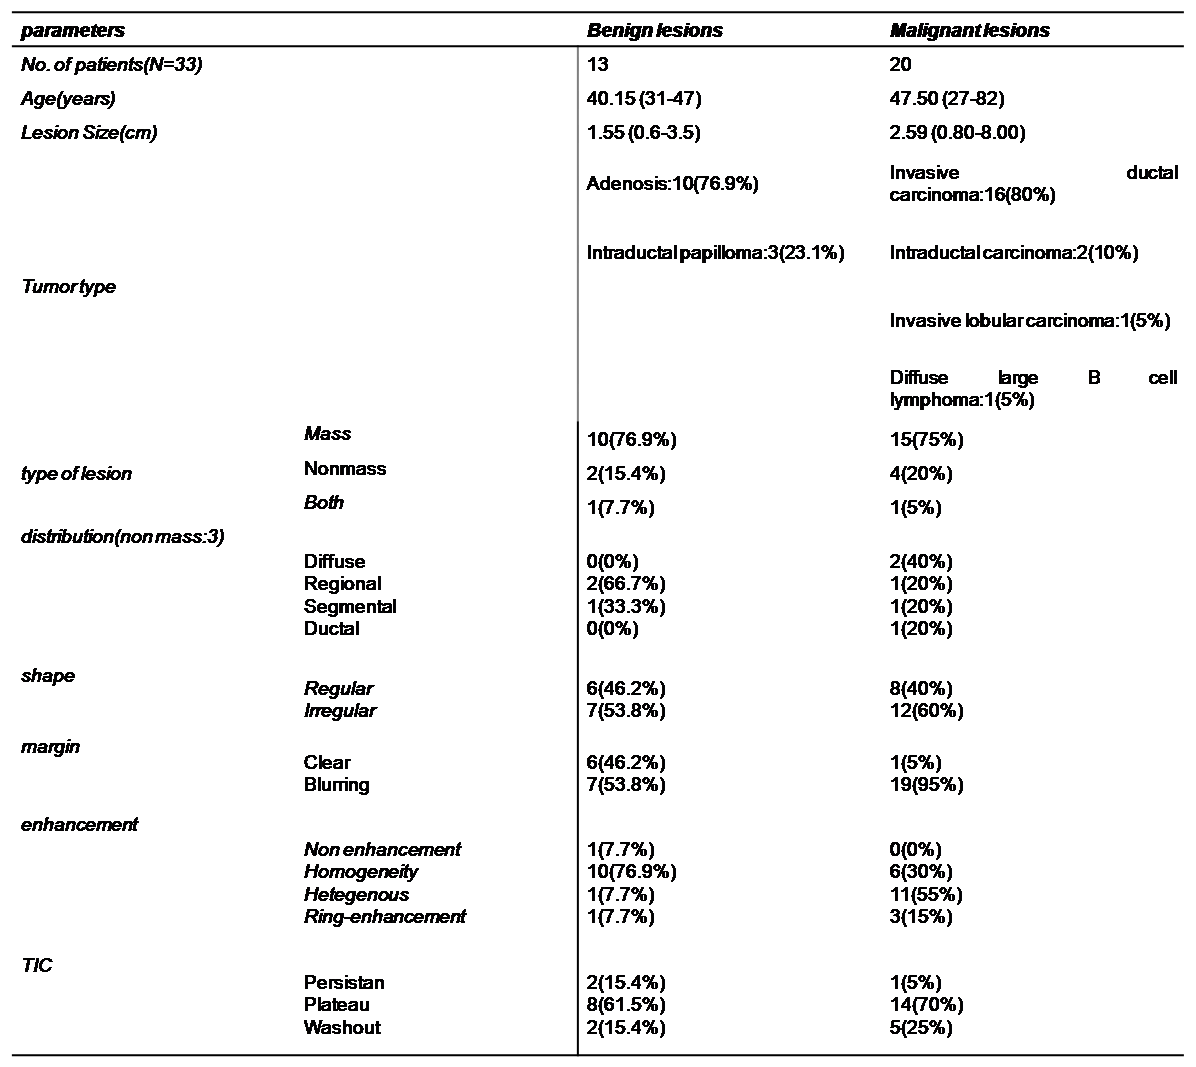
Table
1. Baseline characteristic of patients
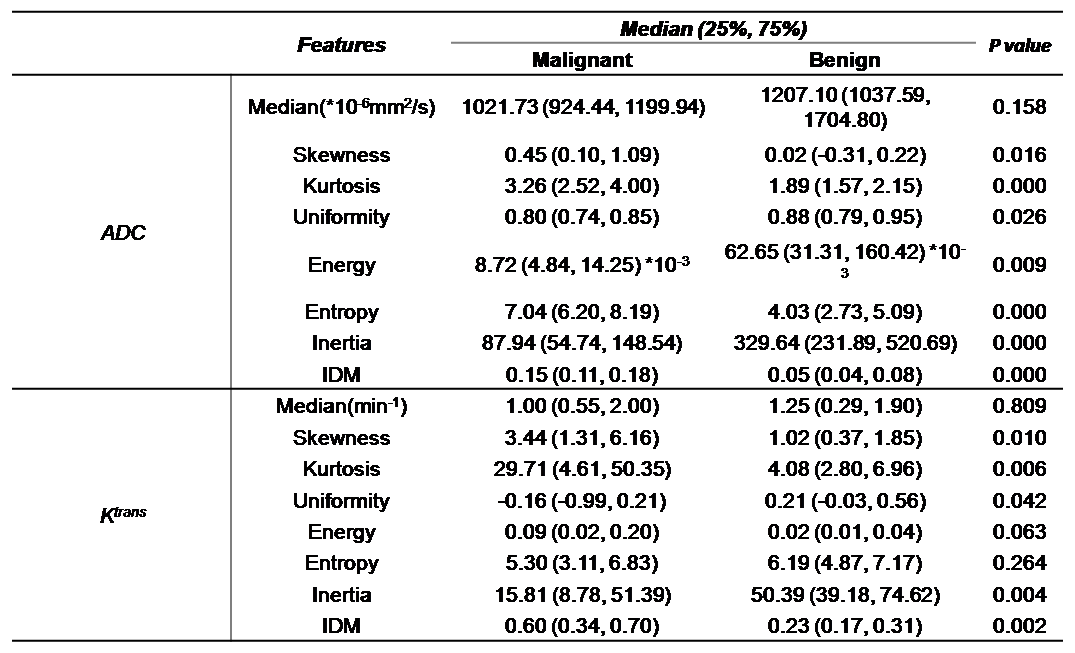
Table 2. Selected radiomics
features of ADC and Ktrans