4953
A New Multi-Atlas Selection Strategy for Zone Segmentation of the Prostate1Translational Imaging Group, CMIC, University College London, London, United Kingdom, 2Academic Radiology, University College London Centre for Medical Imaging, London, UK, 3Dementia Research Centre, Department of Neurodegenerative Disease, UCL Institute of Neurology, London, UK
Synopsis
Automatic segmentation of the prostate into peripheral and transition zones is paramount in developing computer aided diagnosis systems for prostate cancer diagnosis, as cancer behaves differently in each zone. We propose a multi-atlas based segmentation (MAS) algorithm characterized by a new atlas selection strategy: the performance of a subset of atlases is evaluated considering how well that subset segments the image that is most similar to the target image. Comparison of our method with three other MAS algorithms on fifty-five patients shows a statistically significant improvement on the segmentation accuracy.
Introduction
Multi-parametric magnetic resonance (mpMRI) has been shown to be effective in prostate cancer detection1, but interpretation requires a high level of expertise and time. The prostate consists mainly of two anatomical zones: peripheral (PZ) and transition zones (TZ). Cancers behave differently for different zones, thus, segmenting and characterising these regions is paramount. Multi-Atlas based Segmentation (MAS) algorithms have been successfully applied to many medical image segmentation tasks2-4, but success relies on a large number of atlases and good image registration performance. Due to anatomical and pathological variability of the prostate, choosing well-registered atlases for label fusion is crucial for an accurate segmentation. We propose a MAS based on a new similarity-based atlases selection strategy (SAS-MAS) that automatically chooses a subset of the full atlas database using a surrogate image similarity metric computed against the most similar (intensity-wise) propagated atlas, thus estimating a well-registered subject-specific atlas subset.Methods
Let I be the image to be segmented each one composed by an image and a manual segmentation of the TZ and PZ regions. The idea is to estimate the performance of a subset of all atlases (SA) by evaluating how well this subset segments the atlas that is most similar to I, under the assumption that this atlas is a good surrogate of the target appearance. To this end, all atlas images were first affinely (using a block matching approach) and then non-rigidly registered (cubic B-spline non-rigid registration) using NiftiReg5. The similarity between each registered atlas image and I is then calculated as the GLNCC, defined here as the global mean of the voxel-wise local normalized correlation coefficient (LNCC)6. Second, atlas images are sorted according to the GLNCC and the most similar atlas (denoted BA) is used as the pseudo-target image. The remaining atlases are added sequentially, in order of GLNCC, to the subset SA and fused according to a weighted voting strategy where each atlas is locally weighted by the LNCC between each atlas and BA. The Dice overlap metric between the segmentation of the fused subset SA and the BA segmentation is estimated for each subset SA. The subset SA with the highest Dice score is chosen as the optimal subset to segment the target image I. Finally, BA is added to SA, producing the final subset. The subset SA is then fused using a voting strategy weighted by the LNCC between each atlas and I.Results
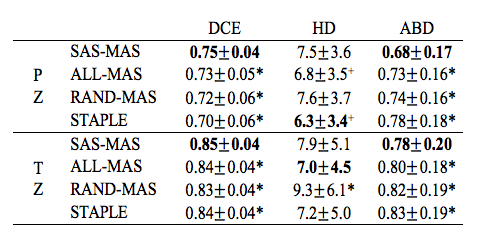
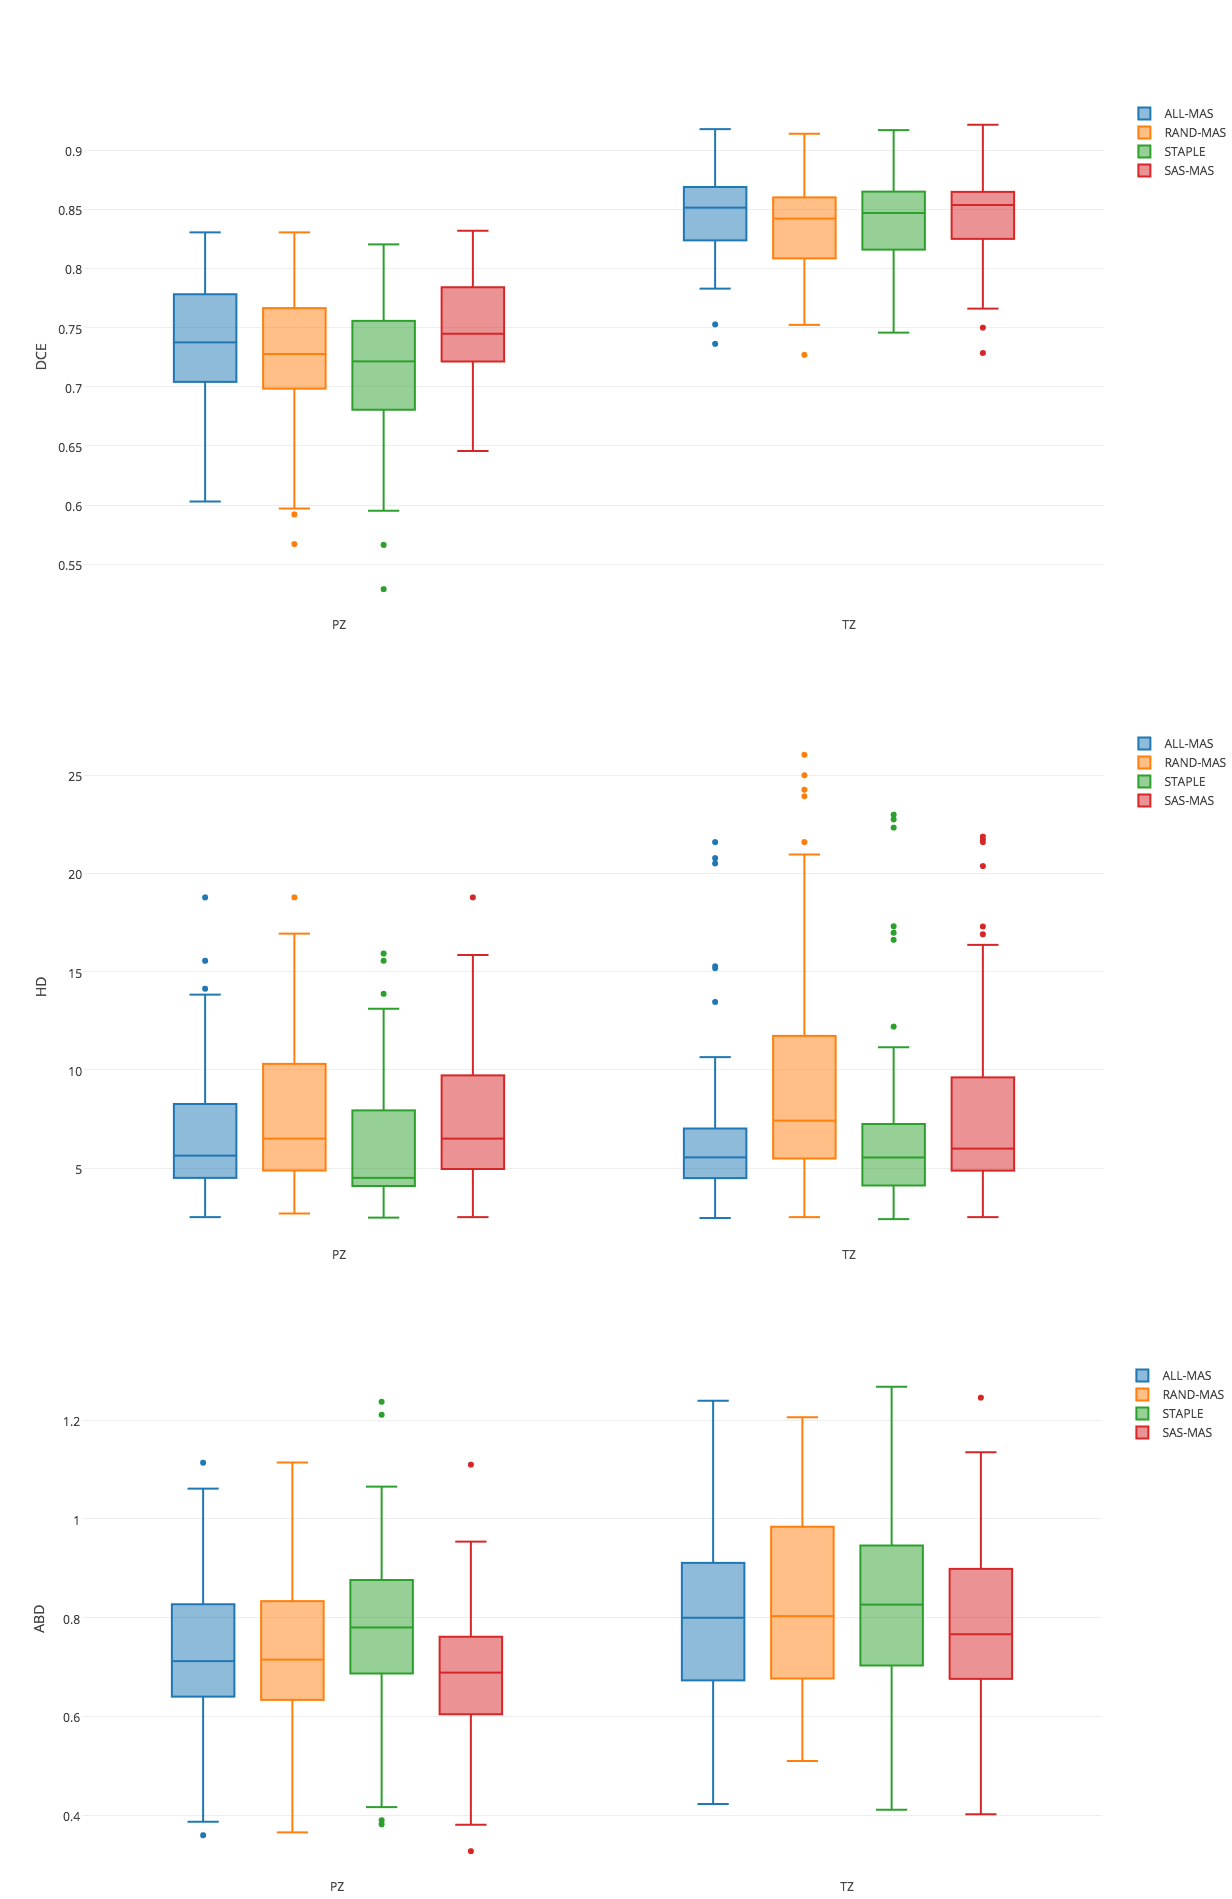
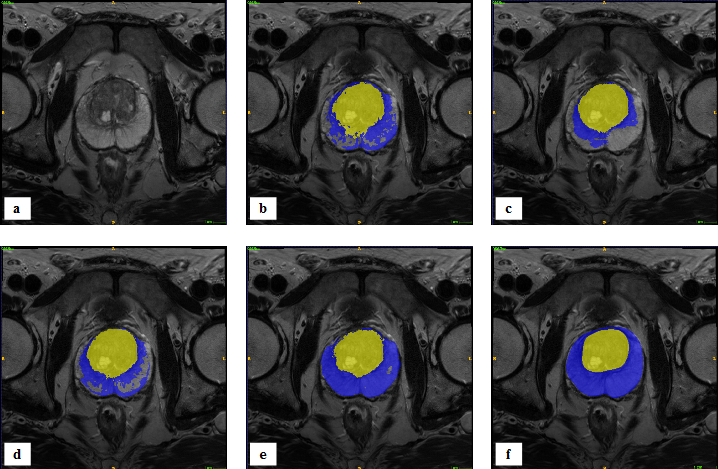
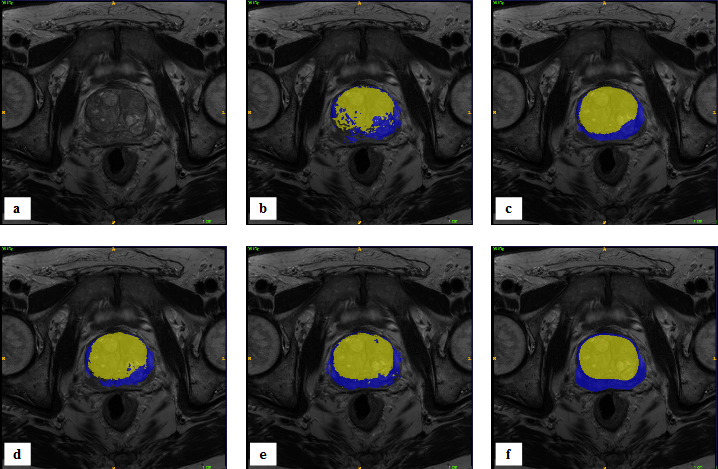
SAS-MAS was tested on T2-weighted scans from fifty-five patients, acquired on a 3T MRI scanner. The manual segmentation of PZ and TZ provided by an expert radiologist was used as the ground truth. The automatic segmentation performance was evaluated using the Dice coefficient (DSC), the Hausdorff Distance (HD)7 and the average boundary distance (ABD)7. The results of SAS-MAS were compared with two MAS algorithms, each characterised by a different atlas selection strategy. Namely, a MAS that uses all the available atlases (ALL-MAS), and a MAS that uses a number of atlases equal to the one used by SAS-MAS but where the atlases are randomly selected (RAND-MAS). Finally, we compare the performance of SAS-MAS against the standard STAPLE algorithm8. Table 1 shows the mean and the standard deviation of DSC, HD, and ABD for the four algorithms and Fig.1 the corresponding box-plot. Both Tab. 1 and Fig. 1 demonstrates that SAS-MAS generates more accurate segmentations for the two prostate zones. To statistically validate this result, and due to the non-Gaussian nature of the errors, the Wilcoxon signed-rank test for pairwise comparison was applied, considering SAS-MAS as the control algorithm. Table 2 shows the results of the test, where the null hypothesis is rejected for almost all the comparisons; only ALL-MAS obtains a better HD on the PZ segmentation. We can thus conclude that SAS-MAS generates significantly more accurate segmentations than those generated by ALL-MAS, RAND-MAS and STAPLE. Finally, Fig. 2 and Fig. 3 show some visual examples of segmentations obtained by the four algorithms.Discussion and Conclusion
In this paper we have presented a MAS algorithm characterised by a new atlas selection strategy. The results show that the new selection strategy improves the performance of MAS, and produces a statistically better segmentation than all the other MAS algorithms. Such algorithms harbour potential value for computer-assisted prostate cancer diagnosis in the future, which could be used to meet the current rise in demand that prostate MRI is experiencing. Future work will involve using this segmentation for diagnosis and prognosis of cancer in prostate applications.Acknowledgements
Funding for this work was received from the EPSRC, the National Institute for Health Research University College London Hospitals Biomedical Research Centre (BRC) and by the Comprehensive Cancer Imaging Centre (CCIC).
References
1. Prostate cancer: diagnosis and treatment. NICE clinical guideline 175, January 2014.
2. Klein S, van der Heide UA, Lips IM, van Vulpen M, et al. Automatic segmentation of the prostate in 3D MR images by atlas matching using localized mutual information. Medical Physics. 2008;35:1407-1417.
3. Langerak TR, Berendse FF, van der Heid UA, Kotte AN, Pluim JP. Multiatlas-based segmentation with preregistration atlas selection. Medical Physics. 2013;40(091701):1-8.
4. Aljabar P, Heckemann RA, Hammers A, Hajnal JV, Rueckert D. Multi-atlas based segmentation of brain images: Atlas selection and its effect on accuracy. NeuroImage:2009;46(3):726 - 738.
5. Modat M, Ridgway GR, Taylor ZA et al. Fast free-form deformation using graphics processing units. Comput Methods Prog Biomed. 2010;98:278–84.
6. Cachier P, Bardinet E, Dormont D, Pennec X, Ayache N, Iconic feature based nonrigid registration: the PASHA algorithm. Comput Vis Image Underst. 2003;89:272–298.
7. Heimann T, et. al. Comparison and evaluation of methods for liver segmentation from CT datasets. IEEE Trans Med Imaging. 2009;28(8):1251-1265.
8. Warfield S.K, Zou KH, Wells WM. Simultaneous truth and performance level estimation (STAPLE): an algorithm for the validation of image segmentation. IEEE Trans Med Imaging. 2004;23(7):903-921.
Figures