4952
Automatic Segmentation and Tracking of Tumor Associated Vasculature Using High-temporal Resolution Dynamic Contrast Enhanced MRI of the Breast: Preliminary Results1Department of Biomedical Engineering, The University of Texas at Austin, Austin, TX, United States, 2Department of Radiology, The University of Chicago
Synopsis
We present a post-processing analysis of high-temporal resolution dynamic contrast enhanced MRI (DCE-MRI) data to automatically detect, segment, and track tumor associated vasculature within the breast. We hypothesize that such an analysis will be useful in both the diagnostic and prognostic settings.
Purpose:
It is well established that dynamic contrast enhanced MRI (DCE-MRI) provides important information regarding the characterization of tissue perfusion, capillary permeability, and lesion morphology. In clinical practice, both qualitative (e.g., BIRADS1) and semi-quantitative approaches (e.g., Kuhl classifications2, 3, 4) are used to diagnose breast cancers. Emphasis is placed on collecting DCE-MRI data at very high spatial resolution thereby necessitating low temporal resolution (e.g., 60-120 sec) and precluding accurate quantification of pharmacokinetic parameters that reflect blood flow and capillary permeability, and these are important markers for angiogenesis associated with aggressive cancers. Our team has been investigating the advantages of high temporal resolution (2 sec) DCE-MRI. One application of such data is to employ the resulting signal intensity time courses to first identify vessels and then determine their “connectivity” by utilizing established techniques from functional MRI. The overall goal of this project is to employ correlation analysis applied to the DCE-MRI signal intensity time courses associated with individual voxels to automatically detect, segment, and track tumor associated vasculature.Methods:
Data Acquisition
Images were acquired on a Philips Achieva 3T-TX with a 16-channel bilateral breast coil and a protocol consisting of 21 fat-suppressed fast acquisitions after the injection of contrast media (0.1 mM/kg MultiHance) followed by five fat-suppressed "standard" acquisitions. Temporal resolution for the fast scans was 1.8 s, with spatial resolution of 1.5×1.5×4 mm3 with a SENSE factor of 4 in the right-left direction, and partial Fourier factor of 0.7 (in both ky and kz). Temporal resolution of the standard protocol was 55 s and spatial resolution of 0.8×0.8×1.6 mm3, SENSE of 2.5 in RL and partial Fourier of 0.85 in ky.
Data Analysis
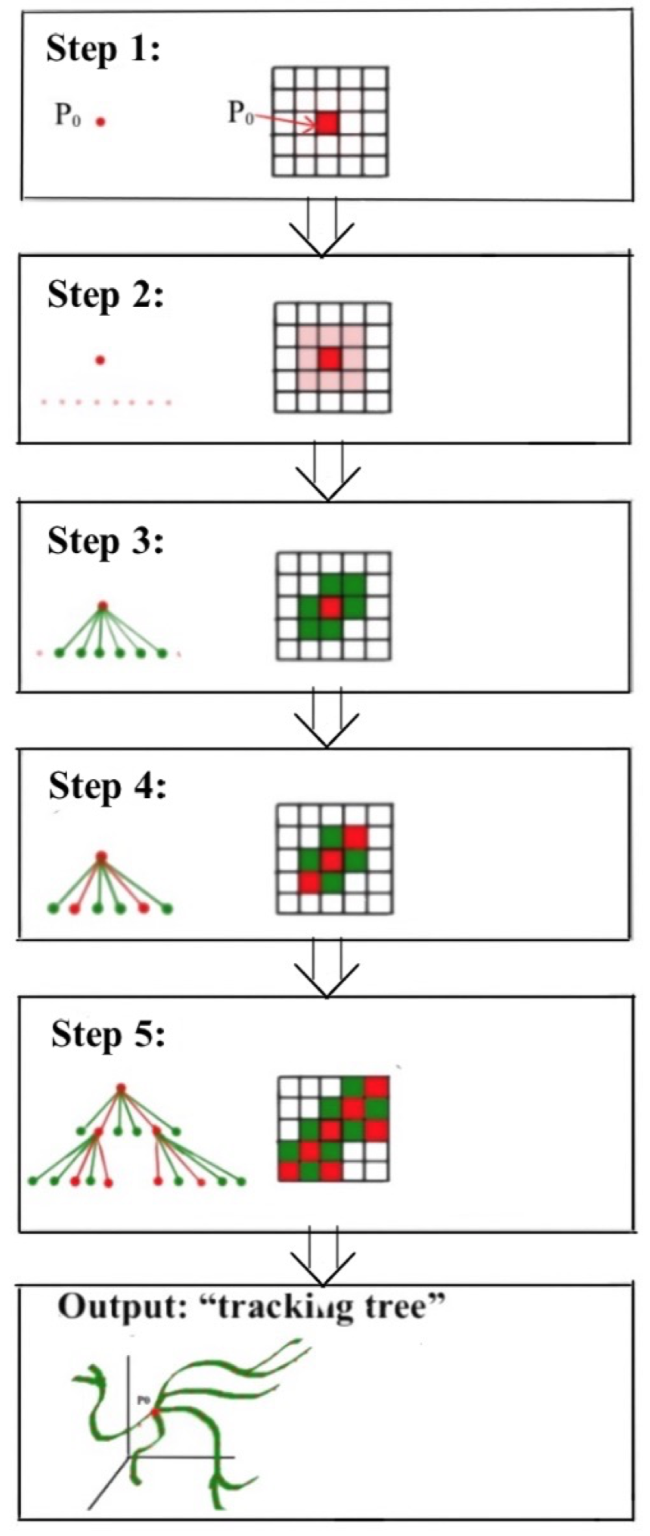
The tracking process is conducted within the set of voxels that show a signal intensity increase larger than 5× the standard deviation of the pre-contrast images. A seed voxel (P0, see Step 1 of Figure 1) is then selected by randomly selecting a voxel within the manually defined lesion, and the signal intensity time course for this voxel is correlated with the signal intensity time courses from the immediately adjacent 26 voxels (in 3D; Step 2). Voxels which show a significant correlation (i.e., p < 5 × 10⁻⁴) are recognized as “connected” to P0 and added to the “tracking tree” (Step 3). The voxels within the tracking tree that are furthest from P0 are then assigned as new seed voxels for determining the next branching components of the tree (Step 4). The process is then repeated for the entire region of interest (Step 5) to yield the entire tracking tree which is the segmentation of a single path from seed voxel to the termination point.
After the vessels are segmented and tracked, we then determine the arrival time of the contrast agent at each voxel and color code the tracked vessels according this value to indicate which voxels in the vessel tree are enhanced first and last. Finally, we visualized the tracked vessels by overlying them on a maximum intensity projection (MIP) and reconstructing them into a 3D volume.
Results:
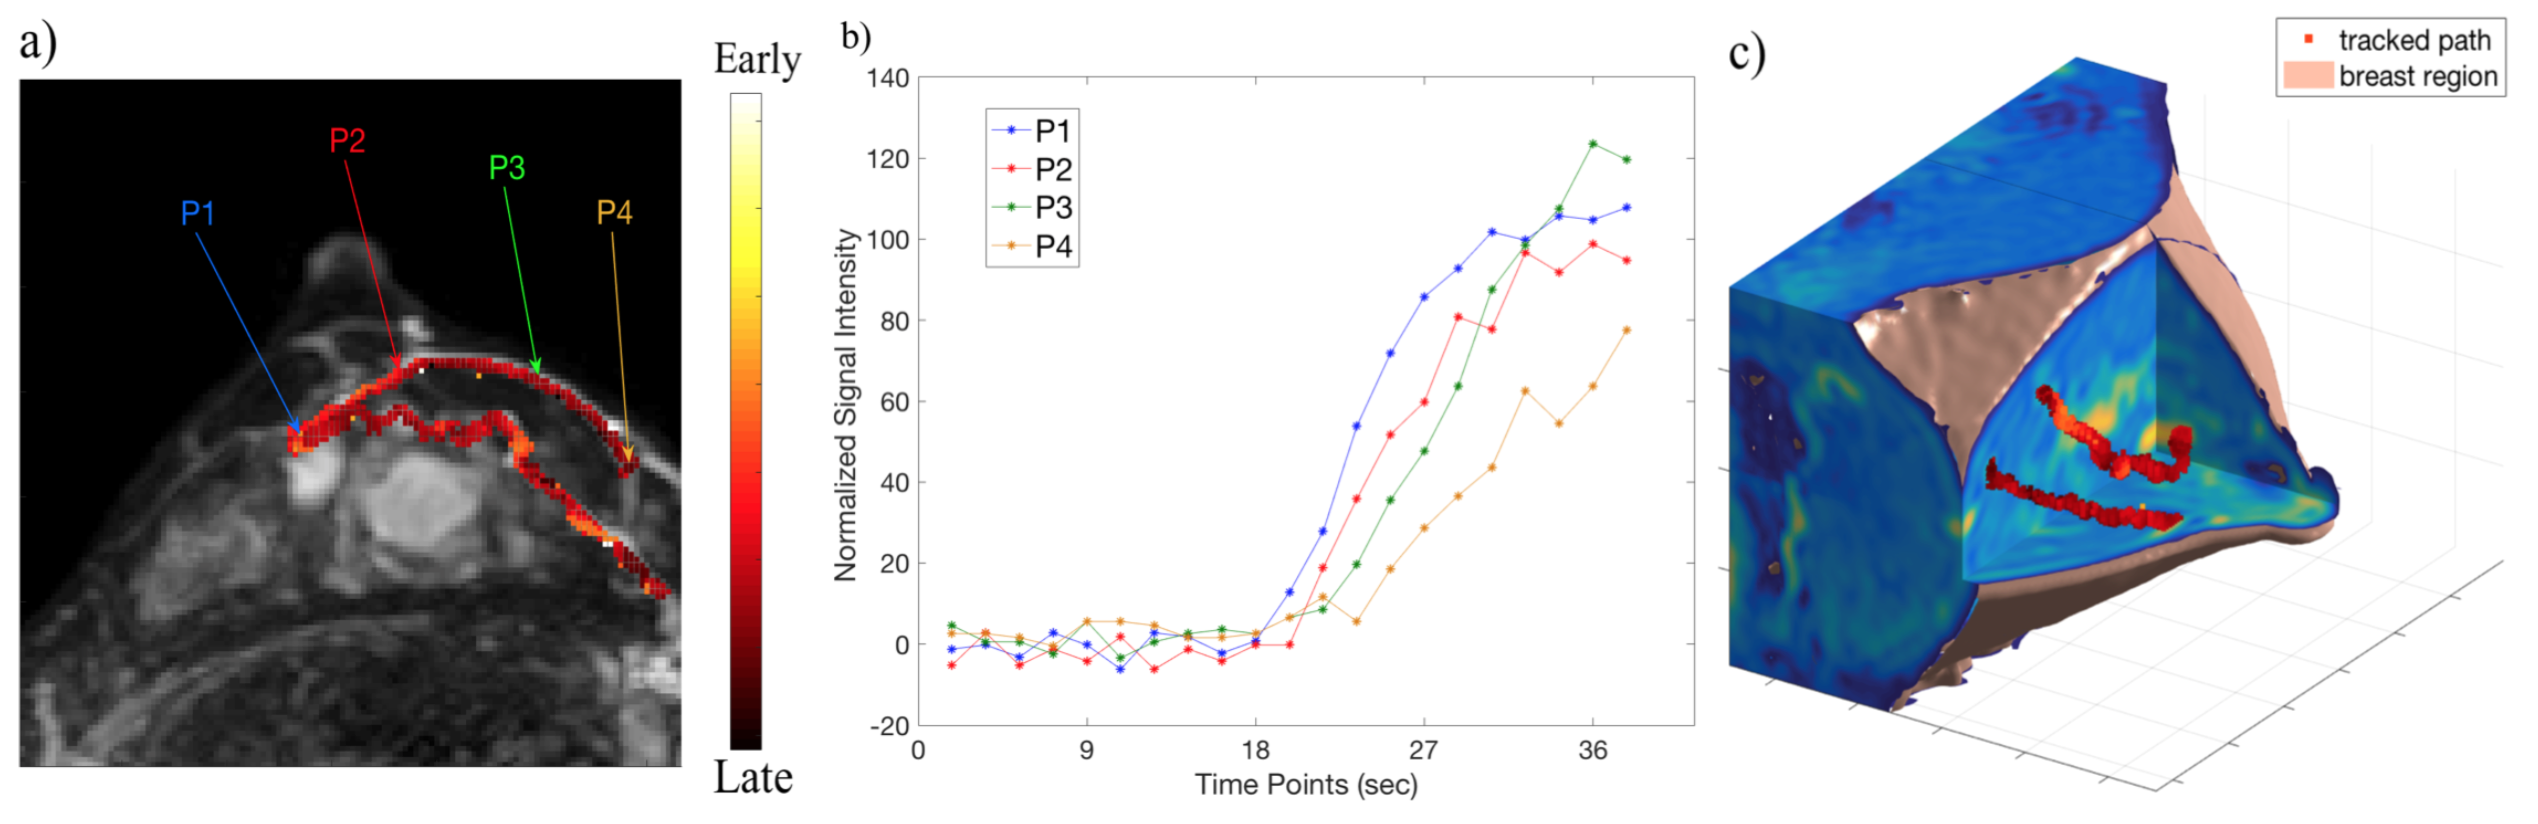
Representative results are shown in Figure 2. In Figure 2a, two tracked paths based on data obtained with 2 sec resolution data are indicated and overlain on the MIP of a post-contrast image. Observe how the vessels appear to originate from the most lateral lesion and extend to the internal thoracic veins. Figure 2b shows the normalized signal intensity (SI) time series associated with four different locations within the most anterior vessel (i.e., P1, P2, P3, P4 as labeled in Figure 2a). The order of enhancement is what allows for the color coding of the vessel displayed in Figure 2a. The high temporal resolution of the acquisition thus allows for not only vessel tracking, but also determining the direction of flow within the breast tissue. Figure 2c prevents a 3D rendering of the tracked vessels within the breast volume to better visualize their trajectory.Discussion and Conclusion:
We have presented preliminary evidence of an automated, post-processing analysis of high-temporal resolution DCE-MRI data that detects, segments, and shows the direction of flow within the vascular tree of breast tumors. We are currently investigating several ways to implement connectivity analyses to determine which are the feeding and draining vessels of the tumor. We hypothesize that accurate measurement of such vascular characteristics can significantly improve the sensitivity of DCE-MRI in the accurately diagnosing suspicious breast lesions.Acknowledgements
NCI U01CA142565, CPRIT RR160005References
[1] American College of Radiology. BI-RADS Committee. Breast imaging reporting and data system. Ed. American College of Radiology. American College of Radiology, 1998.
[2] Kuhl, C.K., et al., MRI for diagnosis of pure ductal carcinoma in situ: a prospective observational study. Lancet, 2007. 370(9586): p. 485-92.
[3] Kuhl, C.K., et al., Dynamic breast MR imaging: are signal intensity time course data useful for differential diagnosis of enhancing lesions? Radiology, 1999. 211(1): p. 101-10.
[4] Kuhl, C.K., Concepts for differential diagnosis in breast MR imaging. Magn Reson Imaging Clin N Am, 2006. 14(3): p. 305-28, v.
Figures