4951
Impact of Temporal Resolution on Quantitative DCE-DISCO Measurements in Prostate Cancer1Biomedical Translational Imaging Centre (BIOTIC), Nova Scotia Health Authority, Halifax, NS, Canada, 2Diagnostic Radiology, Dalhousie University, Halifax, NS, Canada, 3Physics and Atmospheric Science, Dalhousie University, Halifax, NS, Canada, 4Computer Science, Dalhousie University, Halifax, NS, Canada, 5School of Health Sciences, Dalhousie University, Halifax, NS, Canada, 6Pathology, Dalhousie University, Halifax, NS, Canada
Synopsis
Depending on the particular application, the temporal resolution of dynamic contrast-enhanced MRI may have an impact on measurements of quantitative parameters related to contrast agent kinetics. In this study we retrospectively altered the temporal resolution of DCE-DISCO acquisitions in patients with prostate cancer, and examined the effect on the rate constant Ktrans in both normal tissue and cancer (as confirmed by histopathology). The difference in mean Ktrans values between tissue types was found to vary significantly with temporal resolution between 4 and 10s, suggesting that the uptake dynamics in cancer are more accurately sampled at higher temporal resolution.
Purpose
Dynamic contrast-enhanced (DCE) MRI allows quantification of
parameters related to uptake of contrast agent in tissue, to help distinguish
normal tissue from pathology like cancer.
In applications involving detection of prostate cancer, the impact of
the temporal resolution of the DCE acquisition is being explored. The PI-RADS diagnostic criteria1 suggest
a temporal resolution of at least 10 seconds, a finding supported by Othman2. A recent study3 using GRASP to allow
retrospective reconstruction of multiple temporal resolutions showed no benefit
of reducing temporal resolution below 10s, in terms of qualitative radiologist
assessment of conspicuity, or quantitative values. However, a study in breast cancer4
did show changes in the transfer rate constant Ktrans as a function
of both temporal resolution and temporal regularization of the GRASP
reconstruction. In this work we isolate the
effect of temporal resolution below 10s by retrospective resampling of time
series acquired with DCE-DISCO5.Methods
MR images were obtained using a 3T GE MR750 scanner (GE Healthcare, Waukesha WI) and an 32-channel RF coil (Invivo Corp, Gainesville FL). Data were collected from 9 patients who received clinically indicated prostate MR examinations prior to undergoing radical prostatectomy, and who consented to allow their data to be used in this study. DCE-DISCO images were acquired with 224x192 matrix, 26-32 slices, 340x340x90mm FOV, TR=4ms, FA=12, 60 phases with a reconstructed temporal resolution of 3.5-4s after view sharing. The image series were then retrospectively downsampled in Matlab (The Mathworks, Natick MA) using a linear interpolation along the time dimension to produce temporal resolutions of 6s, 8s, and 10s.
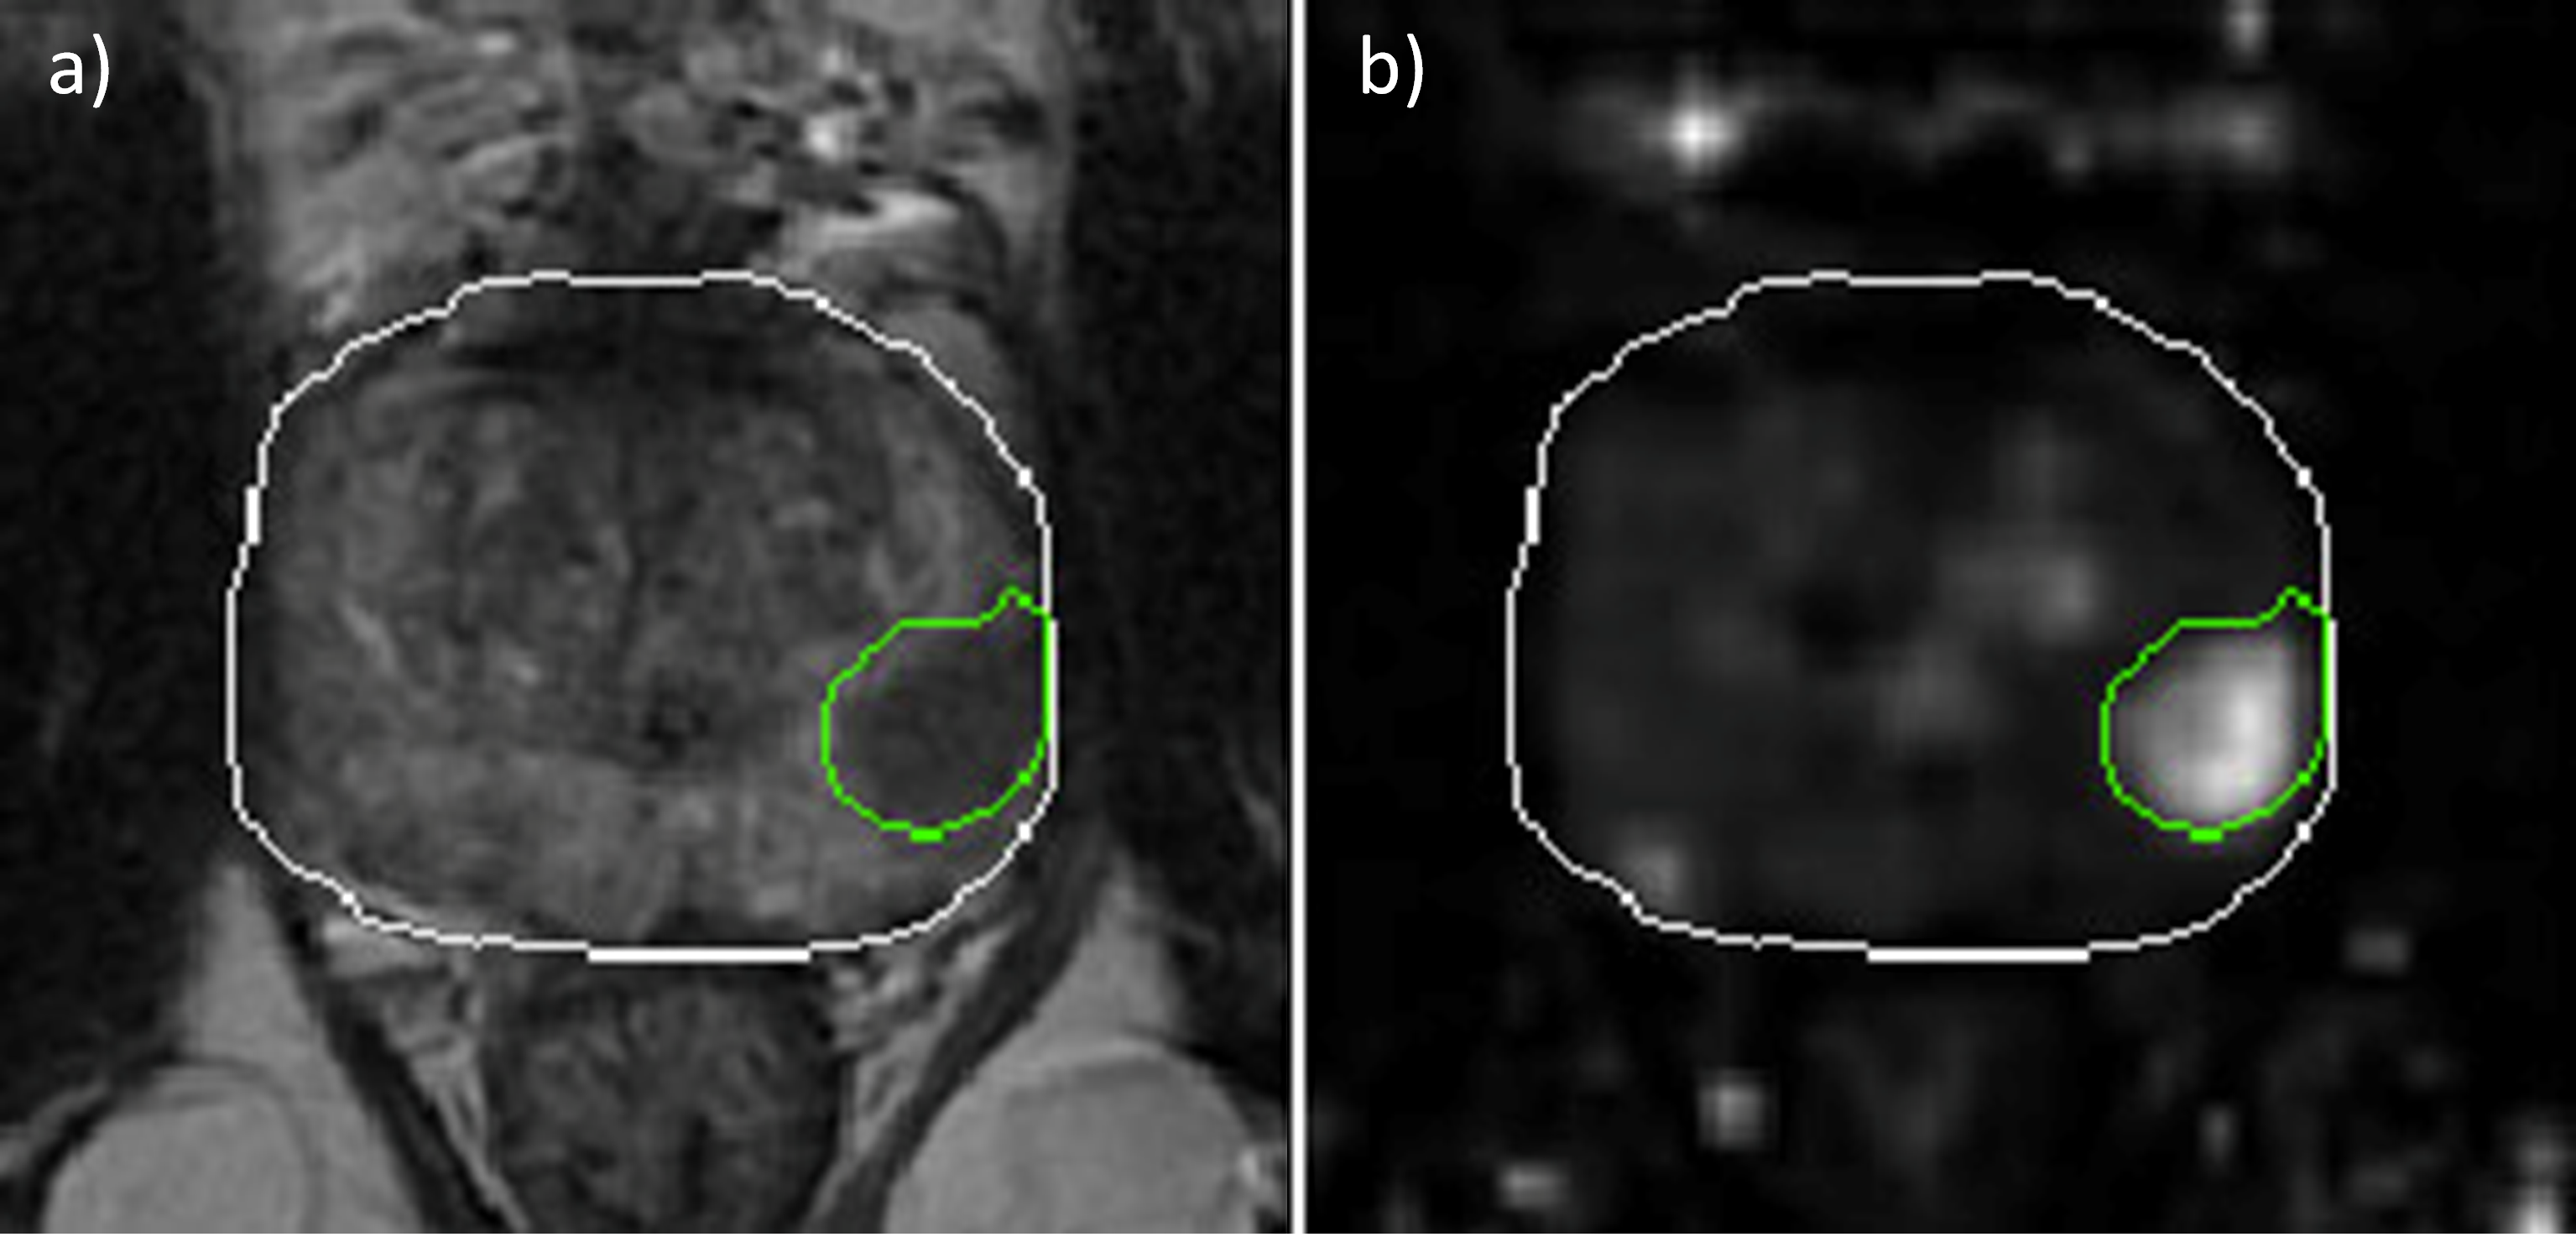
A parameter map of the rate constant Ktrans was computed using GenIQ (GE Healthcare) and a population average model arterial input function. ROIs were drawn corresponding to the location of known tumors as confirmed by histopathology, as well as an ROI to encompass all non-cancerous tissue within the prostate (see Figure 1). These ROIs were transferred to the Ktrans maps and used to extract values for analysis. A repeated-measures ANOVA and a linear mixed effect model analysis were performed on the mean values of each ROI, and on the difference of the means between cancer and non-cancer ROIs, to assess changes in mean Ktrans value with temporal resolution. Receiver operating characteristic (ROC) curve analysis was performed to determine the impact of temporal resolution on the ability to classify cancerous tissue.
Results
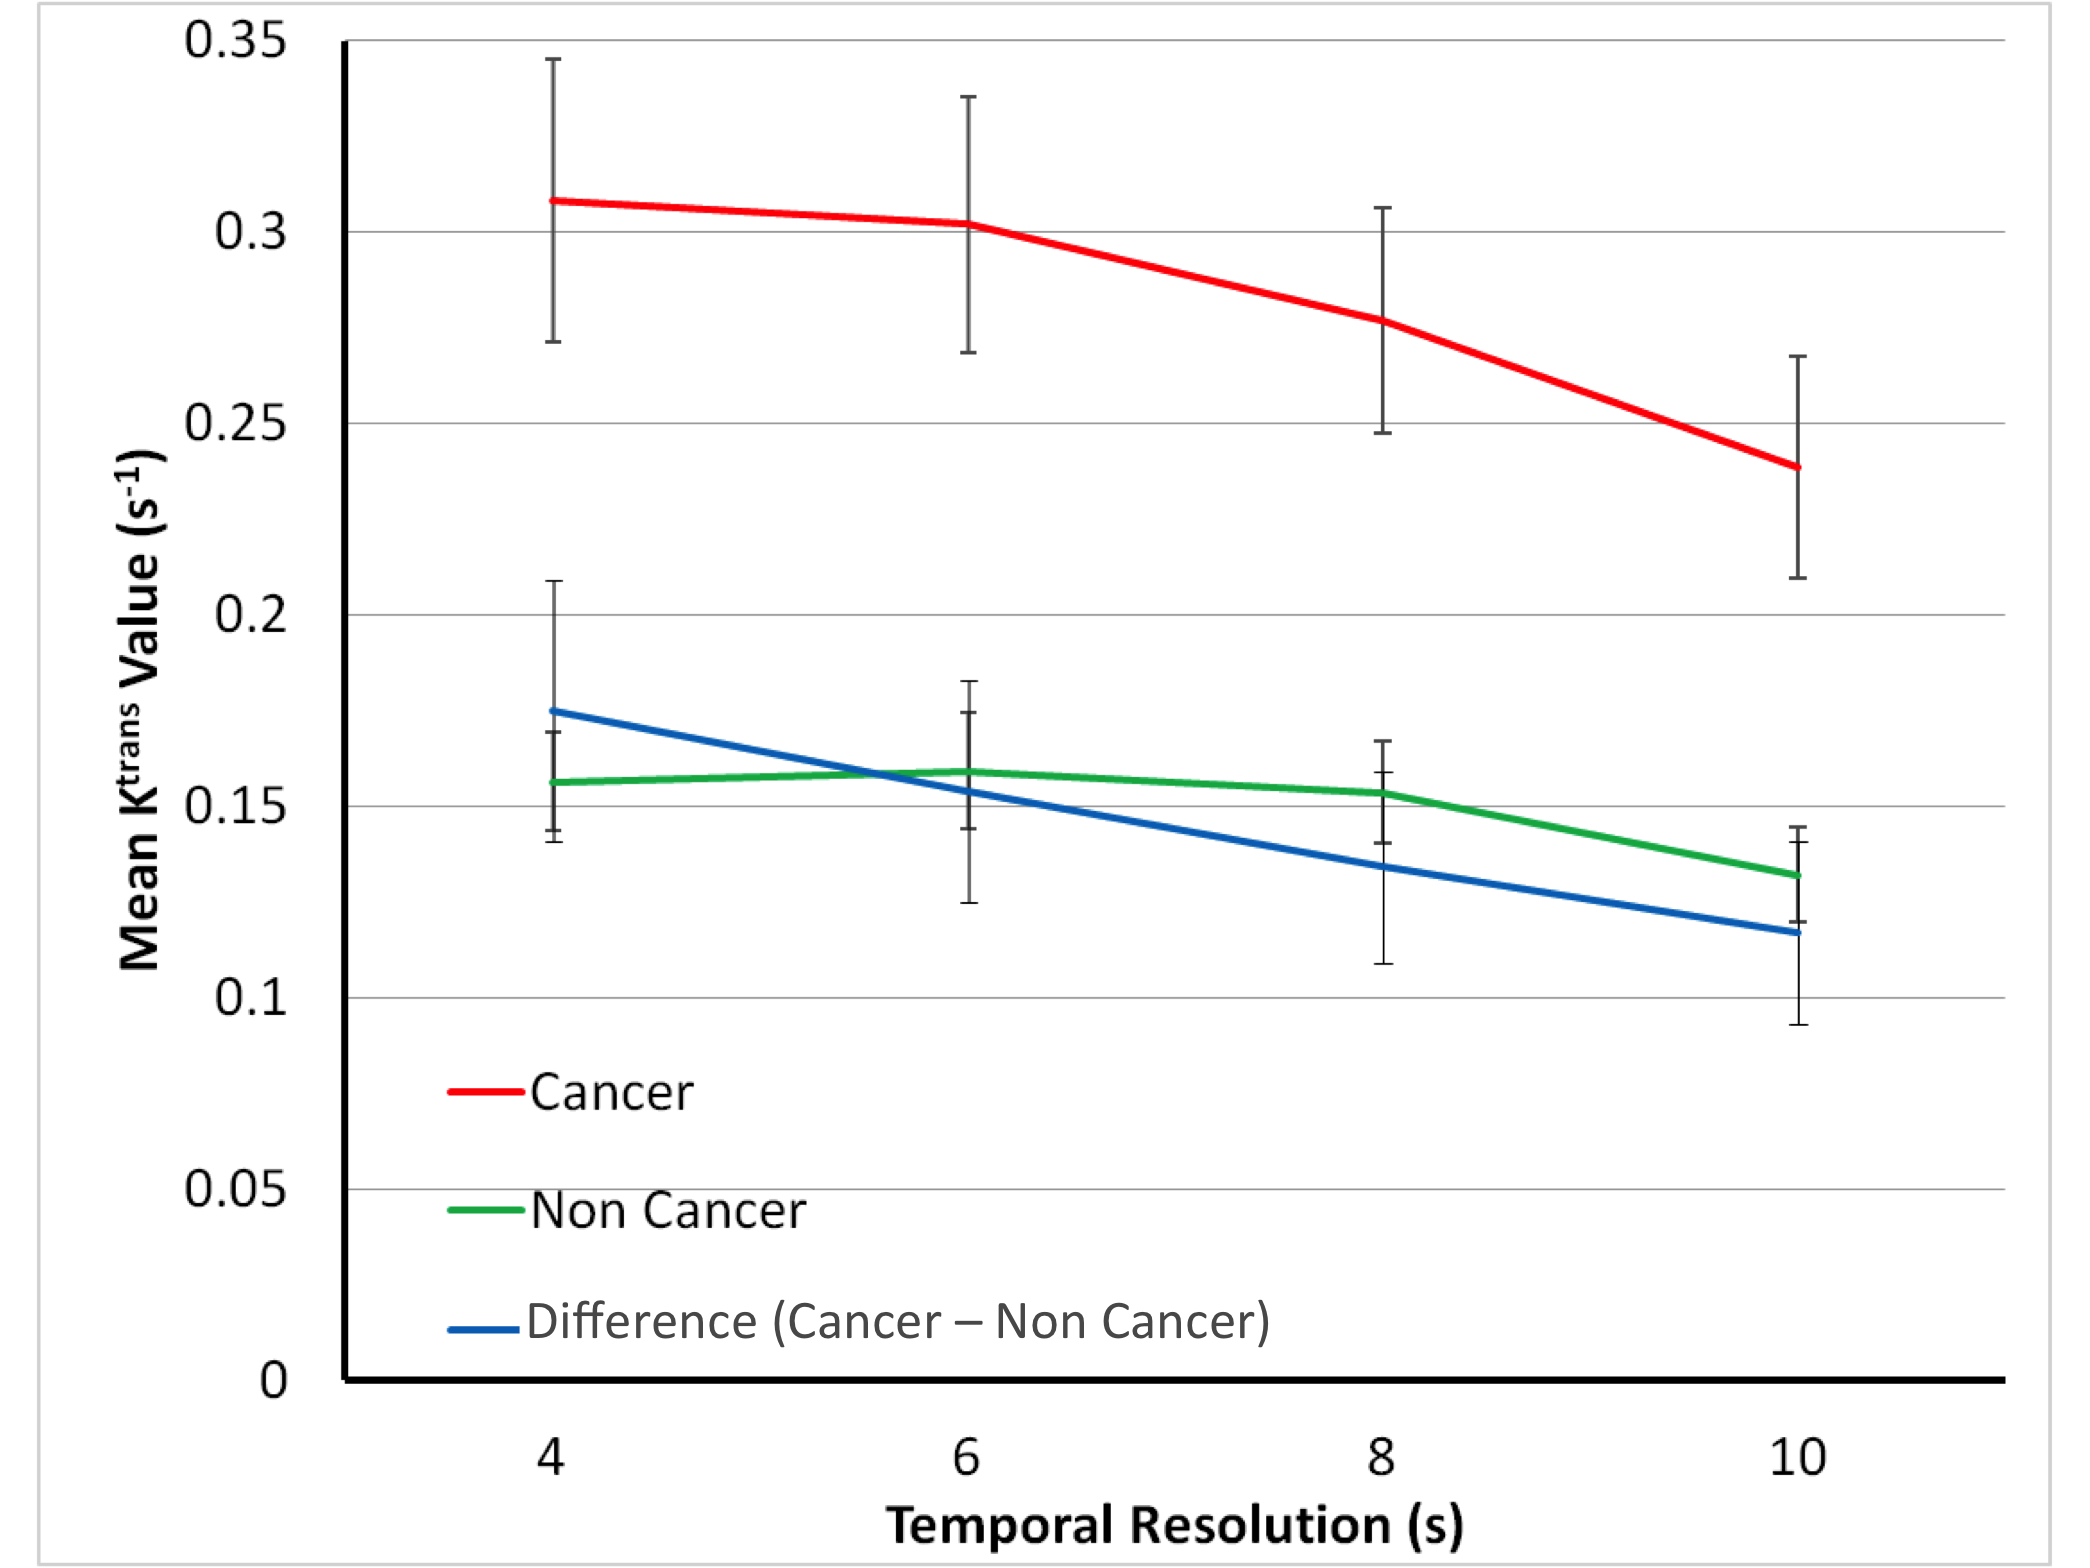
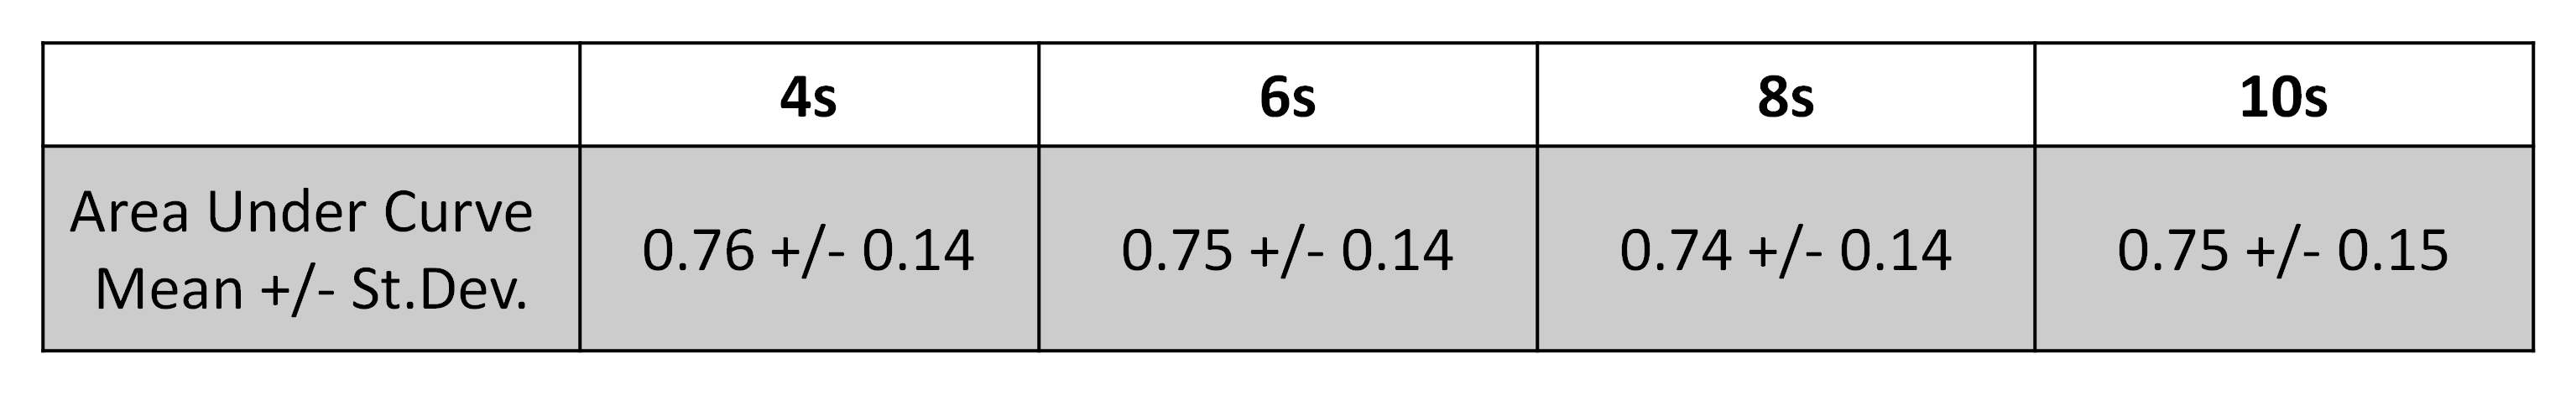
As shown in Figure 2, mean Ktrans values in both cancerous and non-cancerous ROIs show a trend toward lower values as temporal resolution increases from 4 to 10s. Repeated-measures ANOVA tests rejected the null hypothesis that Ktrans is constant across temporal resolutions, with p<3e-6 for cancer and p<5e-4 for non-cancer. The difference between cancer and non-cancer mean Ktrans values also changes significantly with temporal resolution (p<3e-6), indicating that Ktrans values in cancerous tissue are affected to a larger degree than those in non-cancerous tissue. Linear mixed effects model analysis confirmed that the slope of Ktrans versus temporal resolution differs significantly between cancer and non-cancer ROIs (p<3e-5). However, ROC analysis showed that the area under the ROC curve (AUC) was not significantly impacted by the temporal resolution (Table 1), and classification accuracy is not impaired for temporal resolutions up to 10s.Discussion and Conclusions
While the use of PK parameter maps is not mandated by PI-RADS criteria, as techniques for reliable quantitative DCE imaging become more common in the clinic, the use of parameters such as Ktrans in diagnostic roles is increasingly likely. In particular, the use of automated classification methods based on e.g. machine learning could have a substantial impact on diagnosis of certain types of cancers. For this reason, optimizing the accuracy of these techniques is critical.
In this study we demonstrate a variation in measured Ktrans values as a function of temporal resolution. This effect is solely due to changing the temporal resolution and not to changes in regularization present in highly undersampled approaches such as GRASP. While the mean Ktrans value in non-cancerous tissue appears to stabilize at temporal resolutions finer than 6s, it continues to increase in cancerous tissue. This may reflect faster uptake kinetics in tumor tissue that are not sufficiently modeled at low temporal resolution. Over the range of temporal resolutions tested here, the ability to distinguish cancerous tissue from its surroundings is not significantly affected; however, reproducible quantitative Ktrans values are necessary for follow-up of patients on active surveillance, and comparisons of measurements across sites must be performed with this effect taken into account. Further investigation of the impact of temporal resolution on other accelerated DCE approaches is warranted.
Acknowledgements
Funding for this project was provided by the Dalhousie Radiology Research Foundation and the Atlantic Canada Opportunities Agency. We thank Dave McAllindon for creating a digitized pseudo-wholemount prostatectomy specimen from pathologists’ notes.References
1.American College of Radiology. Prostate Imaging – Reporting and Data System, version 2, September 2015.
2. Othman AE, Falkner F, Weiss J, Kruck S, Grimm R, Martirosian P, Nikolaou K, Notohamiprodjo M. Effect of Temporal Resolution on Diagnostic Performance of Dynamic Contrast-Enhanced Magnetic Resonance Imaging of the Prostate. Investigative Radiology 2016;51(5):290-296.
3. Ream JM, Doshi AM, Dunst D, Parikh N, Kong MX, Babb JS, Taneja SS, Rosenkrantz AB. Dynamic Contrast-Enhanced MRI of the Prostate: An Intraindividual Assessment of the Effect of Temporal Resolution on Qualitative Detection and Quantitative Analysis of Histopathologically Proven Prostate Cancer. J Magn Reson Imaging 2016; doi:10.1002/jmri.25451.
4. Kim SG, Feng L, Grimm R, Freed M, Block KT, Sodickson DK, Moy L, Otazo R. Influence of Temporal Regularization and Radial Undersampling Factor on Compressed Sensing Reconstruction in Dynamic Contrast Enhanced MRI of the Breast. J Magn Reson Imaging 2016;43:261–269.
5. Saranathan M, Rettmann DW, Hargreaves BA, Clarke SE, Vasanawala SS. DIfferential Subsampling with Cartesian Ordering (DISCO): a High Spatio-temporal Resolution Dixon Imaging Sequence for Multiphasic Contrast Enhanced Abdominal Imaging. J Magn Reson Imaging 2012;35(6):1484-1492.
Figures