4949
Diagnostic Performance in MR-visible Prostate Cancer: Can a Quantitative Computer-aided Diagnosis System Be Superior to the Qualitative PI-RADS v2 Guideline?Jing Wang1, Yang Fan2, and Yudong Zhang3
1Center for Medical Device Evaluation, CFDA, Beijing, People's Republic of China, 2MR Research China, GE Healthcare, Beijing, People's Republic of China, 3Department of Radiology, the First Affiliated Hospital with Nanjing Medical University, Nanjing, People's Republic of China
Synopsis
A novel CAD system was developed for prostate cancer detection based on multi-parametric MRI, including textured T2w, DKI and Tofts-Ktrans. MR features were evaluated by using machine-assisted classification methods such as PCA and SVM analysis. The validation performed in 54 patients confirmed as PCa, to determine whether the CAD has the ability to correct diagnosis in MR-visible prostate cancer, as comparison with a proposed structured PI-RADS v2. Our results showed that the automatic PCa detection using CAD had significantly higher AUC than PI-RADS v2 in distinguishing cancer from normal prostate tissue.
INTRODUCTION
The application of MR-based Prostate Imaging Reporting and Data System (PI-RADS v2) has validity for detecting prostate cancer (PCa) in established researches 1. Despite its strong potential, the performance of PI-RADS can be subjective, which depends on radiologists’ experience, level of local medical culture and personal preference. Additionally, because of non-quantitative nature, it is difficult to achieve standardization of diagnostic criteria, thereby limiting the clinical reproducibility. Image screening based on an automatic computer-aided diagnosis (CAD) system has been identified as a potential alternative to conventional methodologies for automated lesion detecting and classification 2. Therefore, this study was to determine whether a CAD approach can improve PCa detection as compared with the structured PI-RADS v2.METHODS
This IRB-approved retrospective study included 54 patients who underwent prostate mp-MRI and were histologically confirmed as PCa after radical prostatectomy. A radiologist and a pathologist identified 54 cancer regions of interest (ROIs), 47 normal peripheral zone (PZ) ROIs, and 48 transitional zone (TZ) ROIs based on correlation of histologic and MR findings. Total 40 image features, i.e., mean, median, 10th percentile, 90th percentile, entropy, kurtosis, skewness, inhomogeneity, were extracted from normalized T2-weighted and high-b (1500 s/mm2) diffusion-weighted images, diffusion kurtosis imaging (DKI)-derived Dapp and Kapp, Toft-Ktrans. An automatic machine learning-based analysis model was established by comprehensive evaluation of mp-MRI features via a principal component analysis and support vector machine (SVM) to discriminate PCa from normal PZ and TZ ROIs (Figure 1). Performance of machine learning-based model was compared with a PI-RADS v2 score that interviewed by two independent radiologists via receiver operating characteristic curve analysis with area under the curve (Az).RESULTS
The CAD approach had significantly higher Az than PI-RADS v2 in distinguishing cancer from normal PZ+TZ ROIs (0.952 vs. reader#1: 0.916, p = 0.043; and vs. reader#2: 0.929; p = 0.069), PZ ROIs (0.976 vs. reader#1: 0.938, p = 0.049; and vs reader#2: 0.920; p = 0.038) and TZ ROIs (0.914 vs. reader#1: 0.858, p = 0.041; and vs. reader# 2: 0.900, p = 0.079), respectively (Figure 2). With the same specificity, CAD had higher sensitivity than PI-RADS v2 in distinguishing cancer from normal PZ ROIs (91.1% vs. 71.1%). 10th Dapp (Az: 0.948 for PZ; 0.866 for PZ) and 90th Kapp (Az: 0.937 for PZ; 0.821 for TZ) were better than all the other imaging features in diagnostic performance.CONCLUSION
In this study, an automatic CAD based on machine learning-based analysis of mp-MRI data was developed, which can be effective in distinguishing PCa from the normal prostate tissue. The DKI features, i.e., 10th Dapp and 90th Kapp, were predominantly superior to T2WI, DWI and toft-Ktrans in classifying prostate observations. The CAD approach based on mp-MR imaging features has the potential to improve image interpretation by providing radiologists with quantitative and standardized criteria, thereby leading to more reliable cancer diagnosis for better patient counseling and treatment planning.Acknowledgements
No acknowledgement found.References
1. Weinreb JC,et al. PI-RADS Prostate Imaging - Reporting and Data System. Eur Urol 2016. 2. Sung YS, et al. Prostate cancer detection on dynamic contrast-enhanced MRI: computer-aided diagnosis versus single perfusion parameter maps. AJR 2011.Figures
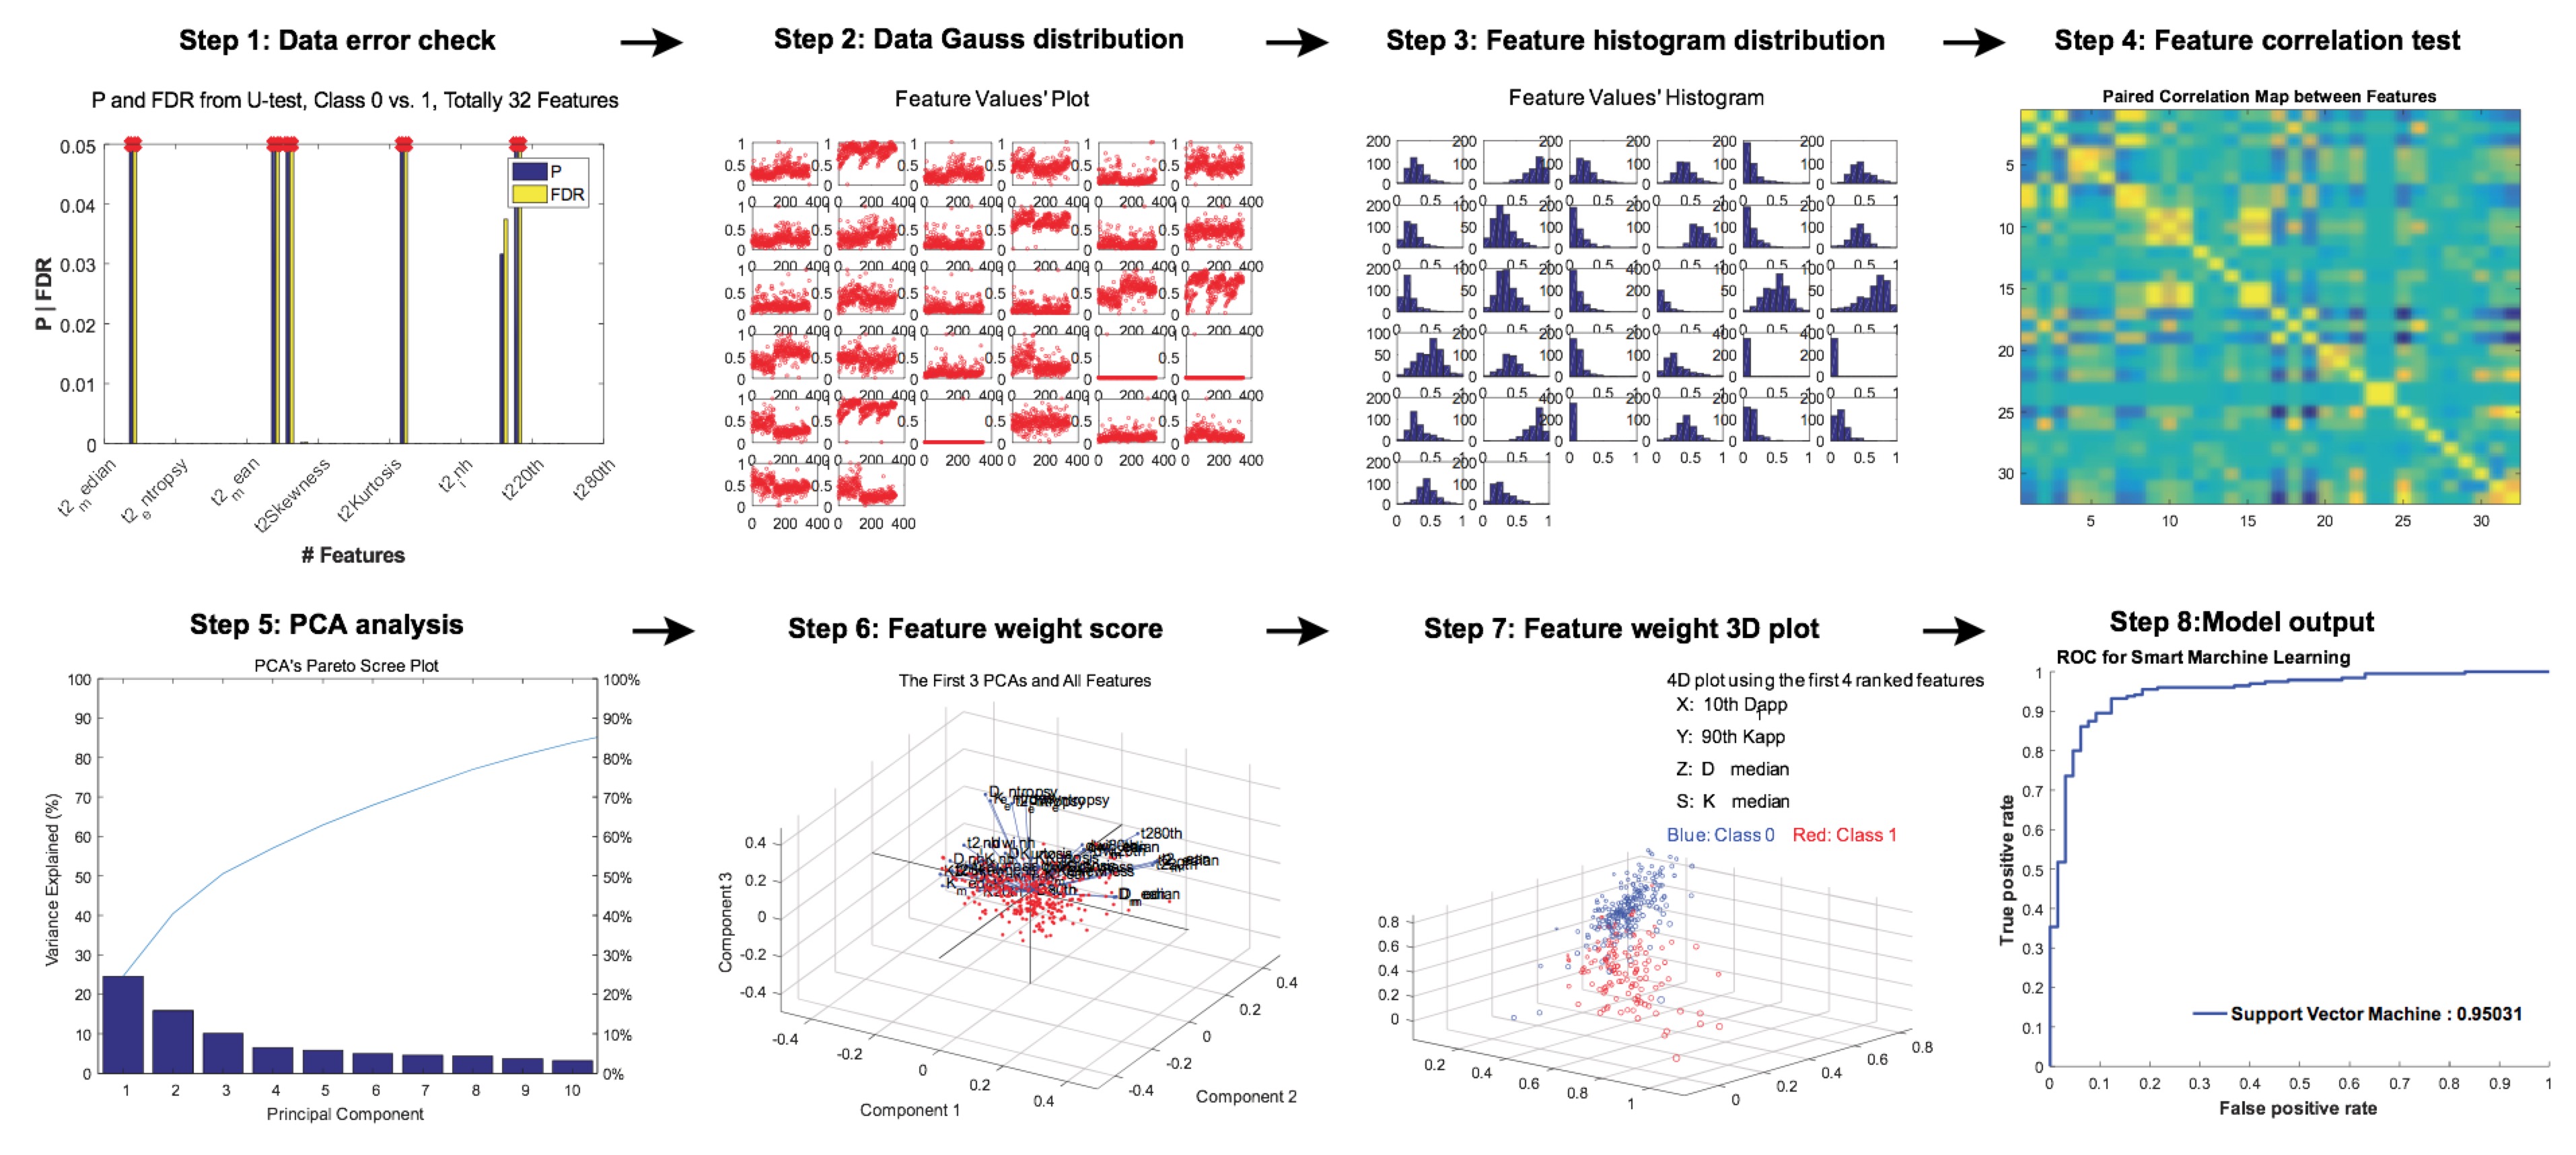
Figure
1: The workflow of machine learning analysis using support vector machine for prostate lesion classification. FDR
= false discovery rate; PCA = principal component analysis.
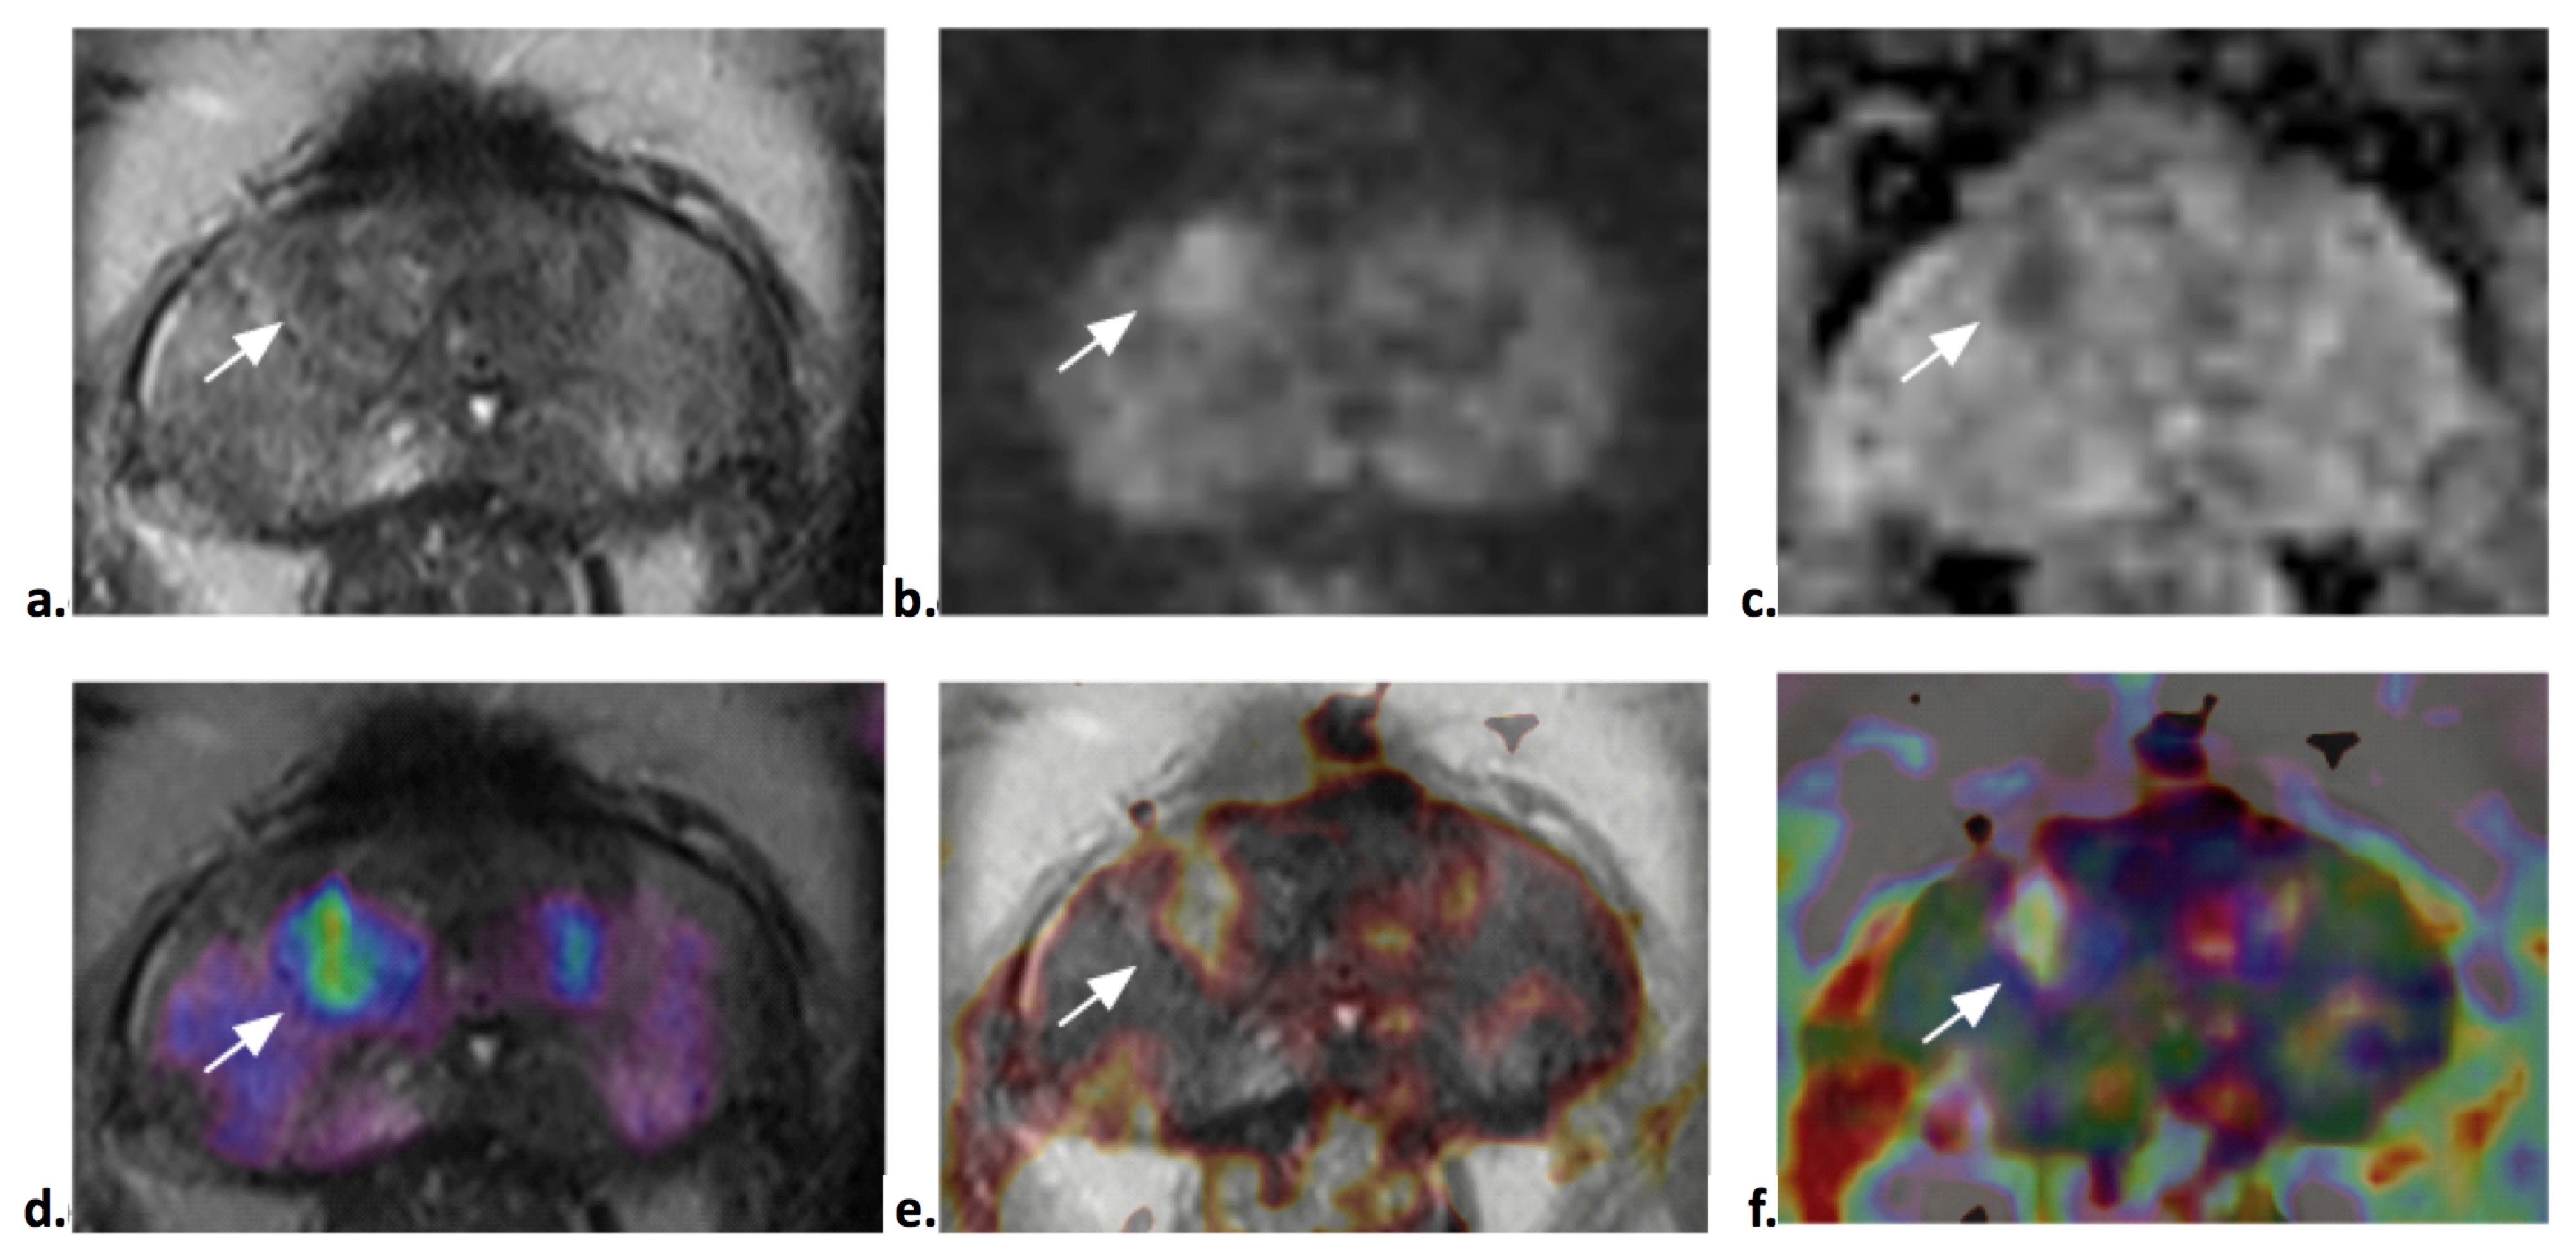
Figure
2: The comparison of structured PI-RADS v2
and CAD in a TZ observation (white arrow) from a 68-year man with increased PSA (17.8 ng/ml). The
lesion is characteristic with heterogeneous signal intensity with obscured
margins in T2WI (a), focal hyper-intense in DWI (b), and mildly hypo-intense in Dapp (c). The lesion
score is 3 according to PI-RADS v2 guideline from both readers. However, it is
clearly visible in Ktrans (d), Kapp (e) and fusion T2WI+Ktran+Dapp+Kapp image
(f), and determined as cancer by CAD (Pi = 0.5588) . The lesion was operated and confirmed as PCa (Gleason 3+3).