4947
Inverse Laplace transform analysis using a fast multi-echo TSE sequence for prostate cancer diagnosis1Radiology, University of Chicago, Chicago, IL, United States, 2R&D Institute, Samsung R&D Institute, Bangalore, India, 3Pathology, University of Chicago, Chicago, IL, United States, 4Health Science, University of Sydney, Sydney, Australia
Synopsis
To evaluate the inverse Laplace model fitting to multiple TE TSE data for prostate cancer diagnosis. Prostate tissue has glandular structure with luminal volume and epithelial cells forming the walls of gland. The underlying physical phenomenon in prostate cancer can be accurately captured using two-compartment T2 decay modeling. It is impossible to acquire MR images to perform accurate multi-compartment T2 decay model in clinically feasible scan times since multiple T2W MRI images over a wide range of echo times are required. Recently a fast multi-echo TSE (ME-TSE) T2 mapping technique, k-t-T2 MRI was developed to obtain high resolution T2 maps in clinically feasible scan time. In this study, a new implementation of the inverse Laplace transform was applied to the multi-echo TSE T2WI data. We present evidence that multiple slow components can be present in the decaying T2WI signal in the normal tissue in the prostate but were absent in pathology confirmed cancers on k-t-T2 data.
Purpose:
To evaluate the inverse Laplace model fitting to multiple echo time (TE) TSE data for prostate cancer (PCa) diagnosis. T2WI forms the backbone of prostate MRI to identify PCa with high sensitivity in 3D high resolution MR Images. Prostate tissue has glandular structure with luminal volume and epithelial cells forming the walls of gland. The underlying physical phenomenon in PCa can be accurately captured using two-compartment T2 decay modeling. However, it is impossible to perform accurate multi-compartment T2 decay modeling in clinically feasible scan time since multiple T2WI over a wide range of TE are required. Recently a fast multi-echo TSE (ME-TSE) T2 mapping technique, k-t-T2 MRI was developed to obtain high resolution T2 maps in clinically feasible scan time1,2. In this study, a new implementation of the inverse Laplace transform was applied to the multi-echo TSE T2WI data. We present evidence that multiple slow components can be resolved in the decaying T2WI signal in the normal tissue in the prostate but are absent in pathology confirmed cancers on k-t-T2 data.Methods:
This IRB approved study included sixteen patients with whole mount pathology reports. The average age of the patients was 67 yo,range 53-79 yo. k-t-T2 were acquired in axial view on a Philips 3T Achieva scanner with thirty-two echoes; ΔTE=12ms (TE= 24ms to 396ms); scanning resolution=1.0x1.0 mm2 in-plane resolution, FOV=160×160mm2; slice thickness=3mm; TR=3060 ms; scan time=4:30min. k-t-T2 uses k-t space under sampling method for image acquisition, with 3-D kernel reconstruction (kx-ky-TE) to accelerate the scan. Lesions were identified on pathology slices and high resolution axial T2WI. Regions of interest (ROIs) were outlined on high-resolution T2WI and k-t-T2 images by an experienced radiologist and two medical physicists based on pathology slices that include cancer (n=15), normal peripheral zone (PZ) (n=13), normal transition zone (TZ) (n=9) and cyst (n=4). Signal at each TE value was averaged over an ROI. The k-t-T2 data were analyzed using a non-linear least square fit to inverse Laplace transform equation3: A(D)=L-1{ S(TE)=exp(-TE*(1/T2))}. Values of A and D at each peak location were recorded. The corresponding D value (Dturning) of the fitting curve's amplitude reaches less than or equal to 0.015 (i.e. Dturning at A<=0.015) was also recorded in each ROI. The recorded values from different ROIs were compared (using Kruskall–Wallis test and Welch two sample t-test) to evaluate for statistically significant differences.Results:
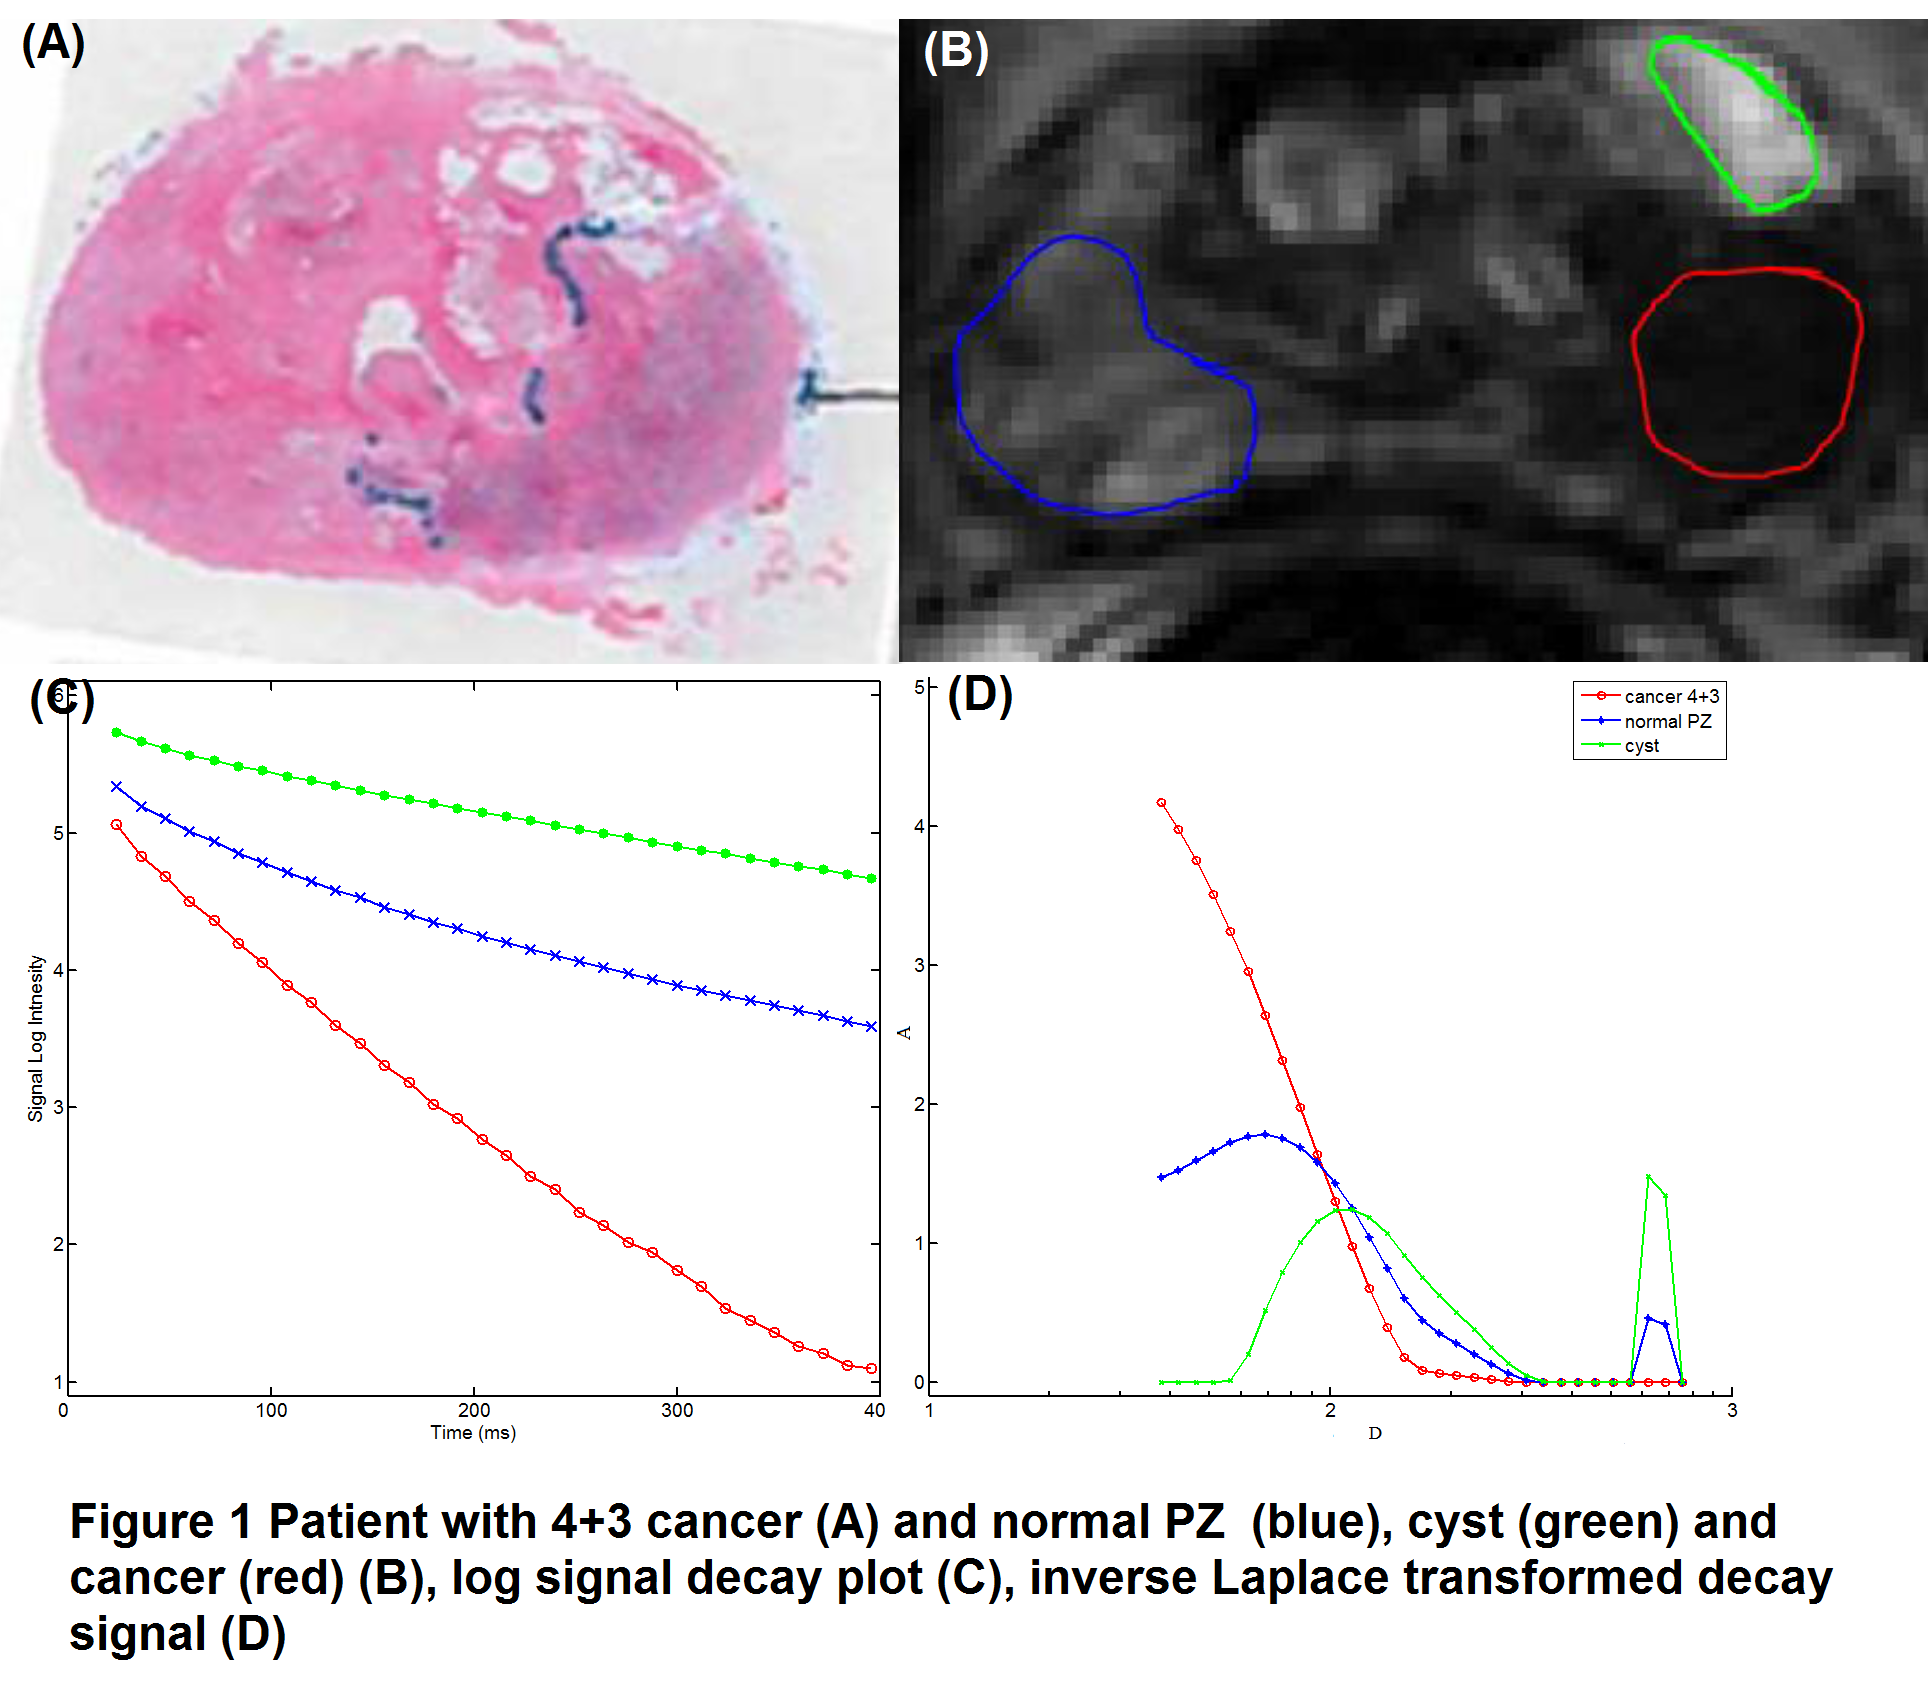
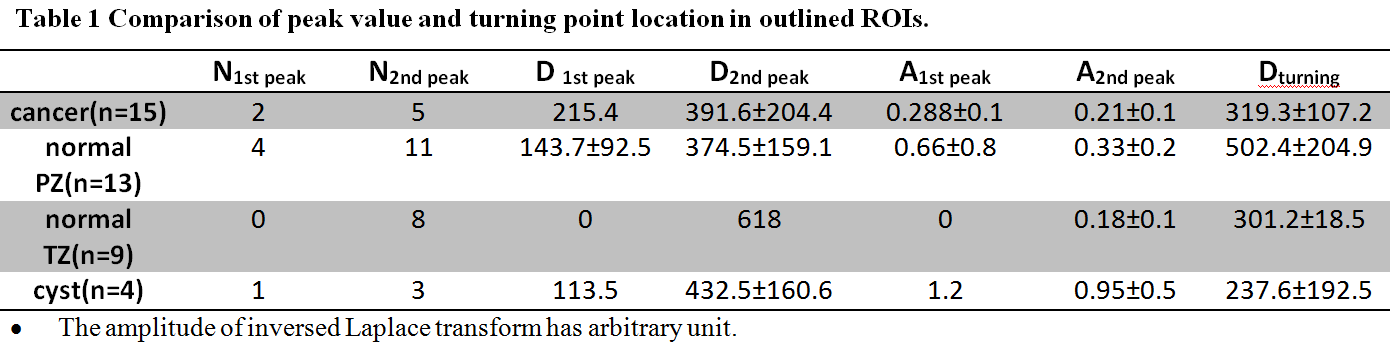
ROI based analysis results are illustrated in Figure 1 and presented in Table 1. Figure 1 shows a patient (58 yo) with 4+3 PCa. (A) Histological slices. (B) Three ROIs were outlined on k-t-T2 image: cancer (red), normal peripheral zone (PZ) (blue) and cyst (green). (C) A log signal decay plot shows the averaged signal in each ROI. (D) shows the inverse Laplace transform of the signal decay. The double peak pattern was present in two cancer ROIs and a single 2nd peak was present in three cancer ROIs with Gleason grades (GS=3+3). No peak was present in cancer region with GS>3. The 2nd peak was present in most normal and cyst regions (Table 1). Normal PZ has two peaks at 143.7±92.5ms and 374.5±159.1ms , normal TZ has only one peak at 618ms, benign cyst ROIs have higher peak values compared to normal PZ and TZ at 113.5ms and 432.5±160.6ms. There is a significant difference in A2nd peak values (p=0.03) and Dturning values (p=0.02) between four ROI groups. There is significant difference between cancer and normal PZ in Dturning values (p=0.04).Discussion:
The absent of peaks (i.e. a single component decay) in the cancer ROIs is in consistency with pathological findings that cancer lacks luminal structure and compartmentalization. The 1st peak location D1st peak is in general agreement with literature value (80±34ms) of the transverse relaxation constant (T2) for prostate at 37oC 4,5. In the normal PZ/TZ and cyst, two components were typically present, which is consistent with expected compartmentalization of tissue. The peak amplitudes A1st peak and A2nd peak in the inverse Laplace transform result from different ROIs, Figure 1 (D) demonstrates the inverse Laplace transform results in the outlined prostate regions. In both 1st and 2nd peaks, cysts have higher peak amplitudes compared with cancer, normal PZ and TZ (Table 1).Conclusion:
Multi-echo k-t-T2 sequence is feasible in clinical setting. The inverse Laplace transformation of multiple TE value spin echo decay may help characterize prostate lesions and may be sensitive to Gleason grade.Acknowledgements
This research is supported by NIH R01 CA172801-01.References
1. Liu W, Turkbey B, Sénégas J, Remmele S, Xu S, Kruecker J, Bernardo M, Wood B. J, Pinto P. A. and Choyke P. L. Accelerated T2 mapping for characterization of prostate cancer. Magn. Reson. Med., 2011; 65: 1400–1406.
2. Agarwal HK, et.al.,ISMRM 2401, 2012.
3. Medved M, Wang S, Sammet S, Yousuf A, Karczmar G, Oto A. Inverse Laplace Transform Analysis of the DWI MRI Signal in Prostate and Bladder ISMRM. 4425, 2014.
4. Stanisz GJ, Odrobina EE, Pun J, Escaravage M, Graham SJ, et al. T1, T2 relaxation and magnetization transfer in tissue at 3T. Magn Reson Med 2005; 54: 507-512
5. Bojorquez JZ, Bricq S, Acquitter C, Brunotte F, Walker PM, et al. What are normal relaxation times of tissues at 3 T? Magnetic Resonance Imaging 2017; 35: 69-80.
Figures