4945
Mapping prostatic microscopic anisotropy using linear and spherical b-tensor encoding: A preliminary study1Clinical Science, Radiology, Lund University, Lund, Sweden, 2Clinical Sciences Lund, Medical Radiation Physics, Lund University, Lund, Sweden, 3Department of Radiology, Uppsala University, Uppsala, Sweden, 4Department of Radiation Sciences, Umeå University, Umeå, Sweden, 5Brigham and Women's Hospital, Harvard Medical School, Boston, MA, United States, 6Department of Molecular Medicine and Surgery, Karolinska Institute, Stockholm, Sweden, 7Department of Diagnostic Radiology, Karolinska University Hospital, Solna, Sweden
Synopsis
Diffusion tensor imaging (DTI) has the potential to improve prostate cancer detection, since anisotropy is expected to correlate with tumor aggressiveness and differentiation. Differences in fractional anisotropy between cancer and normal tissue have been observed, although data is somewhat contradictory. A problem with DTI is its inability to distinguish low anisotropy from high orientation dispersion. In this study, we map the anisotropy independent of orientation in the prostate, by the use of a novel diffusion-encoding technique that permits encodings with variable b-tensor shapes. The microscopic anisotropy was found to be generally higher in cancer than in normal prostatic tissue.
Purpose
Diffusion tensor imaging (DTI) has been suggested for improved prostate cancer detection and grading [Kozlowski2006, Li2015]. The benefit of DTI, compared to DWI, is that it estimates the fractional anisotropy (FA), which is sensitive to the presence of elongated cells and cell structures (here referred to as "microscopic anisotropy"). However, conflicting data have been reported with normal glandular tissue having both higher and lower FA than tumors [Manenti2007, Li2015, Uribe2015]. Importantly, FA is not specific to altered microscopic anisotropy, because orientation coherence also affects the voxel-level anisotropy [Szczepankiewicz2015]. The purpose of this work was to disambiguate these two sources of reduced anisotropy in both normal prostate tissue and cancers, using a technique that goes beyond conventional diffusion MRI [Lasic2014].Methods
Recent work has demonstrated that the use of high b-value DWI with both linear and spherical tensor encoding has the capacity to disambiguate microscopic anisotropy from orientation coherence [Szczepankiewicz2016]. We tested the feasibility of this technique in the prostate by using an in-house implemented prototype pulse sequence to acquire data on a Siemens 3T MAGNETOM Skyra in 17 patients having biopsy-confirmed prostate cancer. We used a matrix size of 128x128 in 17 slices, with an in-plane voxel size of 3x3 mm2, and a slice thickness of 4 mm. Repetition and echo times were 4000 ms and 101 ms, respectively. Five b-values were acquired (0.2, 0.5, 0.8, 1.2, and 1.5 ms/μm2) in 8 directions (1 ms/μm2 = 1000 s/mm2). The same protocol was employed to acquire data with both linear and spherical b-tensors, with optimized waveforms [Sjölund2015]. Total acquisition time was approximately 6 minutes. The data was analyzed using the CODIVIDE approach [Lampinen2016], which assumes that tissue can be decomposed into three components: (i) free water, (ii) tissue with isotropic cell structures, and (iii) with eccentric cell structures that yield microscopic anisotropy. The analysis yielded three parameter maps showing the free water fraction (fFW), the fraction of microscopically anisotropic structures (fAT), and the mean diffusivity of the tissue component (DT).Results
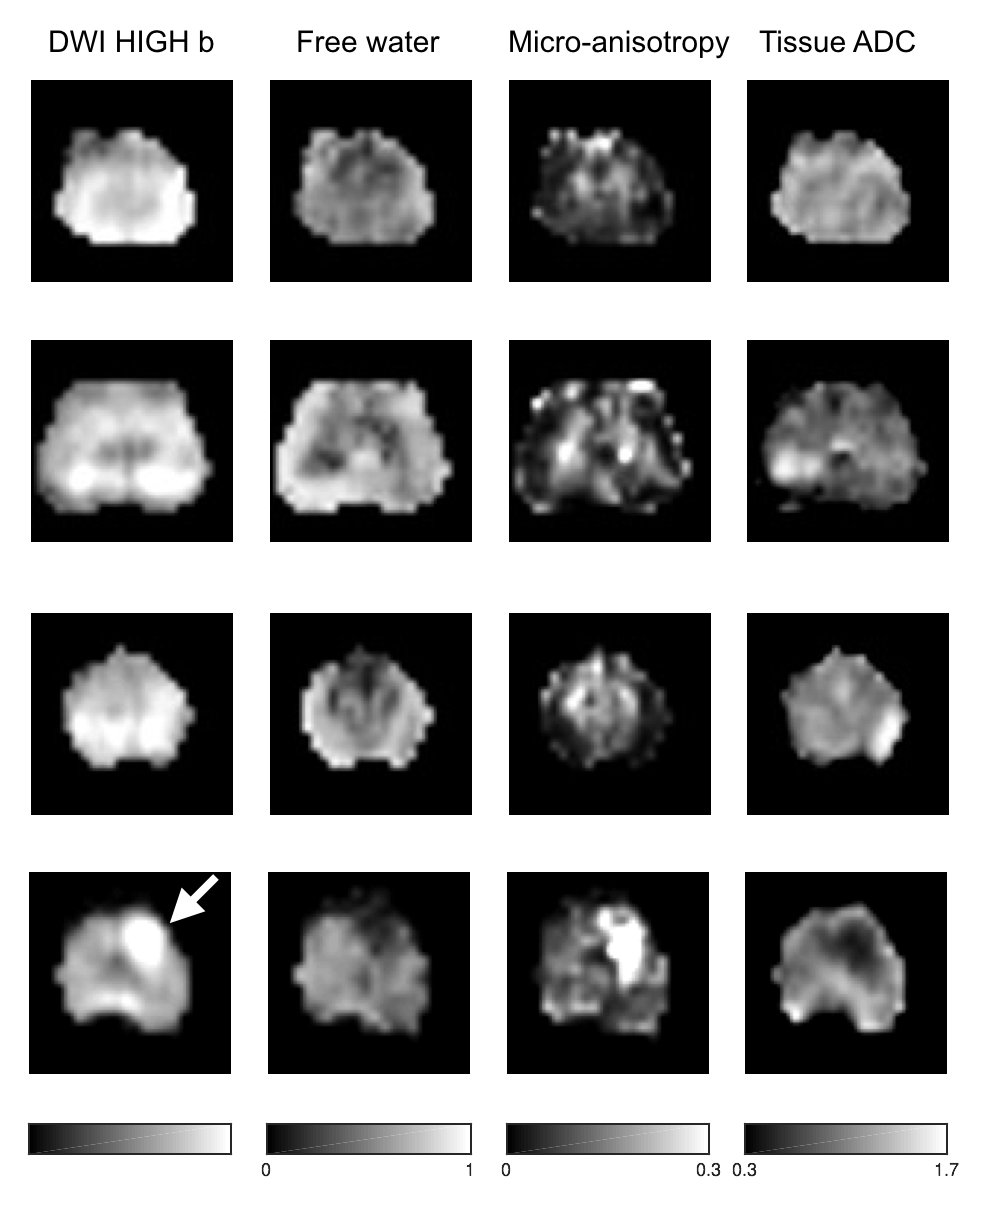
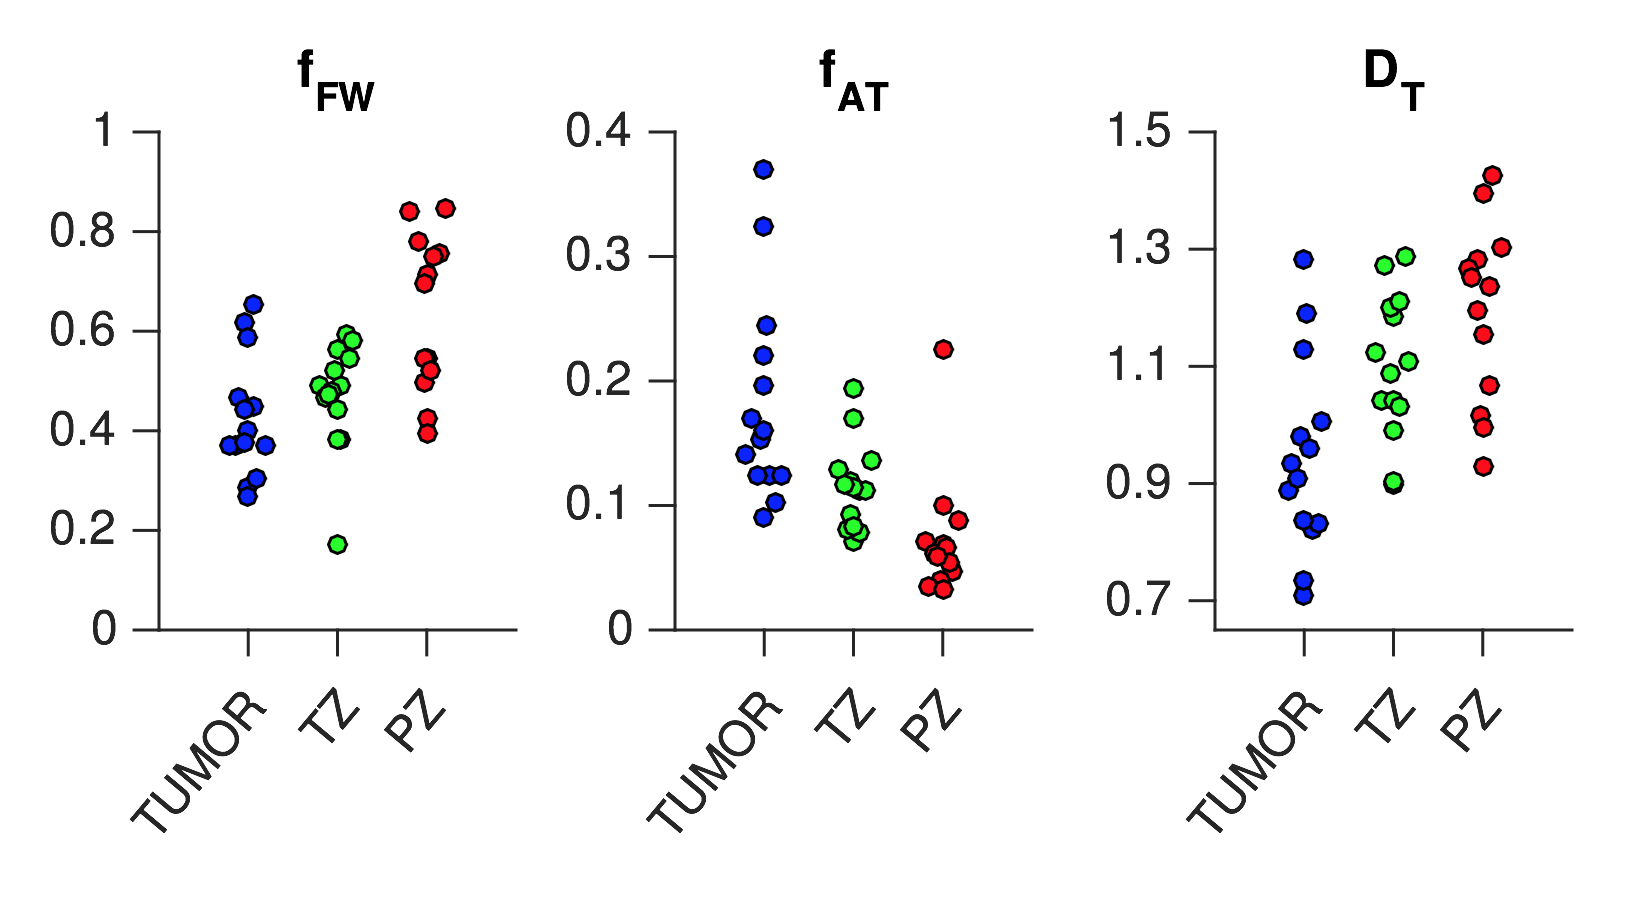
Figure 1 shows maps of the diffusion-weighted images and the three model parameters from four patients. Generally, the central parts of the prostate exhibited high microscopic anisotropy, whereas the peripheral tissue did not; although exceptions were present. The bottom row shows an example where the microscopic anisotropy appears to clearly differentiate the tumor from its surroundings. Figure 2 shows CODIVIDE parameters from regions-of-interest placed in normal appearing transition and peripheral zones (TZ and PZ), and in cancer (guided by MRI and histopathology from biopsies). The tumors exhibited a significantly higher microscopic anisotropy (e.g. fAT) than the PZ (p < 0.01, t-test n = 13). All tumors had Gleason scores of 6 or 7.Discussion
We have investigated the potential to map the microscopic anisotropy in prostate cancer. Unlike the FA from DTI, parameters such as the fAT from CODIVIDE are not confounded by the orientation coherence of the tissue. However, probing fAT requires diffusion encoding that goes beyond the conventional diffusion encoding [Stejskal1965]. By using both linear and spherical diffusion encoding [Szczepankiewic2016], we observed a microscopic anisotropy that was congruent with expectations from microimaging of excised prostate, i.e. a higher anisotropy in the TZ compared with the PZ [Bourne2016]. It was also shown that tumors might exhibit even higher levels of microscopic anisotropy. We wish to highlight three limitations of the present study. First, no low-grade cancers were included, which prevents assessment of the diagnostic potential of the technique. Second, images were acquired in low spatial resolution to permit sufficiently high SNR for the analysis, which reduce the accuracy of tumor delineation. Third, the linear and spherical tensor encodings were not interleaved, which in conjunction with non-linear motion and distortion of the prostate may bias the analyses. Future work will compare the obtained parameters to traditional ADC and FA measures to assess whether detection or grading may be improved by assessments of microscopic anisotropy.Conclusions
In this preliminary study, we demonstrated the potential to map microscopic anisotropy of the prostate in a clinical setting. Regions with cancers generally showed higher microscopic anisotropy than normal glandular tissue.Acknowledgements
No acknowledgement found.References
Bourne RM, Bongers A, Chatterjee A, Sved P, Watson G (2016) Diffusion anisotropy in fresh and fixed prostate tissue ex vivo. Magnetic Resonance Medicine 76(2):626–634.
Kozlowski P, et al. (2006) Combined diffusion-weighted and dynamic contrast-enhanced MRI for prostate cancer diagnosis--correlation with biopsy and histopathology. J Magn Reson Imaging 24(1):108–113.
Li L, et al. (2015) Correlation of gleason scores with magnetic resonance diffusion tensor imaging in peripheral zone prostate cancer. J Magn Reson Imaging 42(2):460–467.
Manenti G, et al. (2007) Diffusion tensor magnetic resonance imaging of prostate cancer. Invest Radiol 42(6):412–419.
Lampinen B, et al. (2016) Neurite density imaging versus imaging of microscopic anisotropy in diffusion MRI: A model comparison using spherical tensor encoding. NeuroImage, in revision (implementation available at https://github.com/markus-nilsson/md-dmri).
Lasic S, Szczepankiewicz F, Eriksson S, Nilsson M, Topgaard D (2014) Microanisotropy imaging: quantification of microscopic diffusion anisotropy and orientational order parameter by diffusion MRI with magic-angle spinning of the q-vector. Frontiers in Physics:1–35.
Sjölund J, et al. (2015) Constrained optimization of gradient waveforms for generalized diffusion encoding. J Magn Reson 261:157–168.
Stejskal EO, Tanner JE (1965) Spin diffusion measurements: Spin echoes in the presence of a time-dependent field gradient. J Chem Phys 42(1):288–292.
Szczepankiewicz F, et al. (2015) Quantification of microscopic diffusion anisotropy disentangles effects of orientation dispersion from microstructure: applications in healthy volunteers and in brain tumors. NeuroImage 104:241–252.
Szczepankiewicz F, et al. (2016) The link between diffusion MRI and tumor heterogeneity: Mapping cell eccentricity and density by diffusional variance decomposition (DIVIDE). NeuroImage. doi:10.1016/j.neuroimage.2016.07.038.
Uribe CF, et al. (2015) In vivo 3T and ex vivo 7T diffusion tensor imaging of prostate cancer: Correlation with histology. Magn Reson Imaging 33(5):577–583.
Figures