4944
Low-To-High b-Value DWI Ratio Image in Multiparametric MRI of the Prostate: Feasibility, Optimal Combination of b-Values, and Comparison with ADC Maps for the Detection of Prostate Cancer1Radiology, UT Southwestern Medical Center, Dallas, TX, United States
Synopsis
This study demonstrated the feasibility of generating a DWI-based image that compares the signal intensity on low versus high b-values (DWIratio image) and compared this model-independent approach to the conventional ADC map in terms of quantitative relative contrast (RC) in signal intensity between lesion and normal tissues and subjective assessment of artifacts, lesion conspicuity, and overall image quality by blinded radiologists. The DWIratio images showed significantly higher RD and lower artifacts and non-inferiority in lesion conspicuity and overall image quality. The model-independent nature of this approach has the potential to improve inter-subject and inter-vendor reproducibility of DWI data for the detection of prostate cancer when compared to ADC maps.
Purpose
The clinical interpretation of prostate multiparametric magnetic resonance imaging (mpMRI) is based on qualitative (i.e. subjective) assessment of imaging findings. The apparent diffusion coefficient (ADC) from a mono-exponential model is commonly used in clinical practice. In addition to being model- and vendor-dependent, this approach may not account for the influence of factors such as the microcirculation of blood in the capillary network on the diffusion signal decay1, therefore affecting the reproducibility of these results. In clinical practice, this is usually corrected for by reviewing the ADC map in conjunction with the changes from low to high b-value DWI images. We hypothesize that a model-independent image that compares the signal intensity of low and high b-values at a pixel-by-pixel basis would aid in the diagnosis of prostate cancer (PCa). To the best of our knowledge, the feasibility of generating such images and the impact of selecting specific b-values on image quality and diagnostic performance have not been evaluated. The goal of this study, hence, was to identify the optimal low vs. high b-value pair yielding images with better image quality and superior tumor-to-background conspicuity, and to compare these ADC maps for differentiating normal prostate tissue from cancer.Method
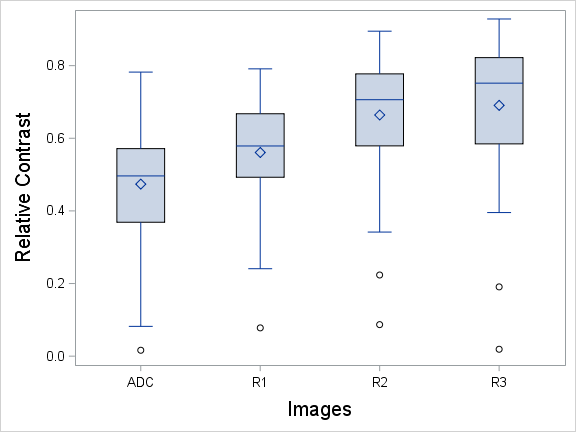
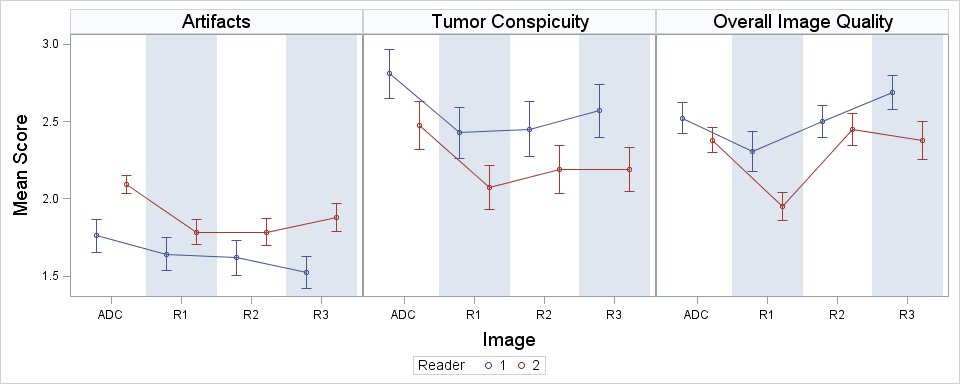
Patient Population: In this IRB-approved, HIPAA-compliant, retrospective review, 44 men with biopsy-proven PCa who underwent mpMRI of the prostate followed by radical prostatectomy between February/2014 and October/2014 were enrolled. DWIratio images were calculated as the ratio of the signals from the low b-value image over the high b-value image using a MATLAB script (b-value combinations: R1=100/1000; R2=100/1500; and R3=100/2000) (Figure 1). ADC maps were created in the MRI scanner using a mono-exponential fitting and the following b-values: 0, 100, 1000, 1500, and 2000. Quantitative analysis: Relative Contrast (RC) in signal intensity between Regions of interest (ROIs) from tumor and adjacent peripheral zone (PZ) tissue were calculated for both DWIratio image and ADC maps. RC was calculated as (tumor-PZ)/PZ. A RC of 0.6, for instance, indicates the signal intensity in the tumor is 60% lower than that in the PZ. Friedman’s two-way non-parametric analysis of variance (ANOVA) with Dunnett adjustment was used to compare the difference in RC between the various DWIratio images (i.e. R1, R2, and R3) and the ADC map. Qualitative analysis: two radiologists blinded to the image type independently rated the ADC map and DWIratio images for the presence of artifacts (lower the better), tumor conspicuity (higher the better) and overall image quality (higher the better) using a 5-point Likert scale. Agreement between the readers was assessed by weighted kappa statistics. ANOVA with Dunnett adjustment was used to compare the difference in Likert scales between DWIratio images and the ADC map. If either of the ratio images was found to have lower score than ADC on average, a non-inferiority (to ADC map) test with the null hypothesis that DWIratio images was more than 0.5 point worse in Likert scale on average was used.Result
All DWIratio images had significantly higher RC (p<0.0001, Table 1, Figure 2) and fewer artifacts (p <0.01, Table 2, Figure 3) than ADC maps. Tumor conspicuity of R2 and R3 were no more than 0.5 point on Likert scale lower than that of the ADC maps (p = 0.0128, 0.0015). All ratio images were no more than 0.5 point on Likert scale lower than ADC in overall quality (p=0.0043(R1), <0.0001(R2), <0.0001(R3)). Reader agreement for the qualitative analysis was good-excellent (weighted kappa=0.4-0.7).Discussion
To the best of our knowledge, this study is the first to demonstrate the feasibility of using DWIratio images as an alternative to the ADC map for the interpretation of DWI data. Our results indicate that images based on the difference in signal intensity between low and high b-value DWI images can be easily generated, demonstrating fewer artifacts and comparable tumor conspicuity compared to the corresponding ADC map images. In this study, b100/b1500 and b100/b2000 were the b-value combination yielding better results. One limitation of the study was the lack of assessment of this approach for characterization of (i.e., distinguishing indolent from aggressive) PCa.Conclusion
The DWIratio images are model-independent alternative to ADC maps for the interpretation of DWI data in the context of prostate mpMRI. The model-independent nature of this approach has the potential to improve inter-subject and inter-vendor reproducibility of DWI data for the detection and characterization of PCa when compared to ADC maps.Acknowledgements
No acknowledgement found.References
1. Yuan, Q., Costa, D. N., Senegas, J. et al.: Quantitative diffusion-weighted imaging and dynamic contrast-enhanced characterization of the index lesion with multiparametric MRI in prostate cancer patients. J Magn Reson Imaging, 2016
2. Oto, A., Yang, C., Kayhan, A. et al.: Diffusion-weighted and dynamic contrast-enhanced MRI of prostate cancer: correlation of quantitative MR parameters with Gleason score and tumor angiogenesis. AJR Am J Roentgenol, 197: 1382, 2011
3. Gibbs, P., Liney, G. P., Pickles, M. D. et al.: Correlation of ADC and T2 measurements with cell density in prostate cancer at 3.0 Tesla. Invest Radiol, 44: 572, 2009
4. Zelhof, B., Pickles, M., Liney, G. et al.: Correlation of diffusion-weighted magnetic resonance data with cellularity in prostate cancer. BJU Int, 103: 883, 2009
Figures
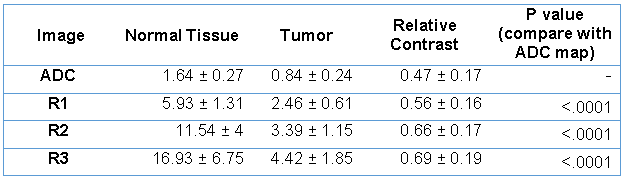
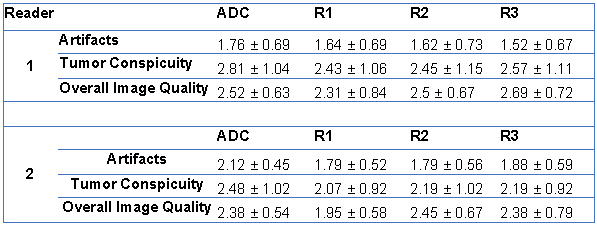
Table 2 – Mean ± standard deviation qualitative Likert scores for ADC and DWIratio images respectively.
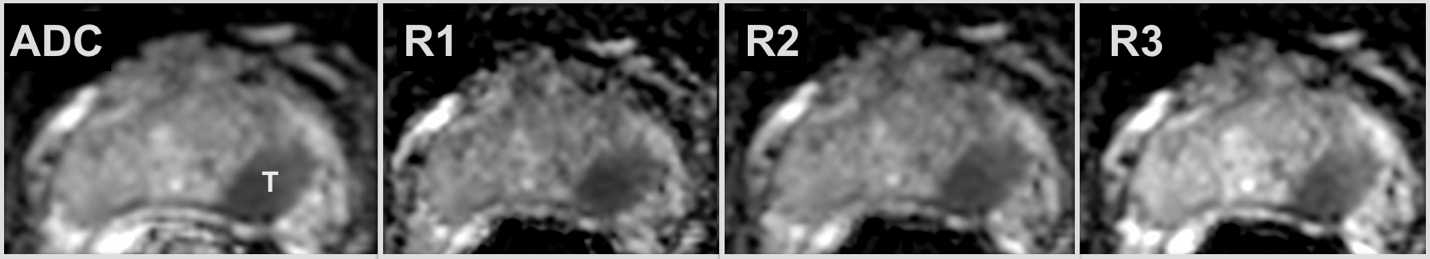
Figure 1 – DWIratio images and ADC map. In this 64-year-old man on active surveillance for Gleason 3+3 PCa, MRI revealed a highly suspicious lesion in the left mid peripheral zone which was confirmed at surgery to be a Gleason 3+4 PCa with 1.4 cm. Note the overall similar appearance of the images and, subjectively, the comparable tumor (T) conspicuity.