4943
Fine-tuned Deep Convolutional Neural Network for Automatic Detection of Clinically Significant Prostate Cancer with Multi-parametric MRI1Department of Radiological Sciences, University of California, Los Angeles, Los Angeles, CA, United States, 2Physics and Biology in Medicine IDP, University of California, Los Angeles, Los Angeles, CA, United States, 3School of Electronics Information and Communications, Huazhong University of Science and Technology, Wuhan, People's Republic of China
Synopsis
A deep convolutional neural network (CNN) based automatic classification system to distinguish between indolent and clinically significant prostate carcinoma using multi-parametric MRI (mp-MRI) is proposed. By applying data augmentation, 138 lesions were used to fine-tune the pre-trained CNN model called
Purpose
Multi-parametric MRI (mp-MRI) provides valuable information for prostate cancer (PCa) detection and grading.1 However, the current standardized scoring systems, including PI-RADS v21, have limited ability to be correlated with Gleason Score. Texture analysis based grading systems could achieve reasonably accurate results2, but features from the texture analysis may not utilize all the mp-MRI information. Deep convolutional neural network (CNN) algorithms, or deep learning, could generate deep and rich features from mp-MRI3 and has great potential to improve the grading performance. In this work, we apply sufficient fine-tuning4 to the pre-trained CNN, OverFeat5, to overcome a massive labeled training data requirement and to achieve robust prediction performance. We compare the proposed approach with pre-trained CNN5, texture analysis2, and PI-RADS v21 using the whole-mount histopathology correlation as ground truth.Methods
With IRB approval, 130 prostate cancer patients who were scanned at 3.0T MRI (Skyra and Trio, Siemens Healthcare) before radical prostatectomy are included in this study. Each mp-MRI study, including T2-weighted (T2w), DWI and DCE images, was correlated with whole-mount histopathology by experienced genitourinary pathologists, and lesions were matched with respect to location, size and Gleason Score (GS). A total of 178 lesions in both peripheral and transition zones were identified, including 91 indolent and 87 clinically significant (CS) sub-cohorts. Indolent PCa cases were defined as GS smaller than seven (GS ≤ 6) and CS PCa ones larger or equal to seven (GS ≥ 7).
For relatively limited data sets, fine-tuning is considered instead of training a CNN from scratch, as fine-tuning could keep the high-level knowledge of images embedded in the pre-trained CNN. Figure 1 illustrates our proposed framework from training the system to testing the performance.
From all 178 lesions, 138 lesions were randomly selected from the lesion pool as a training set and the remaining 40 lesions were treated as a testing set. All slices of each lesion were separately contoured in T2w, ADC and DCE (Ktrans) images, and a square region of interest (ROI) containing the lesion was rescaled and resized to 221×221 RGB images, as shown in Figure 2. Data augmentation was then applied to the training set to enhance the variety of the data, increasing the robustness of the system. After the data augmentation, 2800 T2w, 3300 ADC and 2500 Ktrans images were used to fine-tune the pre-trained CNN, resulting in three fine-tuned models (ModelfCNN). Similarly, to compare with the pre-trained CNN model, training sets without data augmentation were used to train three linear SVM models to give prediction using deep features from pre-trained CNN (ModelpCNN).
To generate the testing set, the most representative slices were selected to evaluate the performance of our proposed system and other systems. ModelfCNN and ModelpCNN were applied on the testing set to get predicted probabilities of each modality respectively, and those predicted probabilities were taken as features from fine-tuned model (ffCNN ) and from the pre-trained model (fpCNN) for further evaluation. Also, since it is shown that texture features based system perform well in a similar task2, we would like to generate texture features in our data to compare with. Based on previous studies, the following features are calculated for each slice in testing set (ftexture): first order statistical feature contains average ADC, lowest 10th percentile ADC, average Ktrans, highest 10th percentile Ktrans, skewness-of-intensity histogram and ROI size in T2w images. Haralick features include contrast, correlation, energy, homogeneity and entropy computed within the lesion for each modality. RBF SVM and five-fold cross validation are applied to each set of features (ffCNN, f pCNN and ftexture ) on the testing set to integrate features and to evaluate each system. Also, to compare our proposed system with radiologists’ scoring system, PI-RADS v2 scores (1-5) for testing set lesions were extracted from radiology reports.
Results and Discussion
Table 1 contains the average performance of all systems, and our proposed system provides the best prediction results considering accuracy, area under curve (AUC), sensitivity and specificity. Figure 3 shows the receiver operating characteristic (ROC) curves. The proposed system achieved the best performance. Those results show that fine-tuned CNN models are more robust compared to pre-trained CNN model and that fine-tuned CNN could provide more representative features compared to texture features. The proposed system also performs better than PI-RADS v2 standards.Conclusion
We use data augmentation and fine-tuning on a pre-trained CNN to develop an effective and reliable framework to improve mp-MRI-driven classification of indolent vs. clinically significant PCa. This model is proved to perform better than existing models and PI-RADS v2 standards on our 40 cases (80 slices) testing dataset.Acknowledgements
No acknowledgement found.References
[1] ACM. Pi-Rads Prostate Imaging - Reporting and Data System. Am Coll Radiol. 2015. http://www.acr.org/~/media/ACR/Documents/PDF/QualitySafety/Resources/PIRADS/PIRADS V2.pdf. 2.
[2] Fehr D, Veeraraghavan H, Wibmer A, et al. Automatic classification of prostate cancer Gleason scores from multiparametric magnetic resonance images. Proc Natl Acad Sci. 2015:201505935. doi:10.1073/pnas.1505935112. 3.
[3] LeCun Y, Bengio Y, Hinton G. Deep learning. Nature. 2015;521(7553):436-444. http://dx.doi.org/10.1038/nature14539. 4.
[4] Tajbakhsh N, Shin JY, Gurudu SR, et al. Convolutional Neural Networks for Medical Image Analysis: Full Training or Fine Tuning? IEEE Trans Med Imaging. 2016;35(5):1299-1312. doi:10.1109/TMI.2016.2535302
[5] Sermanet P, Eigen D, Zhang X, Mathieu M, Fergus R, LeCun Y. OverFeat: Integrated Recognition, Localization and Detection using Convolutional Networks. 2013. http://arxiv.org/abs/1312.6229.
Figures
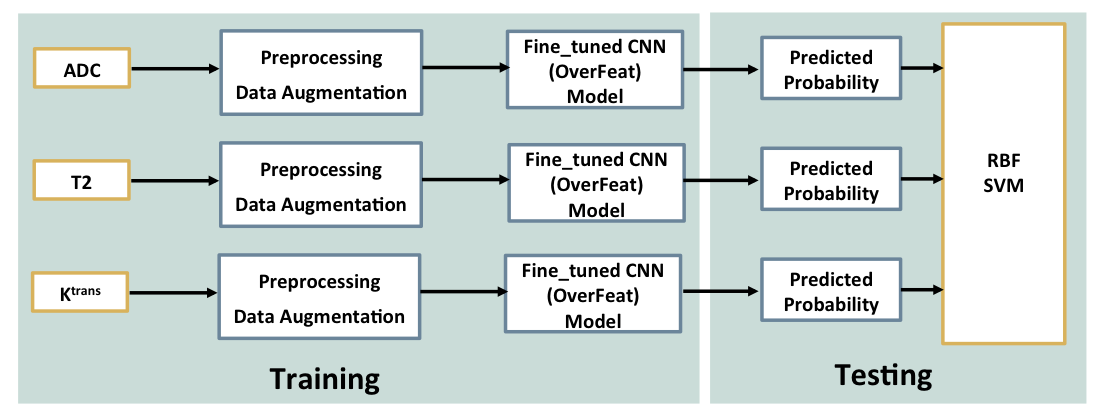
Figure 1. Illustration of the proposed classification method.
In training process, after pre-processing and data augmentation, training images of each modality were used to fine-tune the Overfeat model, resulting in three updated CNN models respectively (ModelfCNN ) to give reliable predictions.
To integrate predictions (ffCNN ) from three fine-tuned models and to evaluate the pre-trained CNN performance on a separate testing set, radial basis function (RBF) SVM was used.
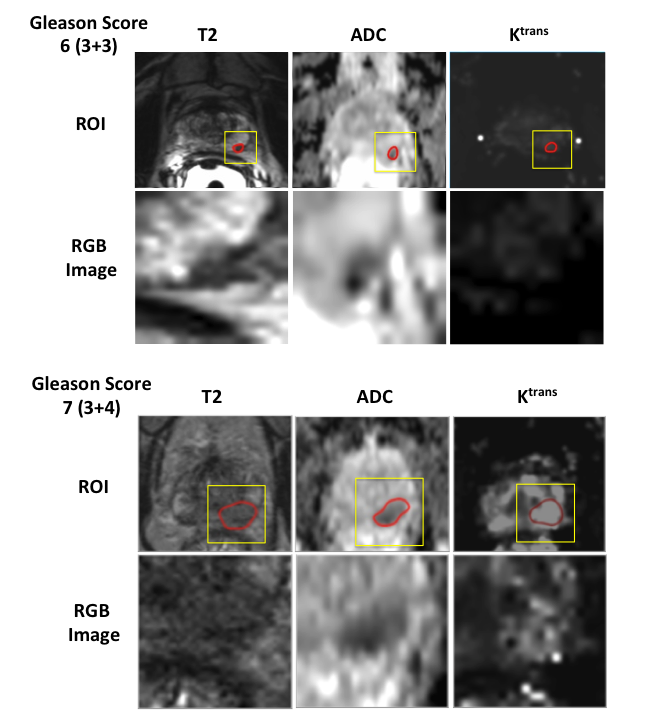
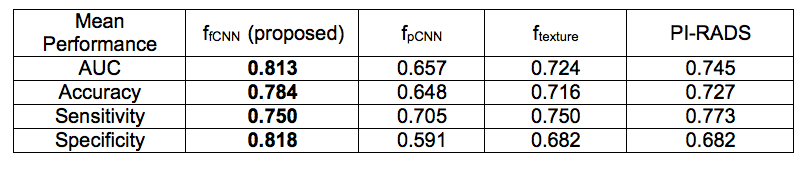
Figure 3. Summary of mean classification performance of five-fold cross validation on the testing set. (Bolded numbers represent the highest value for each metric).
Our proposed system provides the best prediction results considering accuracy, area under curve (AUC), sensitivity and specificity.
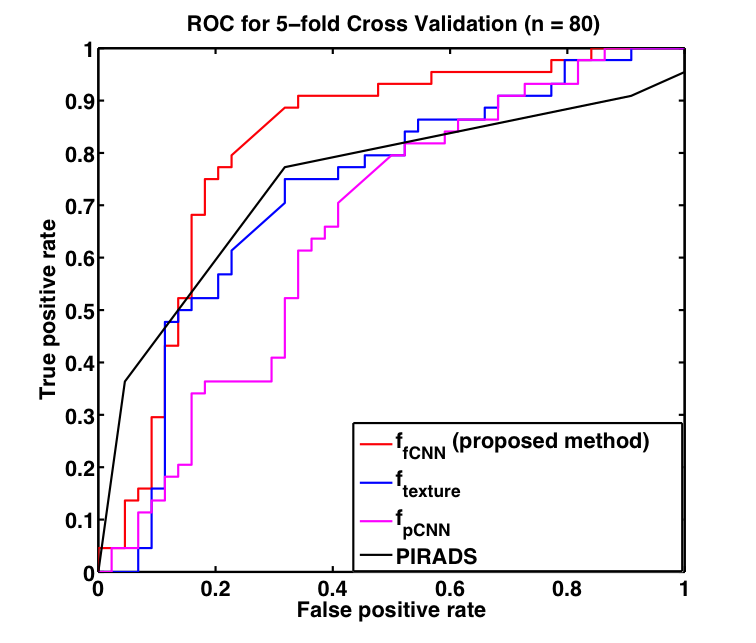
Figure 4. ROC curves of fine-tuned CNN based system (ffCNN), pre-trained CNN based system (f pCNN), texture features based system (ftexture ) and PI-RADS v2.
The proposed fine-tuned CNN based system (red) achieved the best performance.