4941
Development of Robust Texture Parameters for Characterizing Normal Breast Parenchymal Patterns1Tu & Yuen Center for Functional Onco-Imaging, University of California, Irvine, Irvine, CA, United States, 2E-Da Hospital and I-Shou University, 3Tzu-Chi General Hospital, Taichung, Taiwan, 4Taichung Veterans General Hospital, Taichung, Taiwan
Synopsis
The non-fat-sat T1-weighted breast MRI of 57 normal healthy women were analyzed. In order to test the robustness of parameters we compared the texture analyzed from the ROI’s of different sizes as the largest cuboid that can fit within the breast and cover 30%, 40%, and 50% of fibroglandular tissue slices. 21 texture features were selected as robust features that were not greatly affected by the cuboid ROI size. The concordance correlation coefficient of the percent density between bilateral breasts was very high, 0.98. Of all texture parameters, “Information Measure for Correlation (IMC)” and “Contrast” show the highest ccc, 0.90-0.98.
Purpose
The bilateral breasts of healthy women are considered symmetrical, and this is often used as the basis for diagnosis of breast cancer. Morphologically, breast asymmetry can be defined as a difference in the shape, volume, and relative distribution of different tissues (including normal adipose and fibroglandular tissues). The texture features can characterize the mixture distribution pattern of fatty and fibroglandular tissues. There is little data in the literature about the robust texture features of breast tissues that can be quantitatively measured. The purpose of this study is to evaluate the robustness and symmetry in normal breasts of healthy women using quantitative parameters analyzed on 3D MRI. In this study we obtain the texture parameters within a cuboid box of different sizes, placed at the center of mass of the whole breast (excluding axillary tail). The volume and texture parameters analyzed from the left and right breasts of the same women were compared to evaluate symmetry. Breast density is known as an independent risk factor for development of breast cancer. The volumetric and texture parameters that are robust and can be measured reliably may have a potential to provide biomarkers for prediction of cancer risk, or for early detection of abnormality in the diseased breast.Method
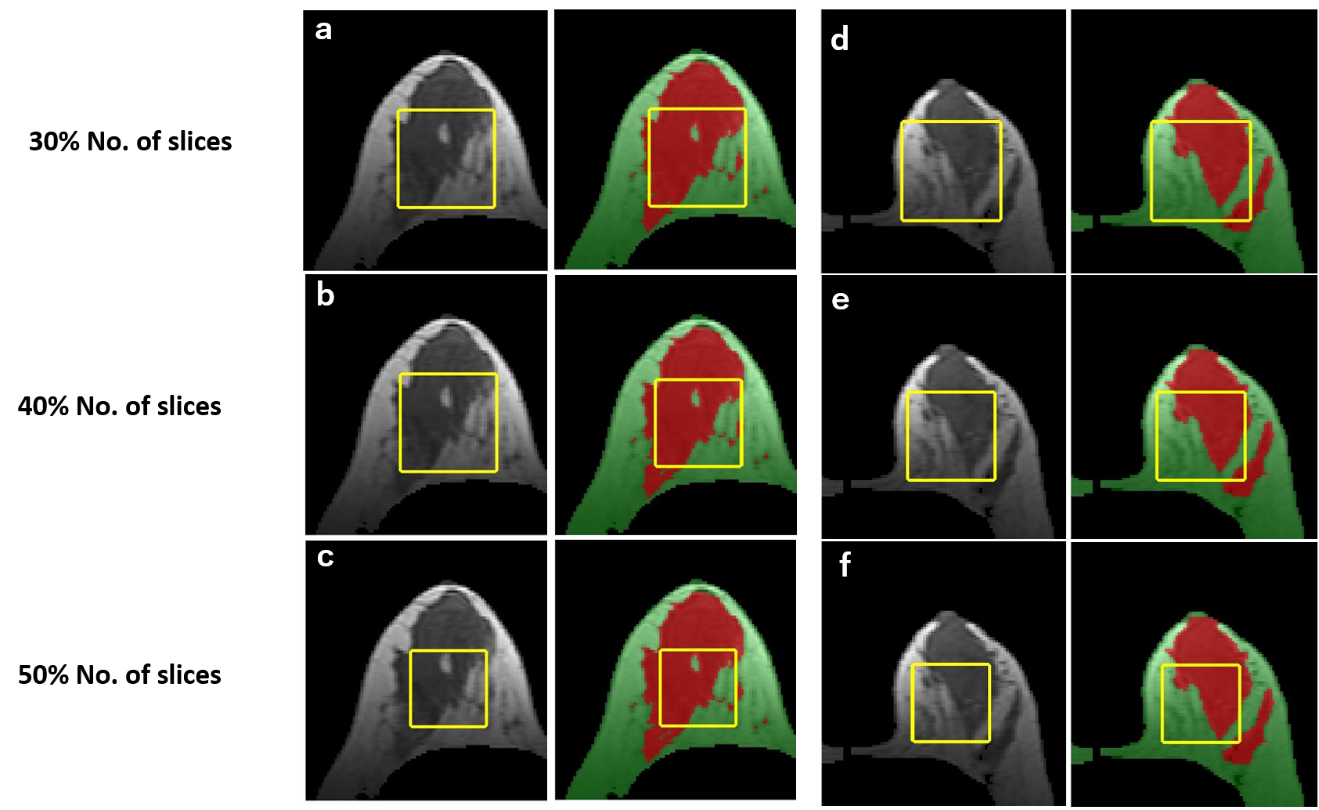
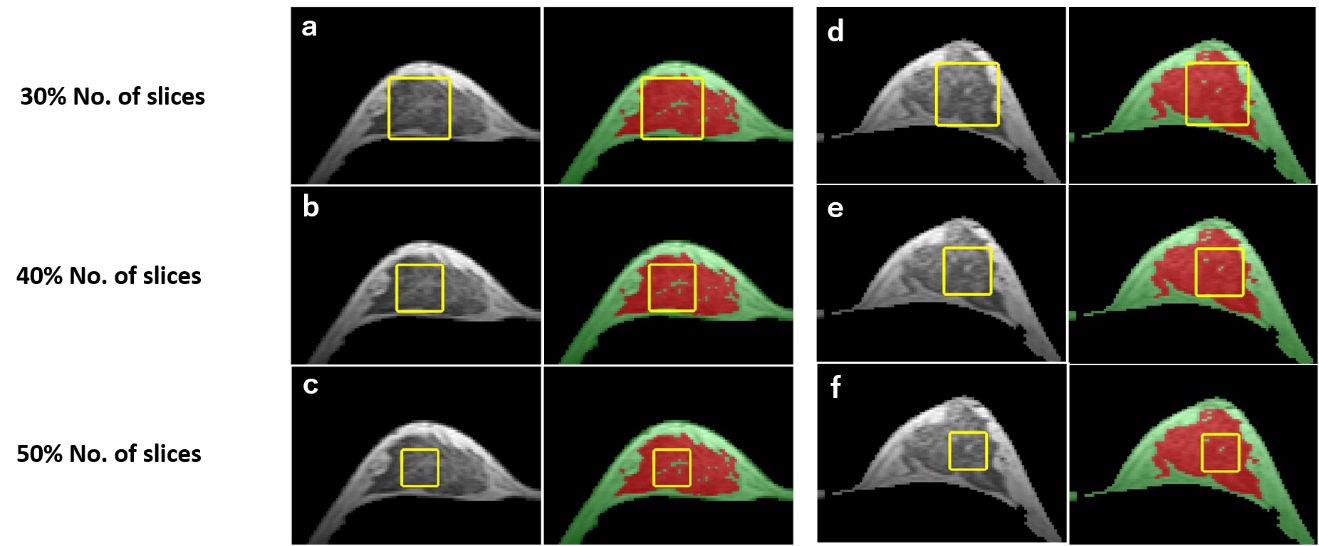
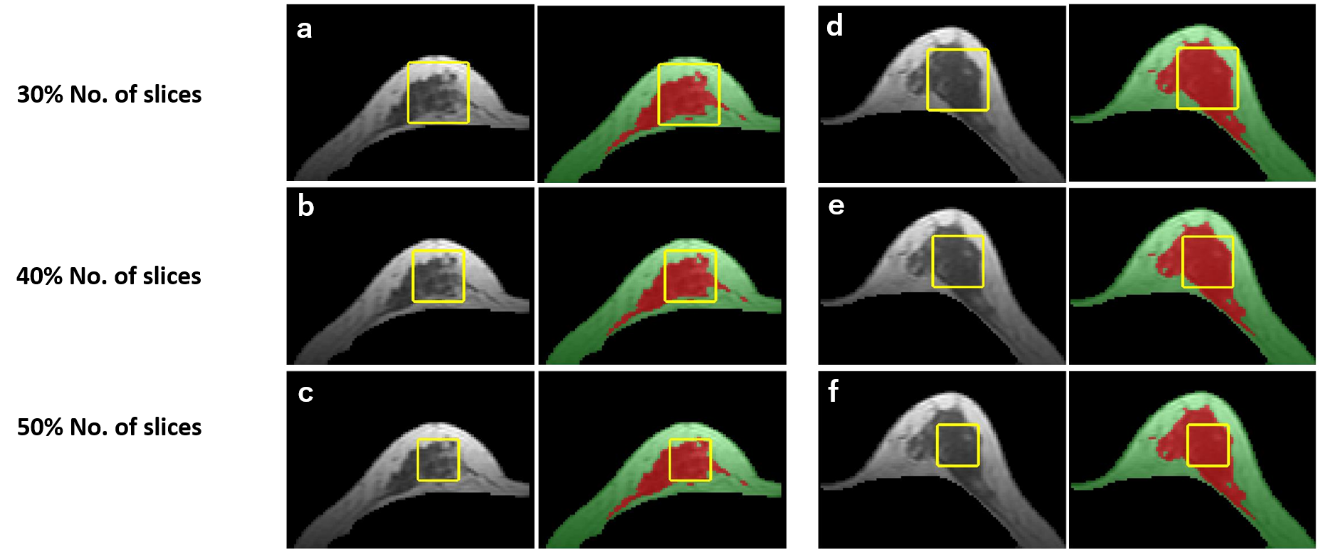
Fifty-seven healthy Asian women (mean age 35) were recruited into this study. A comprehensive computer-assisted program1 was applied to segment the breast and the fibroglandular tissue within the breast. An additional procedure was applied to remove the axillary tail, to allow the texture analysis centered within the breast. Then a standardized method was applied to place a cuboid ROI inside a breast. First of all, the center of mass of the breast was calculated. The cuboid was selected to cover 30%, 40% and 50% of axial slices that contained the segmented fibroglandular tissue. Then within the selected breast region, a largest square that can fit within the selected breast region was generated. Three case examples with different shapes of breasts are shown in Fig. 1-3. In each case three cuboid that fit within 30%, 40%, and 50% number of slices are shown. It is clearly seen that the size of the cuboid box on axial view becomes smaller when the number of covered slices increases from 30% to 50%.In this study, the breast volume, the fibroglandular tissue volume, and the percent density (PD) were measured. Inside each cuboid ROI, 50 texture features were calculated by using GLCM2, GLRLM3,4, GLSZM3,4 and NGTDM5. The 2D texture features were extracted from axial, coronal and sagittal views on each slice, and then averaged over all covered slices. In addition, the 3D texture features were calculated.Results
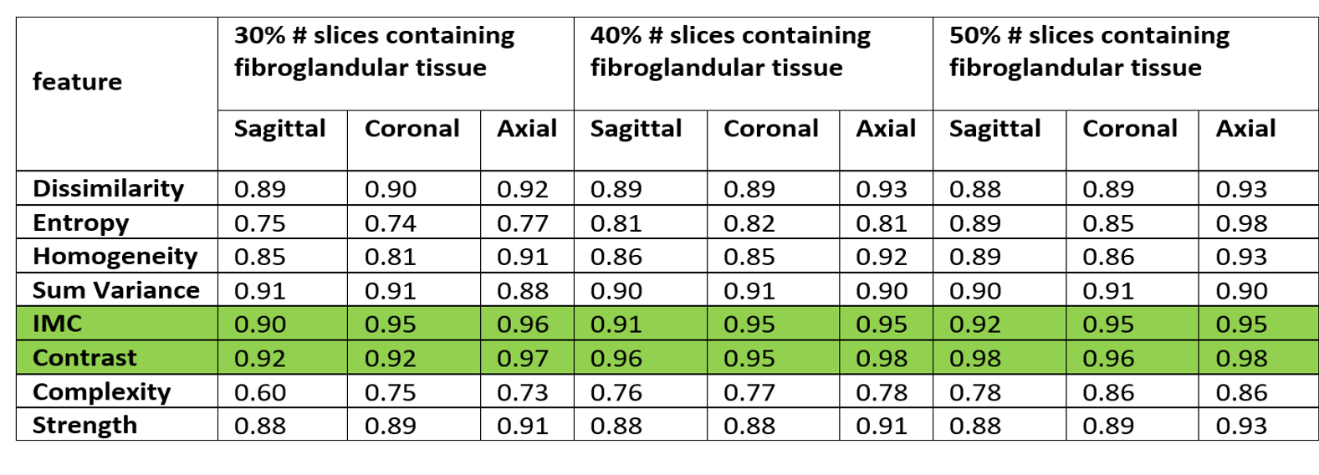
Firstly, texture parameters measured from the cuboid ROI’s covering 30%, 40%, and 50% slices that showed a small difference were selected as robust parameters by applying one-way ANOVA. The ANOVA test has the null hypothesis that samples in two or more groups are drawn from populations with the same mean values. By this method, 21 texture features (with p-value >0.05) were chosen and considered as robust features that were not greatly affected by the size of the cuboid ROI within the breast. The bilateral symmetry of the parameters between the left and the right breasts of the same woman was evaluated by using concordance correlation coefficient (ccc). The ccc of the percent density between the left and the right breasts was very high, 0.98. The ccc of 8 texture parameters analyzed from cuboid ROI’s that cover 30%, 40%, and 50% fibroglandular tissue slices are shown in Fig. 4. “Information Measure for Correlation (IMC)” and “Contrast” show the highest ccc, suggesting that they are the most symmetric texture parameters. The texture features calculated from 3D region had relatively low ccc, which might be due to the fact that 3D texture features were more sensitive to the changes of intensities and shapes within the ROI.Discussion
We
have presented a method to analyze the texture feature of the normal breast
parenchymal pattern shown on 3D MRI. In order to test the robustness of the obtained parameters we
compared the texture analyzed from the ROI’s of different sizes as the largest
cuboid that can fit within the breast and cover 30%, 40%, and 50% of
fibroglandular tissue slices. As the contralateral normal breast, usually
considered as a mirror of the other breast, is often used for comparison in the
diagnosis, the robust texture parameters as analyzed in this work may be
included in development of computer-aided-diagnosis methods.Acknowledgements
This work was supported in part by NIH/NCI grants R01 CA127927, R21 CA170955 and R03 CA136071.References
1. Lin M, Chen J-H, Wang X, Chan S, Chen S, Su M-Y. Template-based automatic breast segmentation on MRI by excluding the chest region. Medical Physics. 2013;40(12):122301. doi:10.1118/1.4828837.
2. Haralick R, Shanmugam K, and Dinstein I, Textural Features for Image Classification, IEEE Transactions on Systems, Man, and Cybernetics, vol. SMC-3, no. 6, pp. 610-621, Nov. 1973. doi: 10.1109/TSMC.1973.4309314
3. Galloway M, Texture analysis using gray level run lengths, Computer Graphics and Image Processing, Volume 4, Issue 2, 1975, Pages 172-179, ISSN 0146-664X
4. Thibault, G., Fertil, B., Navarro, C., Pereira, S., Cau, P., Levy, N., Sequeira, J. and Mari, J.J., Texture indexes and gray level size zone matrix application to cell nuclei classification. 2009
5. M. Amadasun and R. King, Textural features corresponding to textural properties, in IEEE Transactions on Systems, Man, and Cybernetics, vol. 19, no. 5, pp. 1264-1274, Sep/Oct 1989. doi: 10.1109/21.44046
Figures