4937
Locally altered lipid profiles: a hallmark of breast cancer metabolism?1GE Global Research Center, Niskayuna, NY, United States, 2Memorial Sloan Kettering Cancer Center, New York City, NY, United States
Synopsis
Cancer cells are known to produce their own fatty acids (FA’s) and co-opt local fat reserves for energy/cell division needs. In this study, single-voxel MRS data were used to assess the spatial/spectral lipid profiles of normal volunteers and subjects with suspicious lesions. Statistically different lipid profiles were found in tumors than in the contralateral breast of cancer patients; the latter were similar to lipid profiles of normal volunteers. Fibrocystic epithelial/breast cancer cell NMR experiments confirmed differential FA composition/uptake for the two cell types. MRI/MRS-based profiling of lipid metabolism may provide a unique tool for better breast cancer tumor detection/characterization.
Introduction
Historically, fat information from MRI exams is seldom used for diagnostic purposes. In fact, significant effort is invested towards improving fat suppression and producing fat-free images and spectra1-3. Accumulating evidence, however, points to the dynamic nature of lipid profiles, which can change during the menstrual cycle4, carcinogenesis5 and gene therapy6. Since cancer cells are known to produce their own fatty acids (FA’s) and co-opt fat reserves from the local micro-environment for energy and cell division needs7, this in vivo MRS study will test the hypothesis that changes in lipid metabolism/composition may be detectable locally, in the tumor areas, or globally in breast cancer patients-- compared to normal, age-matched controls. Through controlled cell culture/NMR experiments, this study also aims to determine if different FA metabolism/uptake is exhibited by breast cancer cells compared to fibrocystic mammary epithelial cells.Methods
In vivo experiments: Single voxel MRS data were acquired on a 3T, MR750 scanner, using an 8-channel breast coil. A STEAM sequence (TE/TR=14/1500ms, 64 averages) was optimized to acquire fat composition data from 1-3 single voxels (1-2cc) per subject. 23 patients with suspicious breast lesions and 27 age-matched normal volunteers were studied. A single voxel was placed over glandular tissue in normal volunteers; data from three voxels were acquired in cancer patients (over the tumor/adjacent to the tumor/in the contralateral breast, respectively).
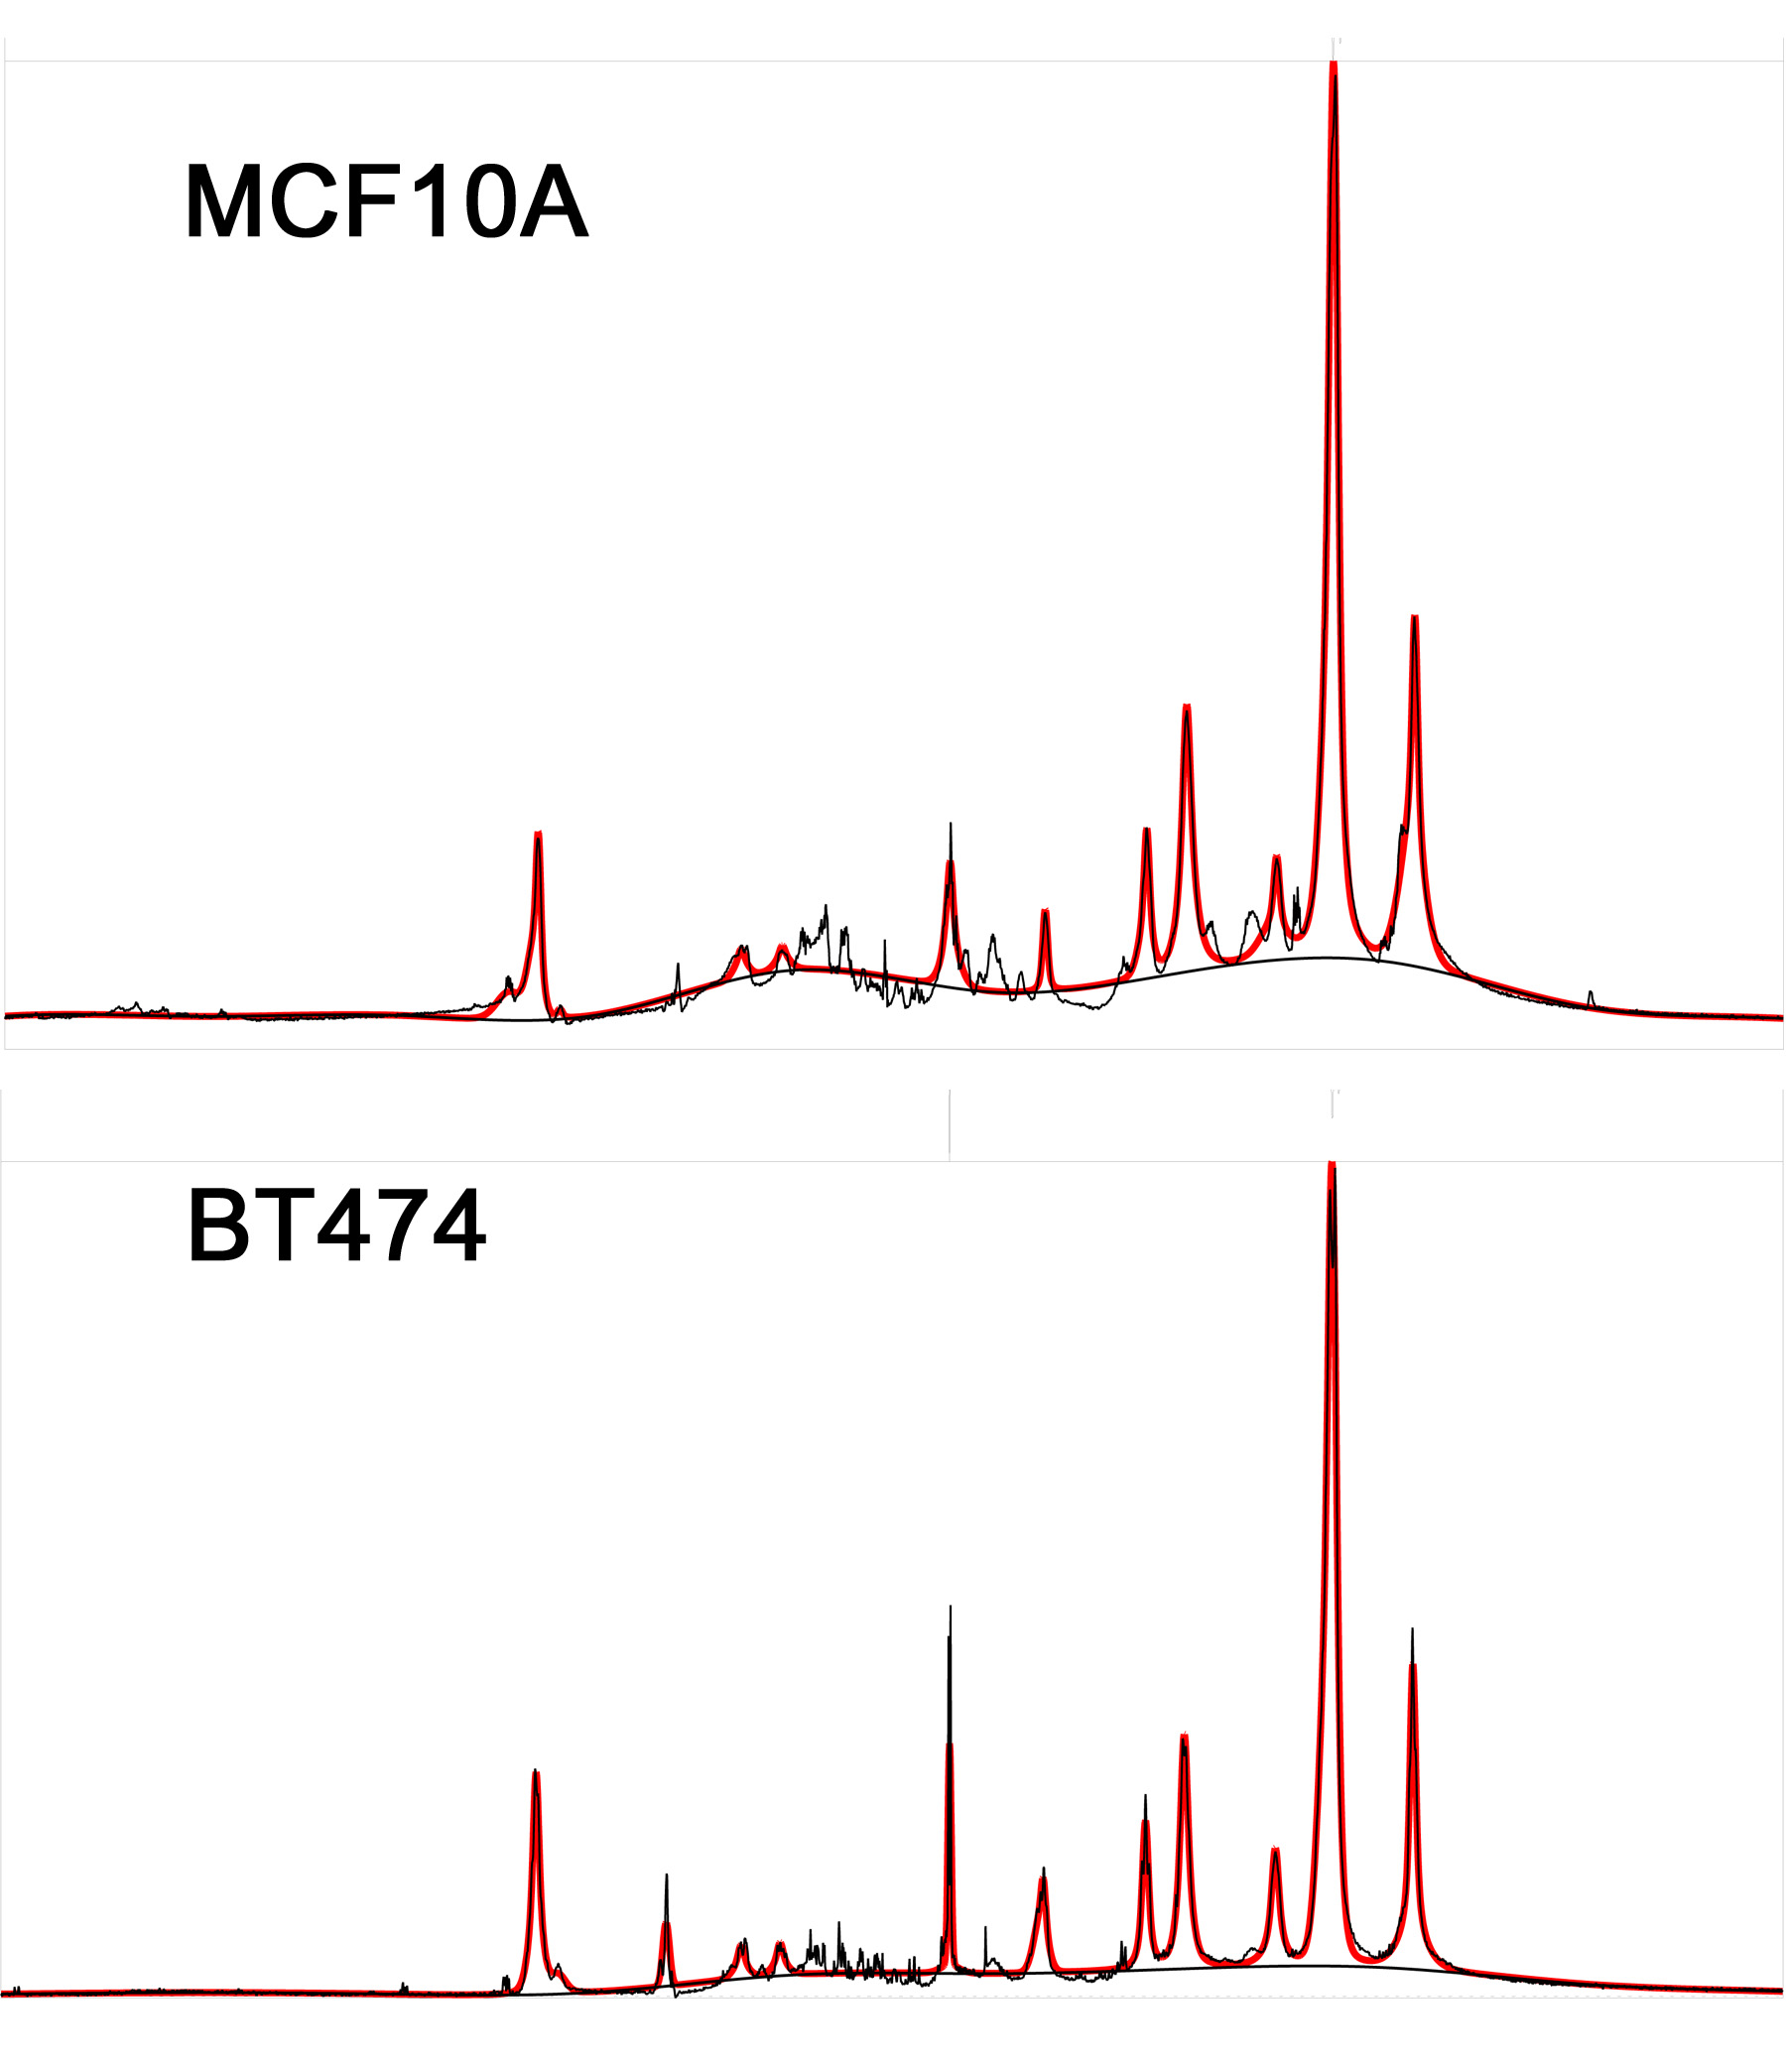
Cell and NMR experiments: BT474 invasive ductal carcinoma cells (HER2+/ER+) were cultured in DMEM high glucose medium; MCF10A fibroadenoma cells were also cultured as previously described8; both were split in three. One part continued to receive their typical culture media, while the others received culture media enriched in unsaturated/saturated fats, respectively9-10. After 16 hours of differential feeding, the samples were washed, suspended in D2O and scanned on a Bruker 400 spectrometer.
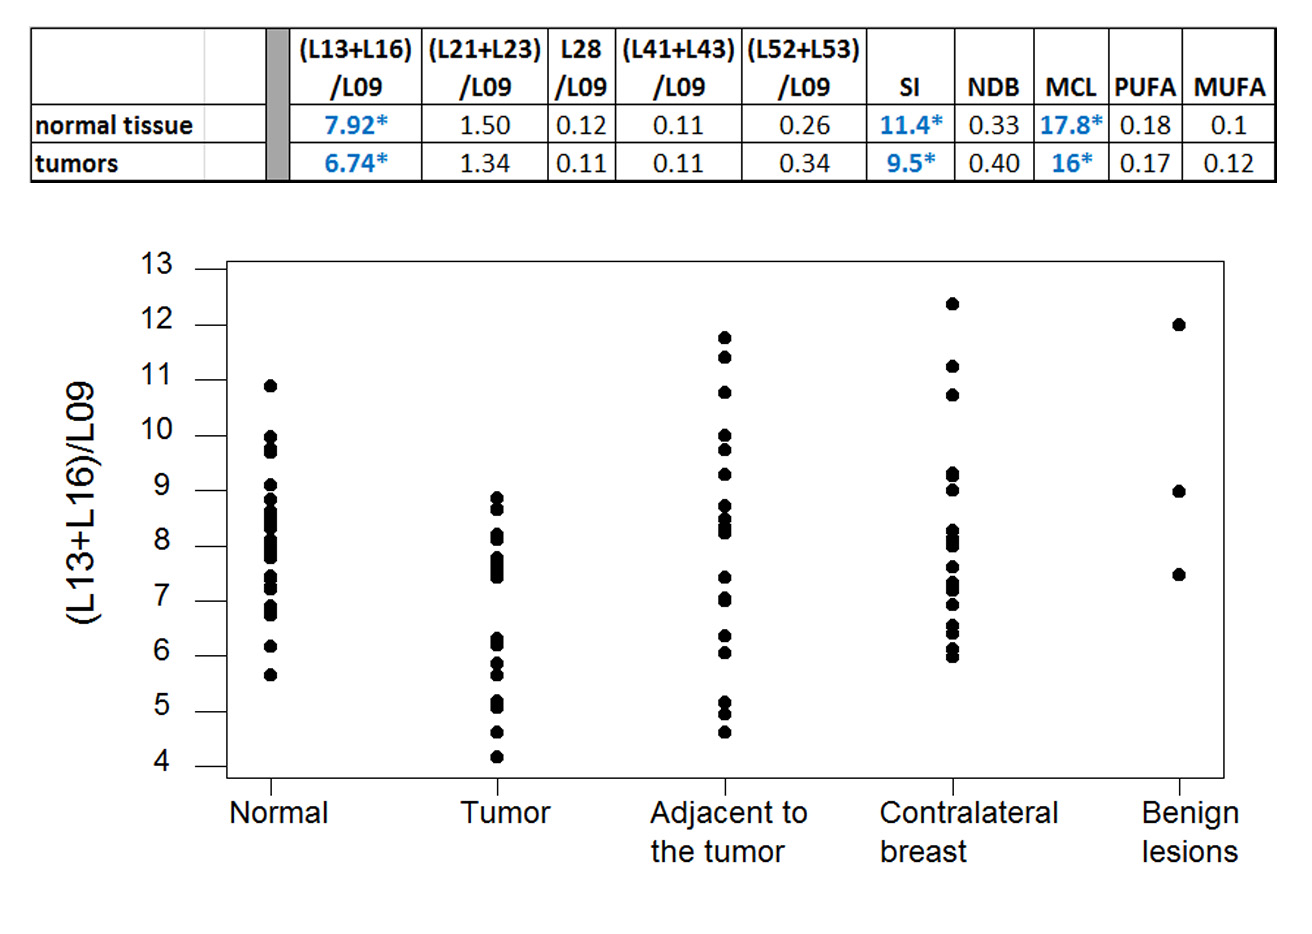
Data analysis: Both data set types were quantified using LCModel, using the same basis set. Fat peaks at 1.3+1.6ppm (L13+L16), 2.1+2.3ppm (L21+L23), 2.8ppm (L28), 4.1+4.3ppm (L41+L43) and 5.2+5.3ppm (L52+L53) were expressed as ratios to the CH3 peak (L09); this peak was found to be stable throughout the menstrual cycle4 and carcinogenesis5. The saturation index (SI), number of double bods (NDB), mono and polyunsaturated fatty acids (MUFA and PUFA), and mean chain length (MCL), were also computed11.
Minitab was used for statistical data analysis, which included Pearson correlation tests, t-tests and one-way ANOVAs.
Results and Discussion
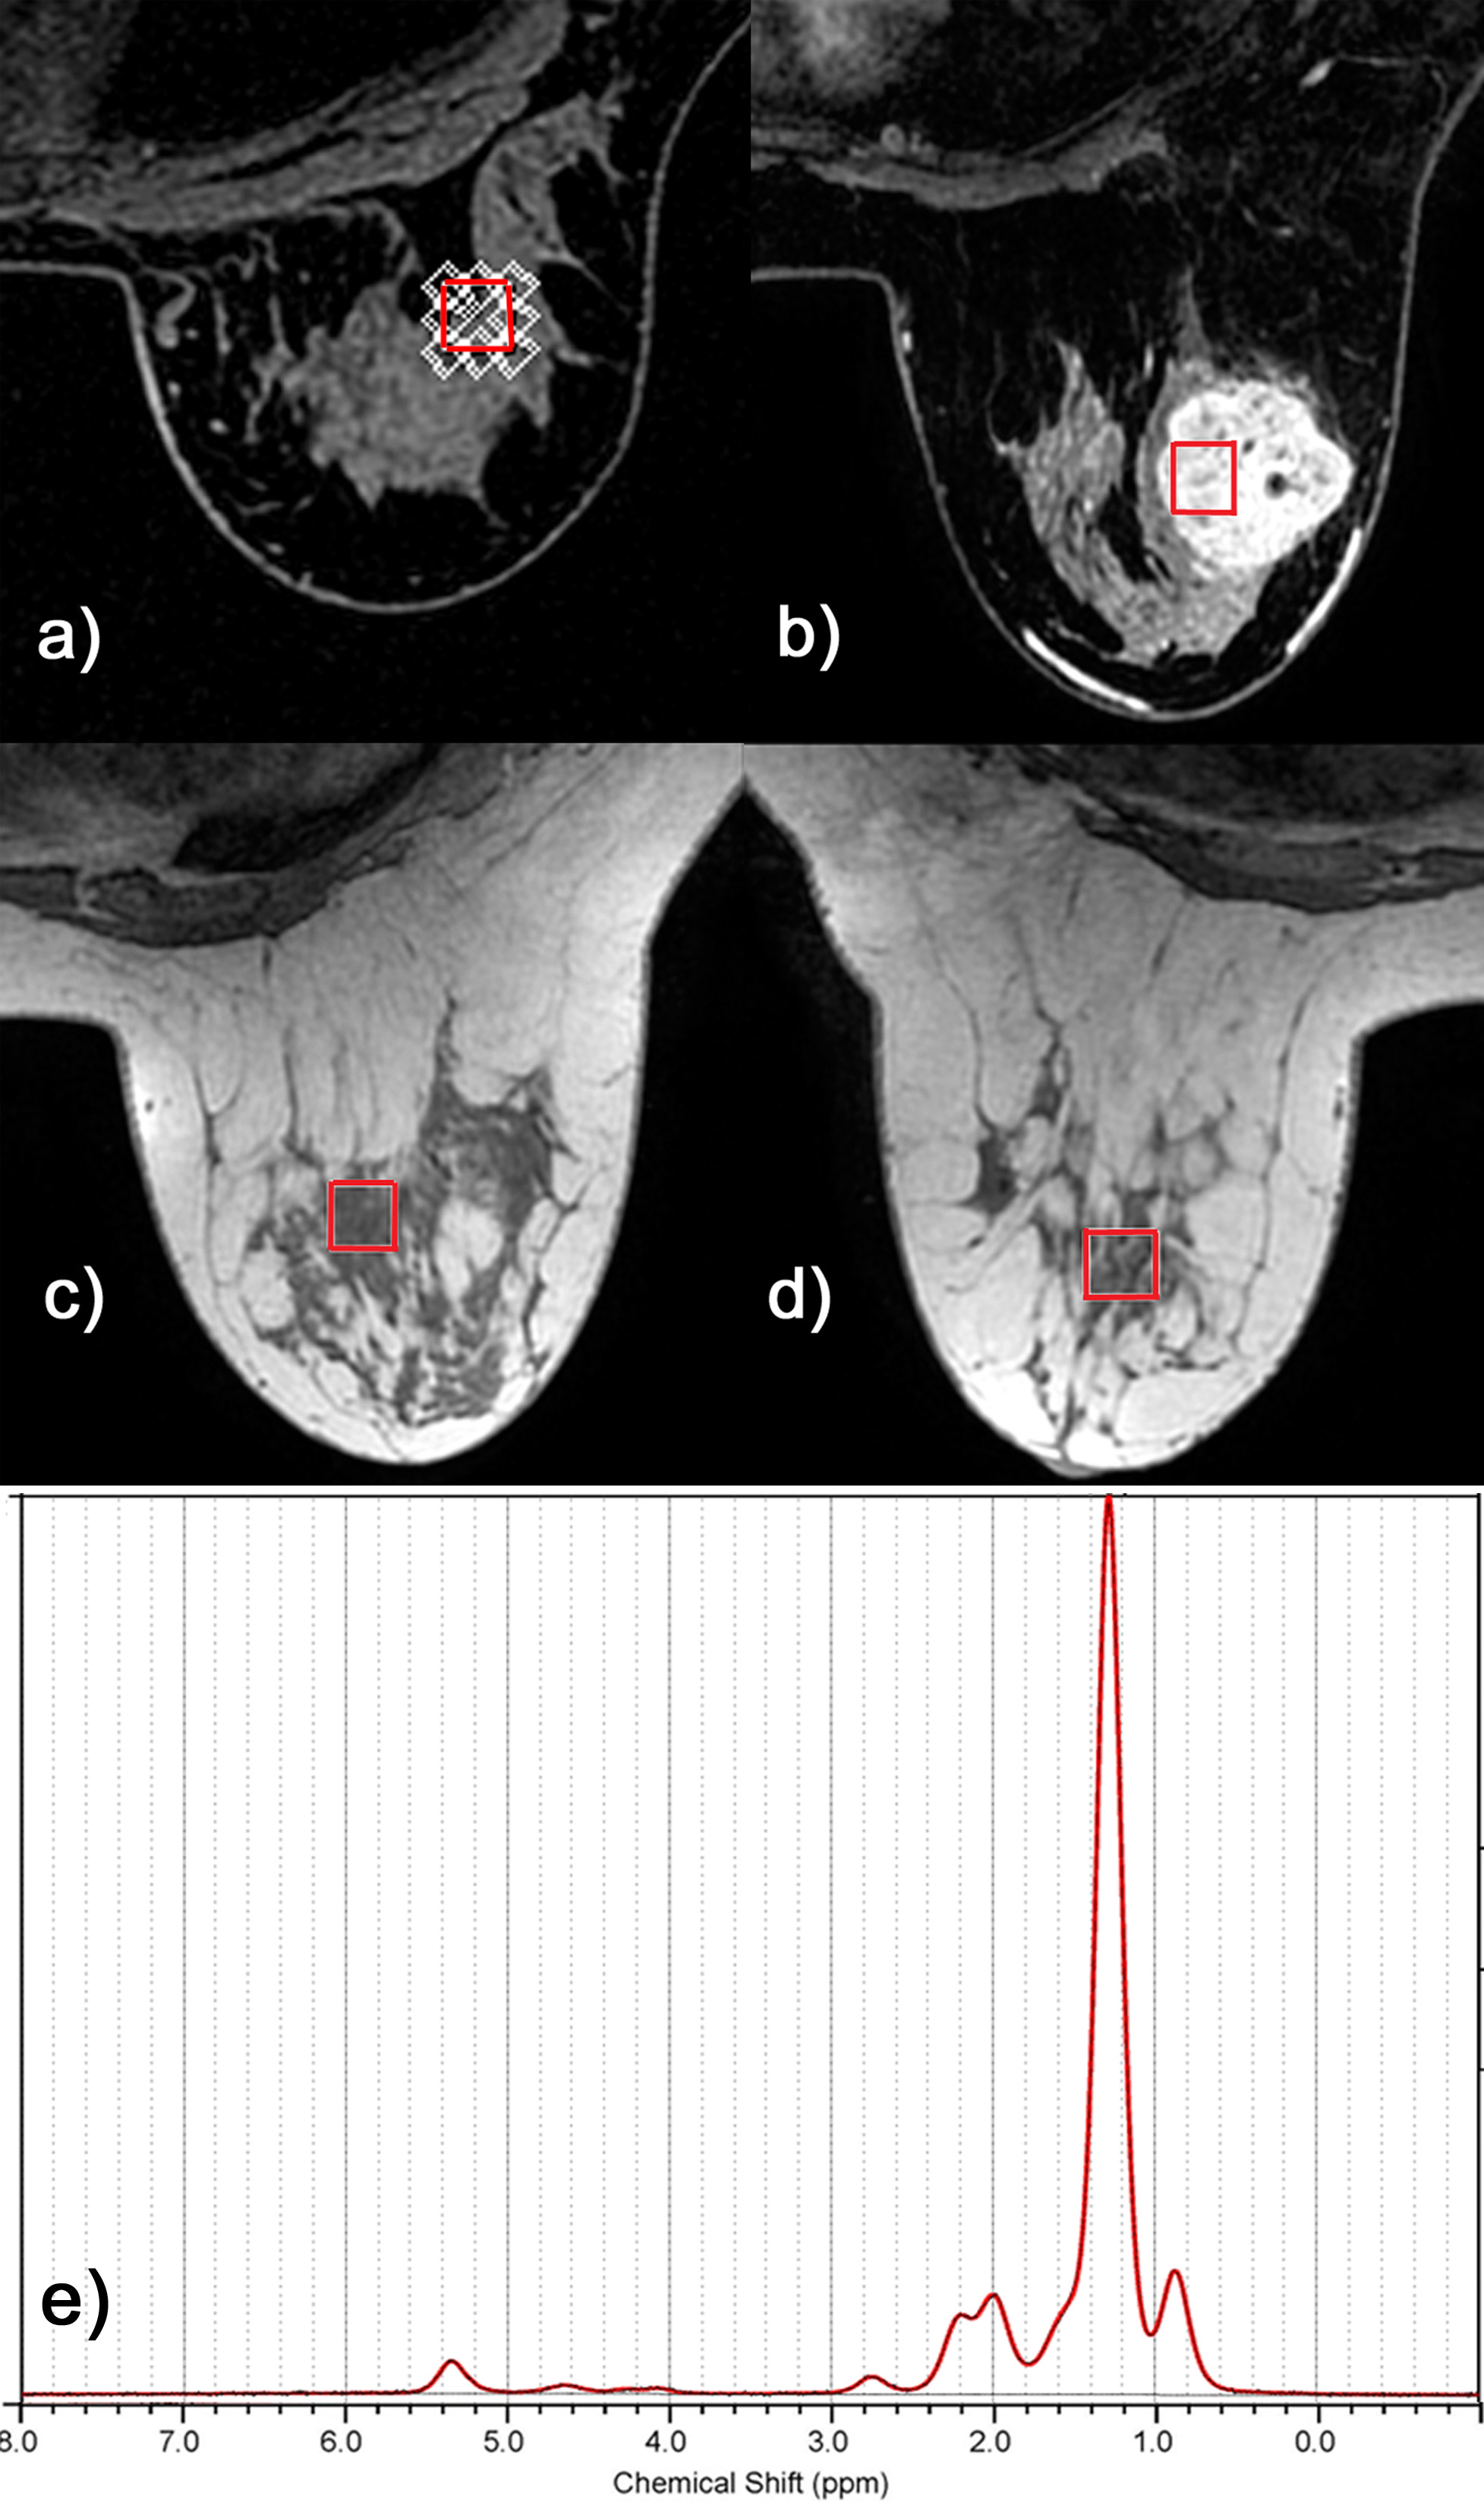
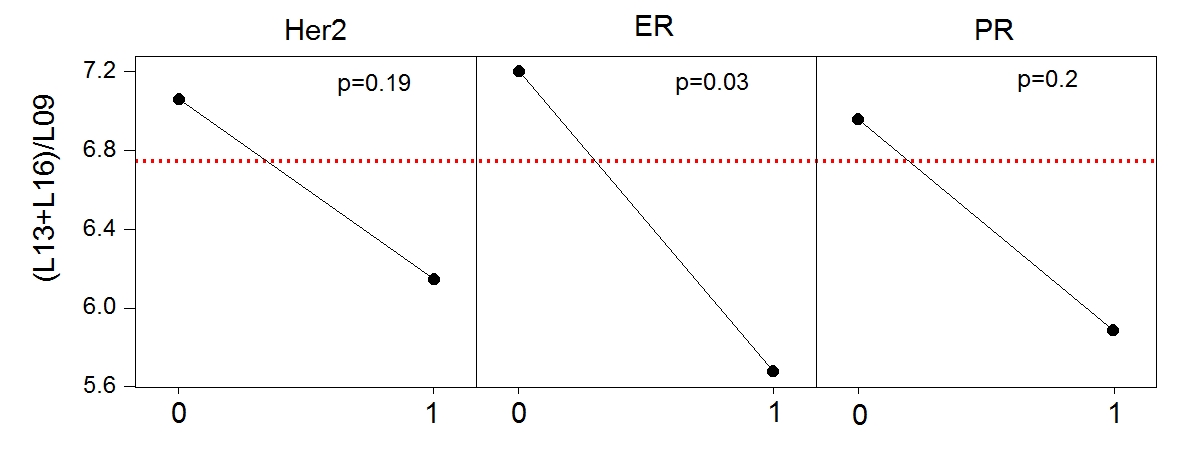
Figure 1 displays exemplary voxel locations (avoiding adipose tissue) and spectrum/fit from a normal volunteer. Among the lesions in our study, 3 were false positives, while 20 were confirmed cancers. Figure 2 (top) presents a summary of our measures of lipid composition from all our subjects. The three measures best separating the two categories were (L13+L16)/L09, SI and MCL (p=0.013/0.015/0.037 respectively). The three measures were, however, strongly correlated (r>0.96), resulting in a single useful separating variable. Figure 2 (bottom) presents all our in vivo data for the best tumor separating measure, (L13+L16)/L09. Note that significantly shorter unsaturated chain lengths appear in the tumor environments, but not in the tissue adjacent to the tumor, in the contralateral breast, or in the false positive lesions; all these are similar to the normal fibroglandular tissue (L13+L16)/L09 ratio. The main effects plot, separating the means for hormone positive from hormone negative tumors, is displayed in Figure 3, along with the p-values of ANOVA. While all tumors have (L13+L16)/L09 ratios smaller than normal tissue, hormone positive tumors tend to have smaller ratios than their hormone negative counterparts; at our sample size, it is only the ER+/ER- differences that are statistically significant.
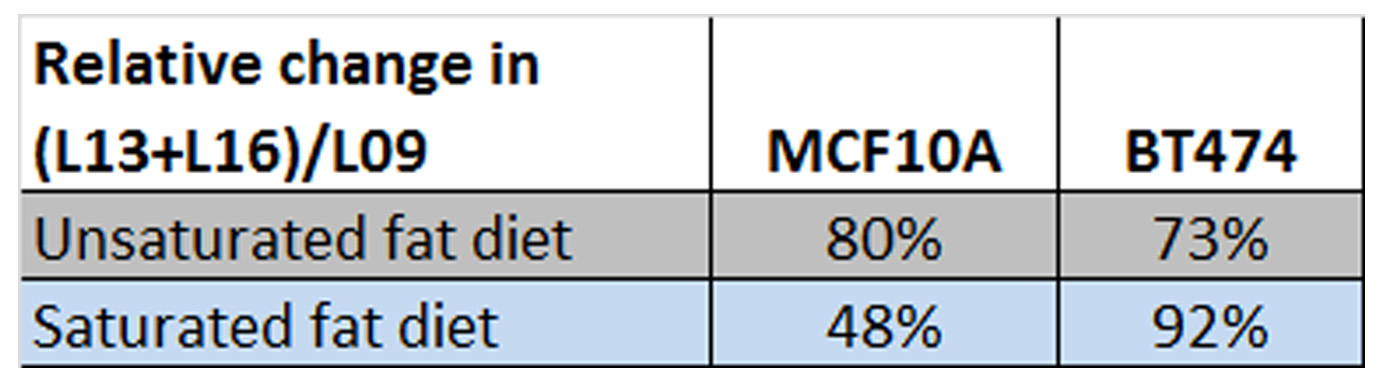
Figure 4 presents exemplary spectra/fits from the two cell lines. While not an exact representation of the situation in vivo (note the narrower lines, additional 3-4ppm small resonances and lower L13/L19 ratio), both of these exhibit the same main lipid peaks seen in vivo. Figure 5 shows the change in the (L13+L16)/L09 ratio for the fibrocystic and cancer lines after exposure to culture media enriched in unsaturated/saturated FA’s, respectively. While both lines show comparable increases in their unsaturated FA chain lengths when exposed to unsaturated fats, preferential increases in (L13+L16)/L09 are exhibited by the breast cancer cell line.
Conclusions
This work presents preliminary evidence, indicating that lipid composition may be different in cancers compared to adjacent fibroglandular tissue, contralateral breast, or benign lesions. These last three categories exhibit comparable lipid composition to the one found in normal fibroglandular tissue. Cell culture experiments confirm that, at similar culture media, breast cancer cells preferentially uptake saturated lipids. MRS-based measurements of lipid peak ratios may provide useful markers for cancer detection and characterization.
Acknowledgements
This work was supported in part by NIH grant 1R01CA154433.References
[1] Clauser etc al, Eur Radiol. 2014 Sep;24(9):2213-9.
[2] Han M et al, Magn Reson Med. 2014 Apr;71(4):1511-7.
[3] Kim JK et al, Breast. 2003 Jun;12(3):179-82.
[4] Dzendrowskyj et al, MAGMA 1997, 5: 105-110
[5] Lipnick et al, NMR Biomed 2010, 23:922-930
[6] Hakumaki et al, Nat Med 1999, 5(11):1323-1327
[7] Baumann J et al, Biochim Biophys Acta. 2013 1831(10):1509-17.
[8] Debnath, J., et al, Methods 30, 256–268 (2003).
[9] Guo, Y. et al. Nature 453, 657–661 (2008)
[10] Carro, M., et al, Theriogenology 79, 687–694 (2013).
[11] Soares et al, NMR Biomed 2015, 28:1009-20.
Figures