4935
Automatic Breast Tumor Segmentation Methods for Mass and Non-mass Lesions for Quantitative Morphology and Texture Analysis1University of California, Irvine, Irvine, CA, United States, 2E-Da Hospital and I-Shou University, Kaohsiung, Taiwan, 3Tzu-Chi General Hospital, Taichung, Taiwan
Synopsis
A breast tumor segmentation platform for mass and non-mass tumors on 3D MRI was developed. The segmentation of non-mass lesions is challenging. We developed a new method based on region-growing with the threshold determined by comparison of the intensity histograms in an ROI containing suspicious tumor region vs. outside ROI containing normal fibroglandular tissues. Breast MRI of 122 patients with pathologically-confirmed breast cancer were studied. Of them, 14 had triple negative, 29 had HER2-positive, and 51 had Hormonal-positive, HER2-negative breast cancers. The segmented tumor ROI was analyzed to obtain morphology and texture parameters for differentiation of these 3 molecular subtypes.
Introduction
Breast cancer is the second most leading cause of cancer death in women only after lung cancer. With the improved technology in imaging, automatic and quantitative analysis of breast cancer may provide clinically important information for diagnosis and treatment planning. Breast tumor segmentation has been a mature technique for mass tumors that have clear boundaries and uniform shapes, but the segmentation for non-mass-like enhancement lesions is still challenging. The goal of this study is to develop a robust and reliable segmentation method for irregular non-mass tumors. After segmentation, the 3D ROI of the tumor was analyzed to obtain morphology and texture features. Machine learning algorithms were applied to differentiate among three different molecular subtypes of tumors: triple negative, HER2-positive, and Hormonal-positive & HER2-negative breast cancers.Methods
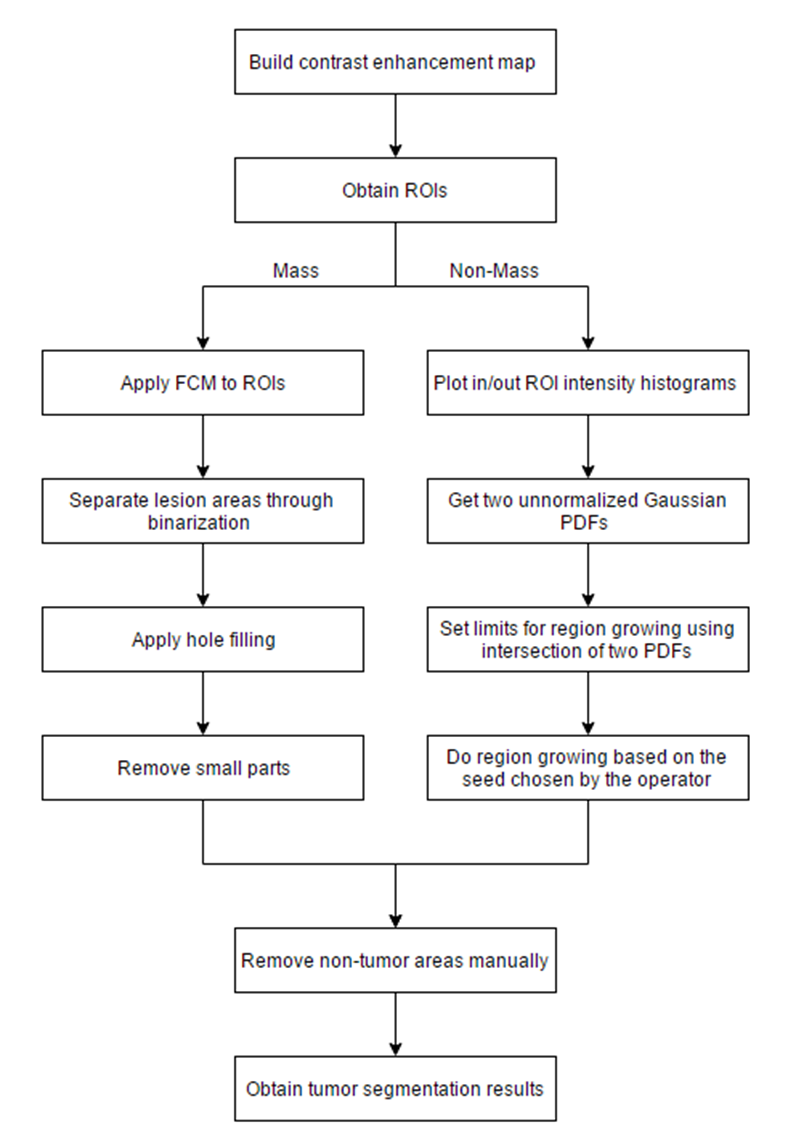
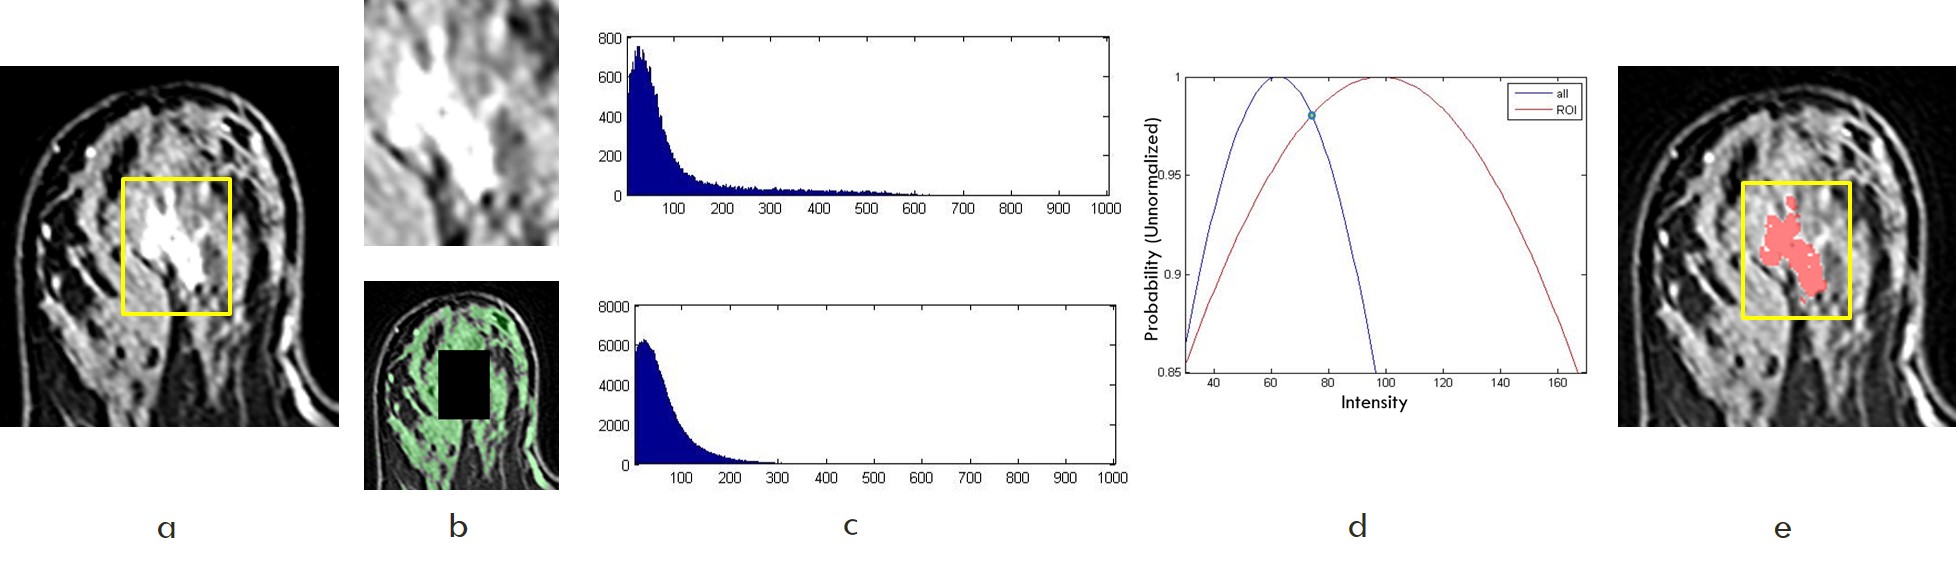
122 breast cancer patients (range 22-75, mean age 48.5 y/o) were studied. The MRI was performed using a Siemens 1.5T system. Figure 1 shows the flowchart of the segmentation procedures for mass tumors and non-mass tumors, respectively. Tumors were segmented based on the contrast-enhanced maps. Firstly, the operator reviewed all images in an image sequence to determine the lesion location and the beginning/ending slices containing the tumor. Then, a rectangle box was manually placed over the lesion location. For mass tumors, fuzzy-C-means (FCM) clustering-based algorithm was applied [1]. For non-mass lesions the FCM did not work well, and additional procedures to compare the signal intensity histograms of tissues within and outside the rectangle ROI were applied. Based on the two histograms, two unnormalized Gaussian Probability Density functions (PDF) [2] were fitted to normalize the difference in the pixel numbers of two histograms. Then operator manually selected a seed inside the rectangle box for region growing, with the threshold determined by the intersection of two Gaussian probability density functions. Figure 2 illustrates the procedures for non-mass tumor segmentation. If necessary, operator can manually perform corrections using the modification dialogue. The segmented tumor was analyzed to obtain 11 morphology (Volume, Surface Area, Compactness, Sphericity, NRL Entropy, NRL Ratio, Roughness, 3D Circularity, 3D Complexity, 3D Irregularity, 3D Compactness) and 53 texture features by using GLCM, GLRLM, GLSZM, NGTDM metrics. For differentiation of molecular subtypes, feature selection was firstly applied using random forest algorithm [3] to find features with the highest significance. Then, these features were used to train a logistic model to serve as a classifier.Results
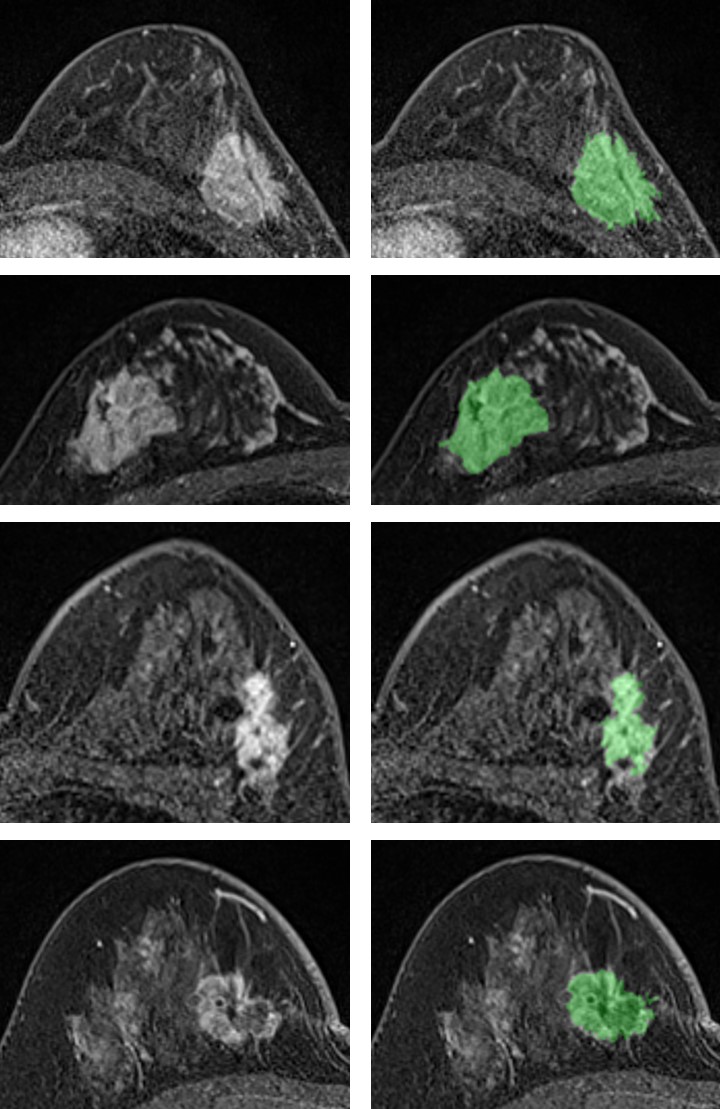
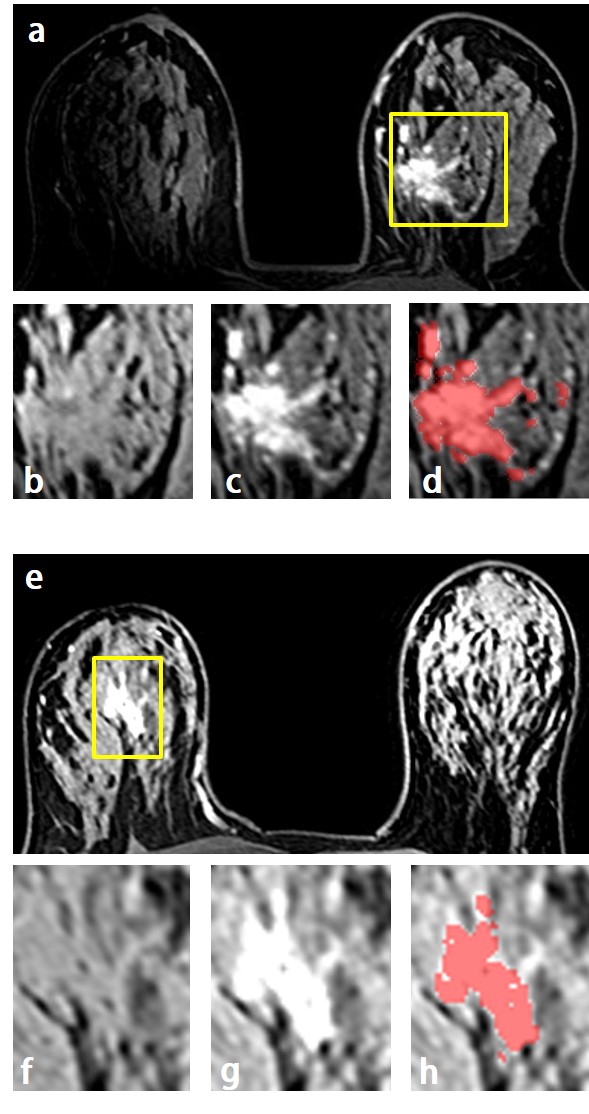
The segmentation results for 4 mass tumor cases are shown in Figure 3. Figure 4 shows segmentation results of two non-mass tumors. Figure 5 shows a 3D rendering view movie of the segmented non-mass tumor. The segmentation quality was reviewed by an experienced radiologist and found to be satisfactory. Manual correction was rarely needed (less than 20% of the total cases; and if correction was needed the corrected pixels was fewer than 5% of total tumor pixels). Of all 122 cases, 94 had complete molecular biomarkers to be classified as: triple negative (14 cases), HER2-positive (29 cases), Hormonal-positive and HER2-negative (51 cases). Based on cross validation method, ROC curves and AUC of pairwise comparison were generated. However, none of the single feature or combined features had the ability to differentiate among these three tumor subtypes. The area under the ROC curve was in the range of 0.70-0.80.Discussion
We developed a new method for segmentation of non-mass lesions on breast MRI, based on region-growing with the threshold determined by comparison of the intensity histograms in an ROI containing tumor vs. outside ROI containing normal fibroglandular tissue. The fibroglandular tissue segmentation was performed by using an automatic template-based method [4]. Of 122 cases, only 16 needed to be segmented using the non-mass segmentation method. The tumor segmentation quality was very good. The major problem of false-positive pixels came from vessels and breast boundaries that displayed bright signal similar to that of tumors. For those cases that needed manual corrections, fewer than 5% pixels compared to the total number of segmented tumor pixels were corrected. The results of morphology and texture analysis for differentiating among the three molecular subtypes were not satisfactory, which could be due to the small number of cases, and warrants further investigation.Acknowledgements
No acknowledgement found.References
[1] Nie, Ke, et al. "Quantitative analysis of lesion morphology and texture features for diagnostic prediction in breast MRI." Academic radiology 15.12 (2008): 1513-1525.
[2] Albrecht, Andreas, and Gary Bernstein. "Evaluating dark energy probes using multidimensional dark energy parameters." Physical Review D 75.10 (2007): 103003.
[3] Segal, Mark R. "Machine learning benchmarks and random forest regression." Center for Bioinformatics & Molecular Biostatistics (2004).
[4] Lin M, Chen J-H, Wang X, Chan S, Chen S, Su M-Y. Template-based automatic breast segmentation on MRI by excluding the chest region. Medical Physics. 2013;40(12):122301. doi:10.1118/1.4828837.
Figures