4933
Comparison of Breast Pharmacokinetic Parameters in Fat-Water and Water Only Images1Electrical Engineering, Stanford University, Stanford, CA, United States, 2Radiology, Stanford University, CA, United States
Synopsis
Pharmacokinetic parameters such as Ktrans, kep and ve can be estimated from contrast enhanced breast MRI using Tofts model. Previous simulation has shown that Ktrans has a maximum bias of 82% at 5s temporal resolutions in the presence of fat. In this work, we have compared the PK parameters estimated from in-phase fat-water, and water-only images in 7 malignant and 4 benign lesions. The presence of fat introduced biases in Ktrans and kep respectively of –0.02 min-1 and 0.01 min-1 in malignant lesions and –0.001 min-1 and –0.003 min-1 in benign lesions, but did not affect the classification of lesions.
Introduction
Pharmacokinetic (PK) models are used for estimation of physiological quantities such as the transfer rate constant of Gadolinium contrast agent from the vascular space to extravascular extracelluar space Ktrans, fractional volume in the extracellular extravascular space ve and rate constant kep=Ktrans/ve. Breast dynamic contrast enhanced (DCE) MRI is commonly performed with fat-suppression that may be non-uniform at 3T due to B0 and B1 inhomogeneities. Previous simulations by Holmes et al. 1 show that increased fat fraction in the tissue results in a maximum absolute bias of 82% and 293% at the 5s and 30s temporal resolutions respectively in the Ktrans value 1. Dixon imaging offers the opportunity to study these biases in vivo with and without fat suppression. The purpose of this study is to determine the effect of fat on the estimation of Ktrans and kep parameters in breast lesions, and their possible effects in breast lesion classification 2.Methods
The effect of fat on PK parameters was studied in 6 patients with 11 biopsy-proven lesions (7 malignant – 1 ductal carcinoma in situ, 4 invasive ductal carcinoma, 2 mucinous carcinoma). 3D RF-spoiled gradient echo DCE images with 2-point Dixon fat/water separation were acquired using DISCO 3 on a 3T scanner (GE Healthcare, Waukesha, WI). The study was approved by the IRB and was performed with informed consent from patients. Fourteen 3D images were acquired during the wash-in period with higher temporal resolution of 13s, followed by four datasets with lower temporal resolution of 2 min. The other imaging parameters were: FOV = 270 x 324 mm, TR/TE1/TE2 = 6.3/2.2/3.3 ms. Prior to the acquisition of pre-contrast DCE images (FA=12°), 3D variable-flip-angle (FA=2°, 5° and 8°) images with identical imaging parameters were acquired to estimate the water-only (WO), and in-phase fat-water (FW) T10 maps 4. A 2D multi-slice Bloch-Siegart B1 map 5 was acquired for correcting the T10 map. Voxel-by-voxel PK mapping was performed on the WO, and in-phase FW datasets using Tofts model 6 with modified Fritz-Hansen arterial input function.Results
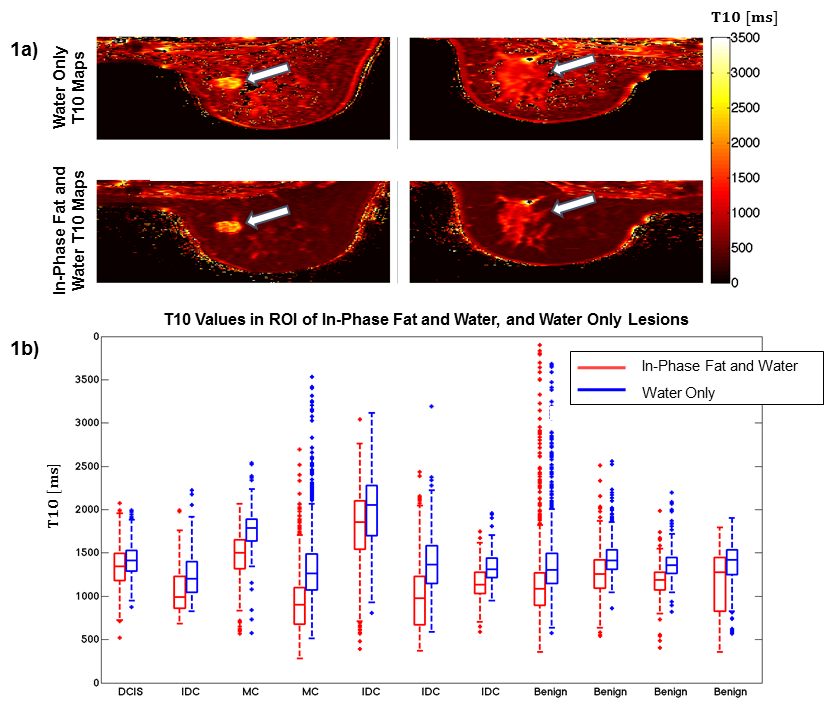
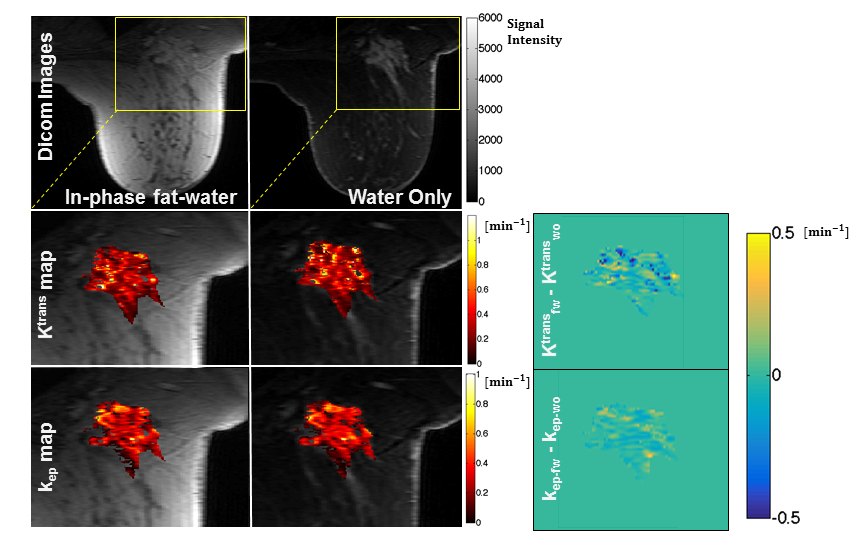
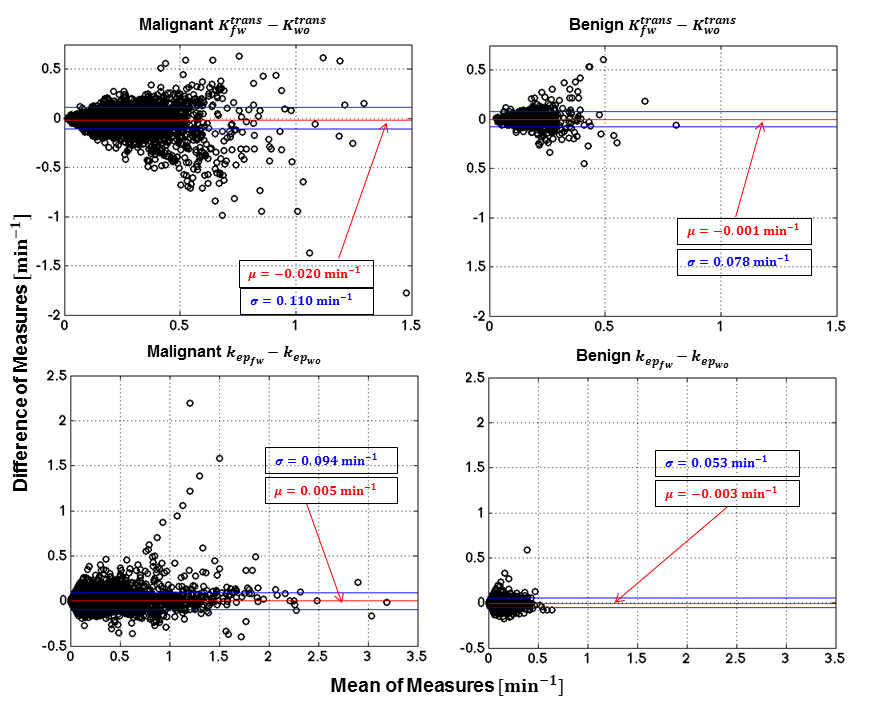
Fig.1. shows example T10 maps estimated from variable-flip-angle in-phase fat-water images compared to the T10 map estimated from water-only images. The distribution of the T10 values within the lesion ROI for fat-water and water-only images are shown in Fig.1b. The average of the median T10 within the lesion ROIs was 1230 ms for in-phase fat-water images, and 1445 ms for water-only images. This indicates that the lesions had sufficient fat content to alter the T10 value. Example Ktrans and kep maps estimated from in-phase fat-water and water only images of an IDC tumor are shown in Fig.2. Bland-Altman plots for the Ktrans and kep parameters within all lesion voxels in malignant tumors and benign lesions are shown in Fig.3. The biases of the Ktrans and kep in malignant lesions were –0.020 min-1 and 0.005 min-1 respectively. 85% of the Ktrans data were within the limits of agreement of one standard deviation 0.110 min-1. 84% of the kep data falls within one standard deviation of 0.094 min-1. The biases of the Ktrans and kep in benign lesions were –0.001 min-1 and -0.003 min-1 respectively. 84% of the Ktrans data were within the limits of agreement of one standard deviation 0.077 min-1, and 80% of the kep data were within one standard deviation of 0.052 min-1.Discussion
The PK parameters estimated from the water-only images with T10 estimated from water-only variable-flip-angle images is considered to be standard. In this preliminary study of 11 tumors, the Bland-Altman plots show that the overall bias of Ktrans is minimal and does not affect the classification of benign and malignant tumors. The kep parameter, which has increased sensitivity and specificity for classification of benign and malignant tumors 2 compared to Ktrans ,has larger separation between malignant and benign lesions compared to minimal bias introduced by fat. In this study, the T10 values for fat-water images were estimated from the corresponding in-phase changes. However, estimation of T10 map from water-only images when applied to fat-water images or partially fat-suppressed images can further increase the negative bias of the Ktrans estimation.Conclusion
The change in both Ktrans and kep parameters estimated from in-phase fat-water image does not introduce sufficient bias to misclassify benign and malignant tumors compared to the estimates from water-only images.Acknowledgements
R01 EB009055References
1. Holmes J, et al., ISMRM 2015:0191
2. Schabel M, et al., JM 2010;31(6):1371-1378
3. Saranathan M, et al., JMRI 2014;40(6):1392-1399
4. Deoni SC, et al., MRM 2003; 49(3):515-526
5. Sacolick L, et al., MRM 2010; 63(5):1315-1322
6. Tofts P, et al., JMRI 1999;10:223-232
Figures