4932
Restriction Spectrum Imaging in Breast Cancer: Improved Evaluation of Response to Neoadjuvant ChemotherapyRebecca Rakow-Penner1, Nicholas Albino-Kroesing2, Boya Abudu2, Nathan White1, David Karow1, Hauke Bartsch1, Joshua Kuperman1, Dennis Adams3, Natalie Schenker-Ahmed1, Anne Wallace4, Sarah Blair4, Haydee Ojeda-Fournier1, and Anders Dale1
1Radiology, University of California San Diego, La Jolla, CA, United States, 2University of California San Diego, La Jolla, CA, United States, 3Pathology, University of California San Diego, La Jolla, CA, United States, 4Surgery, University of California San Diego, La Jolla, CA, United States
Synopsis
Restriction spectrum imaging (RSI) is an advanced diffusion imaging technique based on a model with increased sensitivity to cancer cells with high nuclear to cytoplasm ratio. This abstract is the initial evaluation comparing RSI to standard diffusion imaging in breast cancer in assessing response to chemotherapy. RSI Z-scores, in comparison to the ADC, demonstrated increased conspicuity and significance in evaluating response to chemotherapy. RSI may be a more reliable diffusion imaging technique in evaluating response to treatment.
Introduction:
Restriction spectrum imaging (RSI) is an advanced diffusion imaging technique based on a model with increased sensitivity to cancer cells with high nuclear to cytoplasm ratio [1]. The technique also corrects for distortions due to B0 inhomogeneity and eddy currents. The most useful demonstrated application of diffusion imaging for breast cancer has been in evaluating early response to treatment [2]. This abstract is the initial evaluation comparing RSI to standard diffusion imaging in breast cancer in assessing response to chemotherapy. By increasing sensitivity to the intracellular restricted component of the diffusion signal, RSI allows for increased specificity for tumor rather than post treatment edema/hemorrhage and other benign findings. RSI optimizes the signal from the spherically restricted diffusion pool and attenuates the signal from all other diffusion pools. This theoretically allows for isolation of signal from tightly packed tumor cells. The output from these techniques has been termed the tumor ‘cellularity map’ (CM). By isolating the spherical restricted compartment from the cylindrically restricted and hindered compartments, RSI-CM provides significantly greater conspicuity in distinguishing tumor from normal appearing tissue when compared with conventional diffusion imaging. Our hypothesis is that RSI will more reliably and significantly evaluate breast cancer’s response to treatment as compared to standard diffusion imaging.Methods:
Ten patients with biopsy proven breast cancer underwent multi-parametric 3T MRI pre and post neoadjuvant chemotherapy to evaluate response to treatment. The chemotherapy regimen is according to the ISPY clinical trial. The imaging protocol included Gadolinium contrast enhanced MRI, standard diffusion-weighted imaging (b=0,800 s/mm2), and diffusion tensor imaging(0, 500, 1500, 4000 s/mm2 in 6, 6, and 15 directions) for restriction spectrum imaging cellularity maps (CM). For neutral comparison, RSI-CM and the standard ADC maps were distortion-corrected. To correct for distortion, forward and reverse trajectories were collected at b = 0 s/mm2. The distortion-correction algorithm [3] utilizes the symmetry of the distortion from B0 inhomogeneity. By collecting images at b = 0 s/mm2 in both the forward and reverse phase encode trajectories, a deformation field map was calculated and used to correct the entire diffusion data set. RSI Z-score maps were made by normalizing the data to the normal appearing breast tissue across pre-treatment data sets. Dynamic contrast-enhanced (DCE) MRI, standard diffusion MRI, and RSI-MRI were compared and evaluated with known biopsy results. DCE-MRI was considered the gold standard in evaluating response to treatment. If the DCE-MRI demonstrated a decrease in volume, this was considered a positive response to chemotherapy. An ROI was drawn on the post contrast images in the area of known cancer for each patient (both on the pre and post neoadjuvant treatment images). A second ROI was drawn on the post contrast images in a region of likely cancer free tissue on each data set. The areas selected by these ROIs were then used to measure the corresponding ADCs and RSI Z-scores. Paired two-tailed t-tests were performed to evaluate the significance of signal variation between pre and post treatment Z-scores as well as pre and post treatment ADCs.Results:
All 10 patients demonstrated a positive response to chemotherapy by decreasing in volume as detected by DCE-MRI. ADCs trended upward in 7/10 patients (an increase in ADC indicating a positive response to treatment). RSI Z-scores decreased in all 10 patients (a decrease in RSI Z-score indicating a positive response to treatment). Paired t-test results proved a significant difference between pre and post treatment RSI Z-scores (p = 0.0003), and no significant difference between pre and post treatment ADCs (p = 0.8757).Discussion:
RSI Z-scores, in comparison to the ADC, demonstrated increased conspicuity and significance in evaluating response to chemotherapy. RSI may be a more reliable diffusion imaging technique in evaluating response to treatment. This is likely due to increased sensitivity to tumor cells. The ideal gold standard would be to compare RSI to biopsy specimens rather than post contrast imaging. That was not feasible for this study, but is a focus of future research. This initial result demonstrating that RSI is reliable in evaluating response to treatment may impact future clinical studies, eliminating the need for DCE-MRI for interval evaluations of response to treatment. This potential will be evaluated on a larger patient base.Acknowledgements
GE Healthcare, NIH EB-RO1000790,UCSD Clinician Scientist Program, RSNA resident grantReferences
[1] White, et al. MRM; 2014. [2] Pickles et al. MRI, 2006. [3] Holland, et al. Neuroimage; 2010.Figures
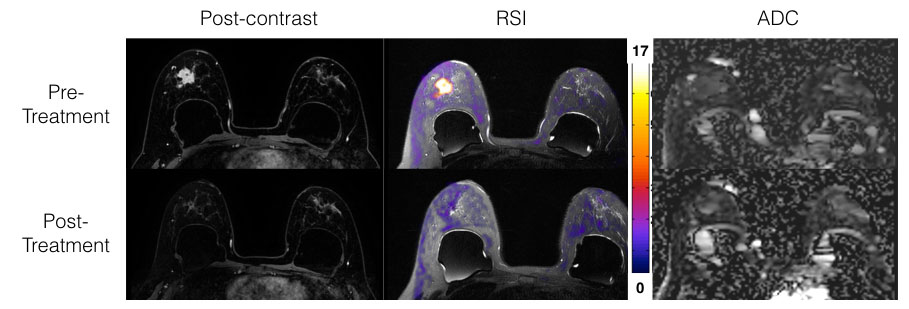
Figure 1. Patient with right breast nuclear grade 3 invasive ductal carcinoma pre and post treatment. RSI increased conspicuity of the cancer and demonstrated a similar response to treatment as DCE-MRI, more than ADC. This patient has breast implants. Color bar represents associated Z-scores with RSI map.
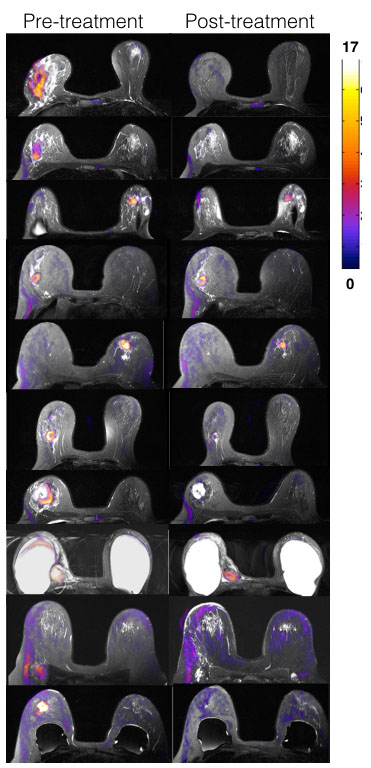
Figure 2. Pre
and post chemotherapy RSI Z-score maps on all 10 patients. All patients had grade 2 or 3 invasive ductal
carcinoma. Several of the patients had
breast implants. Color bar represents associated Z-scores with RSI map. Note decreased tumor burden on post-chemotherapy RSI Z-score maps.
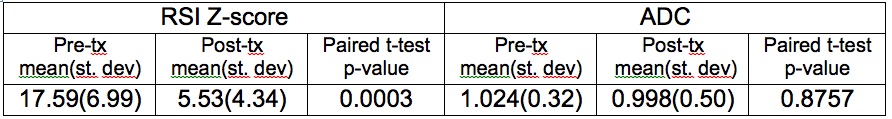
Table 1. Significance of pre and post treatment RSI Z-score vs ADC.