4931
Serial Quantitative BPE measures on MRI: Correlation with 18F-FDG PET SUV measures in Normal Breast Tissue of Patients Undergoing Breast Cancer Therapy1Radiology, University of Washington, Seattle, WA, United States, 2Breast Imaging, Seattle Cancer Care Alliance, Seattle, WA, United States, 3University of Washington, Seattle, WA, United States, 4Seattle Cancer Care Alliance, Seattle, WA, United States
Synopsis
There is emerging data on the association of background parenchymal enhancement (BPE) on breast MRI with breast cancer risk. However, the underlying mechanism of BPE and its biologic relationship with cancer development remain unknown. Our study investigated the correlation of BPE with FDG PET standardized uptake values (SUV) in normal contralateral breast tissue of 35 women undergoing neoadjuvant chemotherapy. We found quantitative BPE area measures correlated with SUV metrics, and each decreased with therapy. Our findings suggest BPE reflects increased metabolic activity in normal breast tissue, which may provide valuable information for predicting cancer risk and response to therapy.
Purpose
A growing number of studies have shown that enhancement characteristics of the normal fibroglandular tissue (FGT) on breast MRI, known as background parenchymal enhancement (BPE), may be a marker of breast cancer risk and treatment outcomes.1-4 Specifically, higher BPE levels are associated with presence of cancer,1,2 risk of developing a future cancer,3 and a better response to neoadjuvant chemotherapy.4 Although the biological basis of BPE correlations with breast cancer is unclear, it has been hypothesized that higher levels of BPE may reflect a more metabolically active breast tissue microenvironment, possibly due to inflammation. Qualitative BIRADS categorization of BPE has shown promising correlations with 18F-fluorodeoxyglucose (FDG) uptake in normal breast tissue, but is limited by subjective interpretation.5 Quantitative BPE metrics have further been shown to improve BPE characterization and stratification of cancer risk.6 Thus, the purpose of our study was to investigate whether quantitative BPE metrics on MRI correlate with metabolic activity in the normal tissue reflected by FDG PET imaging, and to evaluate additional influences of treatment and clinical factors.Methods
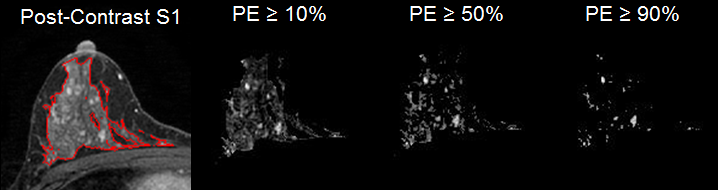
In this IRB-approved prospective study, 35 women with locally advanced breast cancer (median age 43 yrs; range 31-66 yrs) underwent serial breast MR and FDG PET imaging during neoadjuvant chemotherapy: at pre-therapy and mid-therapy time points (2-12 weeks after start of chemotherapy). MR imaging was performed on a 3T Philips MRI scanner including a fat-suppressed, T1-weighted, dynamic contrast enhanced (DCE) sequence with post-contrast volumes centered at 2, 5, and 8 mins after injection. FDG PET imaging was performed on a GE PET/CT scanner using a 60 min dynamic acquisition. Quantitative imaging characteristics of normal FGT in the contralateral breast were assessed at pre- and mid-therapy (median 68 days; range 36-110 days). DCE MR images were analyzed using an in-house software tool6, where BPE maps were generated from a single slice near the nipple at varying percent enhancement (PE) thresholds (0-20%: intervals of 5%, 20-100%: intervals of 10%): $$$PE = \frac{S_1-S_0}{S_0} × 100$$$ , where S0 and S1 are signal intensity from the pre-contrast and first post-contrast images, respectively (Figure 1). BPE area and mean were quantified at each PE threshold based on the number and enhancement values of voxels meeting the PE threshold, respectively. SUV mean and max measurements were calculated from 60 min SUV maps for a 2cc region at lesion level. Other patient factors were collected from clinical reports, such as age, menopausal status, mammographic density, and lesion pathologic complete response (pCR). Changes in BPE and SUV with treatment were assessed by Wilcoxon signed rank test. Associations between BPE and SUV were assessed by Spearman’s rank correlation. Additionally, BPE and SUV associations with clinical factors were assessed by Wilcoxon rank sum test.
Results
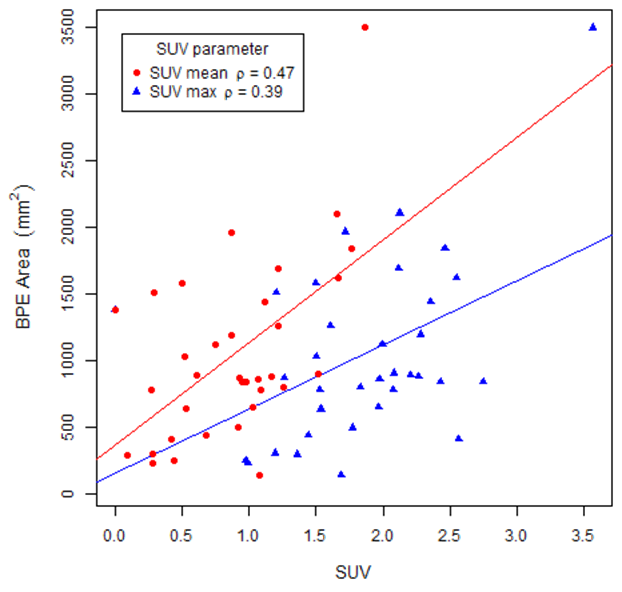
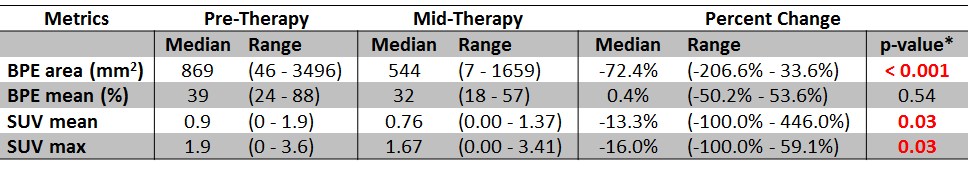
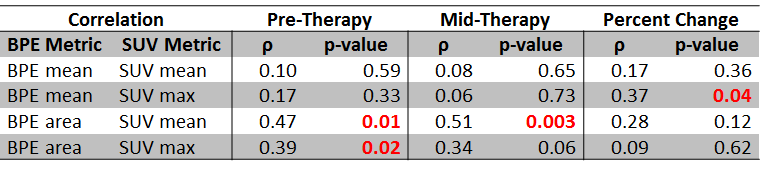
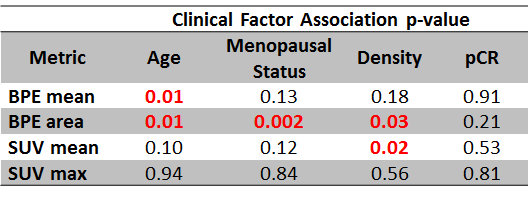
Across tested BPE thresholds, PE $$$\geq$$$15% was observed to optimize correlations between BPE and SUV metrics. Therefore, all subsequent analyses were performed for BPE metrics calculated using a 15% PE threshold. Overall with therapy, BPE area and both SUV metrics significantly decreased from pre-therapy levels, while BPE mean did not (Table 1). At pre-therapy, BPE area was significantly correlated (p < 0.01) to SUV mean and SUV max (Figure 2, Table 2). At mid-therapy, BPE area remained significantly correlated (p < 0.01) with SUV mean, and percent changes in BPE mean and SUV max were significantly correlated (p = 0.02). In comparison with clinical factors, both BPE metrics were negatively correlated with age, and BPE area was significantly lower after menopause and with lower breast density (Table 3). No significant associations were observed for normal tissue BPE or SUV measures with lesion pathologic response to neoadjuvant therapy (p > 0.05).Conclusion
The significant correlations identified between BPE and SUV levels in normal tissue supports the hypothesis that higher BPE reflects increased metabolic activity in normal tissue. Our findings agree with a prior study comparing subjective BPE with SUV measures, along with clinical factors of density and age.5 Our study additionally found decreases in BPE and SUV with therapy and correlations between BPE and SUV at mid-therapy. These findings suggest that BPE may reflect biological processes that cause breast tissue to be susceptible to tumorigenesis and change with breast cancer treatment.
Acknowledgements
This research was supported by National Institutes of Health Grant P50CA138293, an ISMRM 2013-2014 Seed Grant, and a gift from the Safeway Foundation.References
1. King V, et al. Background parenchymal enhancement at breast MR imaging and breast cancer risk. Radiology. 2011 Jul;260(1):50-60.
2. Telegrafo M, et al. Breast MRI background parenchymal enhancement (BPE) correlates with the risk of breast cancer. Magn Reson Imaging. 2016 Feb;34(2):173-6.
3. Dontchos BN, et al. Are Qualitative Assessments of Background Parenchymal Enhancement, Amount of Fibroglandular Tissue on MR Images, and Mammographic Density Associated with Breast Cancer Risk? Radiology. 2015 Aug;276(2):371-80.
4. Chen JH, et al. Background Parenchymal Enhancement of the Contralateral Normal Breast: Association with Tumor Response in Breast Cancer Patients Receiving Neoadjuvant Chemotherapy. Transl Oncol. 2015 Jun; 8(3):204-9
5. Leithner D, et al. Quantitative Assessment of Breast Parenchymal Uptake on 18F-FDG PET/CT: Correlation with Age, Background Parenchymal Enhancement, and Amount of Fibroglandular Tissue on MRI. J Nucl Med. 2016 Oct;57(10):1518-1522.
6. Liu C-L, et al. Optimization of Quantitative MRI Background Parenchymal Enhancement Metrics to Predict Breast Cancer Risk. Proceedings ISMRM 2015.
Figures