4919
Correlation of Pharmacokinetic Parameters with Prognostic factors of Breast Cancers: a Retrospective Study in Dynamic Contrast-Enhanced MRI with CAIPIRINHA-Dixon-TWIST-VIBE Technique1Radiology, Tongji Hospital, Wuhan, People's Republic of China, 2Siemens Healthcare, MR Collaboration NE Asia, People's Republic of China, 3Siemens Healthcare, MR Collaboration
Synopsis
As the use of neoadjuvant chemotherapy is gradually increased in the treatment of breast cancer, evaluating its therapeutic effect is gaining importance. This study investigated the correlation between pharmacokinetic parameters using high spatial and temporal resolution dynamic contrast-enhanced MR imaging (DCE-MRI) and the prognostic factors for breast cancers. The results showed quantitative parameters (Ktrans, kep) were significantly correlated to the prognostic factors (PR, Ki-67) of breast cancers. Quantitative parameters (Ktrans, kep) of high spatial and temporal resolution DCE-MRI may be good indicators of therapeutic effect of patients undergoing neoadjuvant treatment.
Purpose
To investigate the correlation of pharmacokinetic parameters with prognostic factors of breast cancers in T1-weighted dynamic contrast-enhanced MR imaging (DCE-MRI) based on CAIPIRINHA-Dixon-TWIST-VIBE (CDT-VIBE) technique.Method
A total of 96 patients with known invasive ductal carcinoma (DCIS) were enrolled in this study with their informed consent. Patients underwent dynamic breast imaging at 3T MRI (MAGNETOM Skyra, Siemens Healthcare, Erlangen, Germany) using a prototype CDT-VIBE sequence, and their histopathologic results were subsequently confirmed. The imaging protocol included 1 min 05 s for T1 mapping (FA = 2 and 14 degrees) and 6 min 58 s for CDT-VIBE imaging (11 s X 35 phases ). The detailed imaging parameters of CDT-VIBE included TR = 5.4ms, TE = 2.46/3.69ms, FA = 9 degree, FOV = 320 mm, matrix = 320 X 320,slice thickness = 1.5mm. In addition, a contrast medium (Omniscan, GE Healthcare) was administrated at the beginning of the fourth phase of the DCE sequence, via a power injector (0.1 mmol/kg body-weight). Ktrans (volume transfer constant between plasma and EES), kep (constant flux rate between EES and plasma) and ve (EES volume per unit volume of tissue) were then calculated using the functional Tissue4D software (Siemens Healthcare, Erlangen, Germany). The prognostic factors including estrogen receptor (ER), progesterone receptor (PR), Ki-67, human epidermal growth factor receptor 2 (HER2) were obtained from histopathological reports. Single-sample K-S test andpaired t-test with Bonferroni correction were used for statistical analysis.Results
Mean Ktrans and kep were higher in PR-negative tumors than in PR-positive tumors (P < 0.005 and P < 0.001 for Ktrans and kep, respectively) (Fig.1). However, mean ve did not show significant difference between PR negative and PR positive tumors. Mean Ktrans and kep were lower, and mean ve was higher, in Ki-67 negative tumors compared to Ki-67 positive tumors (P < 0.005, P < 0.001, P < 0.005). The other prognostic factors ER and HER2 showed no significant difference in quantitative parameters (Ktrans, kep, ve) (Table 1).Discussions & Conclusions
Significant correlations were found between quantitative parameters (Ktrans, kep) of high spatial and temporal resolution DCE-MRI and prognostic factors (PR, Ki-67) in DCIS breast cancers. These imaging tools may provide a non-invasive method for evaluating the therapeutic effect of neoadjuvant therapy.Acknowledgements
No acknowledgement found.References
No reference found.Figures
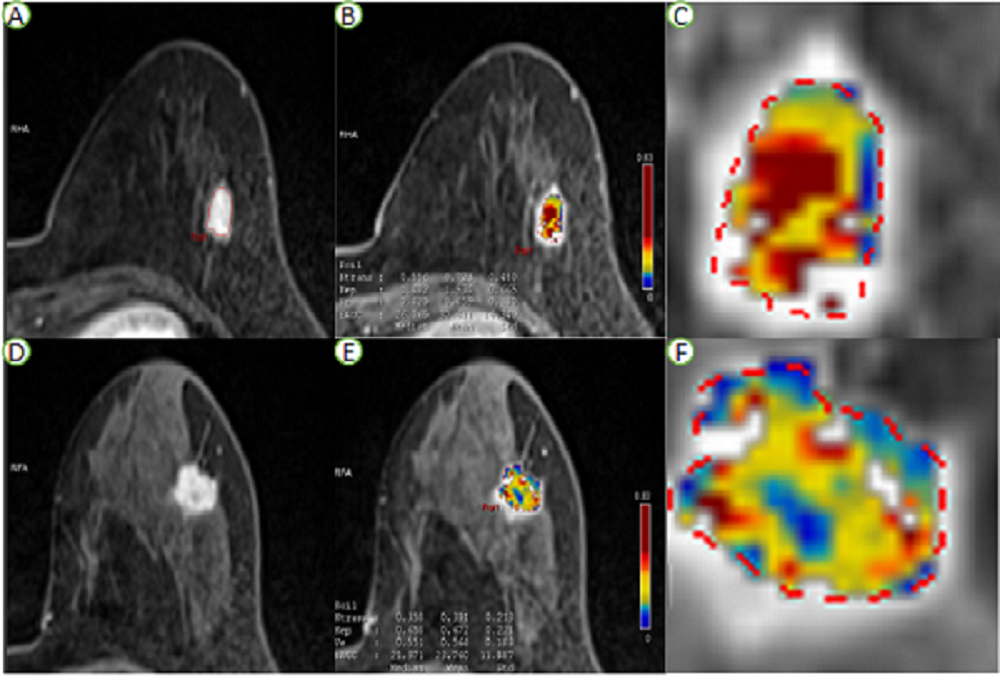
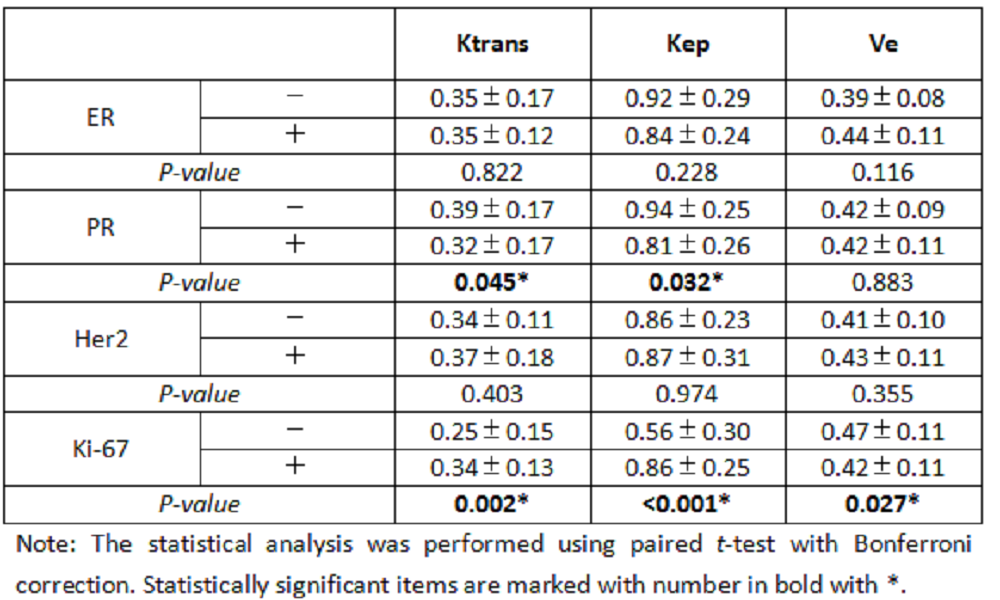
Table 1. Correlation between mean pharmacokinetic parameters and prognostic factors. P-values indicate the statistical significance in the difference between a negative and positive prognostic factor.