4917
Regional analysis of gas-uptake parameters in the lung using hyperpolarized 129Xe chemical shift saturation recovery spectroscopy and dissolved-phase imaging: a reproducibility study1Institute of Diagnostic and Interventional Radiology, Hannover Medical School, Hannover, Germany, 2Biomedical Research in Endstage and Obstructive Lung Disease Hannover (BREATH), German Center for Lung Research (DZL), Hannover, Germany, 3Department of Radiology and Medical Imaging, University of Virginia, Charlottesville, VA, United States, 4Clinical Airway Research, Fraunhofer Institute for Toxicology and Experimental Medicine, Hannover, Germany, 5Department of Radiology, University of Pennsylvania, Philadelphia, PA, United States
Synopsis
We performed a regional analysis of hyperpolarized 129Xe gas-uptake parameters in the lung using localized chemical shift saturation recovery spectroscopy and dissolved-phase imaging with a three-point Dixon method for comparison. Localization of spectroscopic data acquired without spatial encoding was achieved using a 16-channel receive coil and Spectral Localization Achieved by Sensitivity Heterogeneity (SPLASH). The reproducibility of all parameters was studied and coefficients of variation are reported. Localized CSSR data exhibit evidence of gravitational effects in consistency with dissolved-phase imaging. The septal wall thickness derived from evaluation of CSSR data using the Patz model can be determined regionally with high reproducibility.
Purpose
Hyperpolarized 129Xe chemical shift saturation recovery (CSSR) spectroscopy in combination with the Patz model for gas-uptake is sensitive for detection of abnormal changes of lung function1,2. However, the CSSR spectroscopy data does not contain regional information. This constitutes a limitation for the quantification of lung function using CSSR, given that lung diseases often manifest themselves by regional pathologies. Thus, the purpose of this study was to investigate the regional reproducibility and physiologic distribution of gas-uptake parameters in the lungs of healthy volunteers using CSSR 129Xe spectroscopy and spectral localization by a 16-channel receive coil.Methods
The study was approved by the institutional ethical review board and all subjects gave written informed consent. Eight healthy volunteers received a 129Xe MRI scan on two different days within one week. All subjects underwent a lung function test prior to the MR examination on both study days.
The protocol consisted of a hyperpolarized 129Xe dissolved-phase MRI scan3 (DPI) during one breath-hold after inhalation of 1L of isotopically enriched xenon gas and an additional amount of air to reach a lung inflation of one third of forced vital capacity (FVC). A CSSR measurement was performed in a separate breath-hold, after inhalation of 0.5L of hyperpolarized xenon gas and an additional amount of nitrogen and air to reach total lung capacity (TLC). During the same breath-hold, a ventilation image was created using a spoiled gradient-echo sequence.
Hyperpolarized 129Xe measurements were performed at 1.5T (Siemens, Avanto) using a dedicated 16-channel phased array receive coil (RAPID Biomedical). The CSSR sequence employed saturation pulses that alternatingly destroyed the magnetization in the tissue-plasma (TP) and red blood cell (RBC) compartments. Instead of using spatial encoding gradients in the CSSR sequence, spectral localization was performed by application of the SPLASH method introduced by An et al.4, exploiting coil element sensitivity heterogeneity for localization. The ventilation images were used to determine coil sensitivities and to manually segment eight regions of interest (ROIs) in the lung.
The Patz model functions2 were fitted to the regional CSSR data and coefficients of variation (CVs) for the model parameters were determined from the data of both study days. Furthermore, the ratios RBC/GP (GP: gas phase), RBC/TP and TP/GP were determined regionally both from the regional CSSR data at a delay time of 50ms and from dissolved-phase MRI.
Results
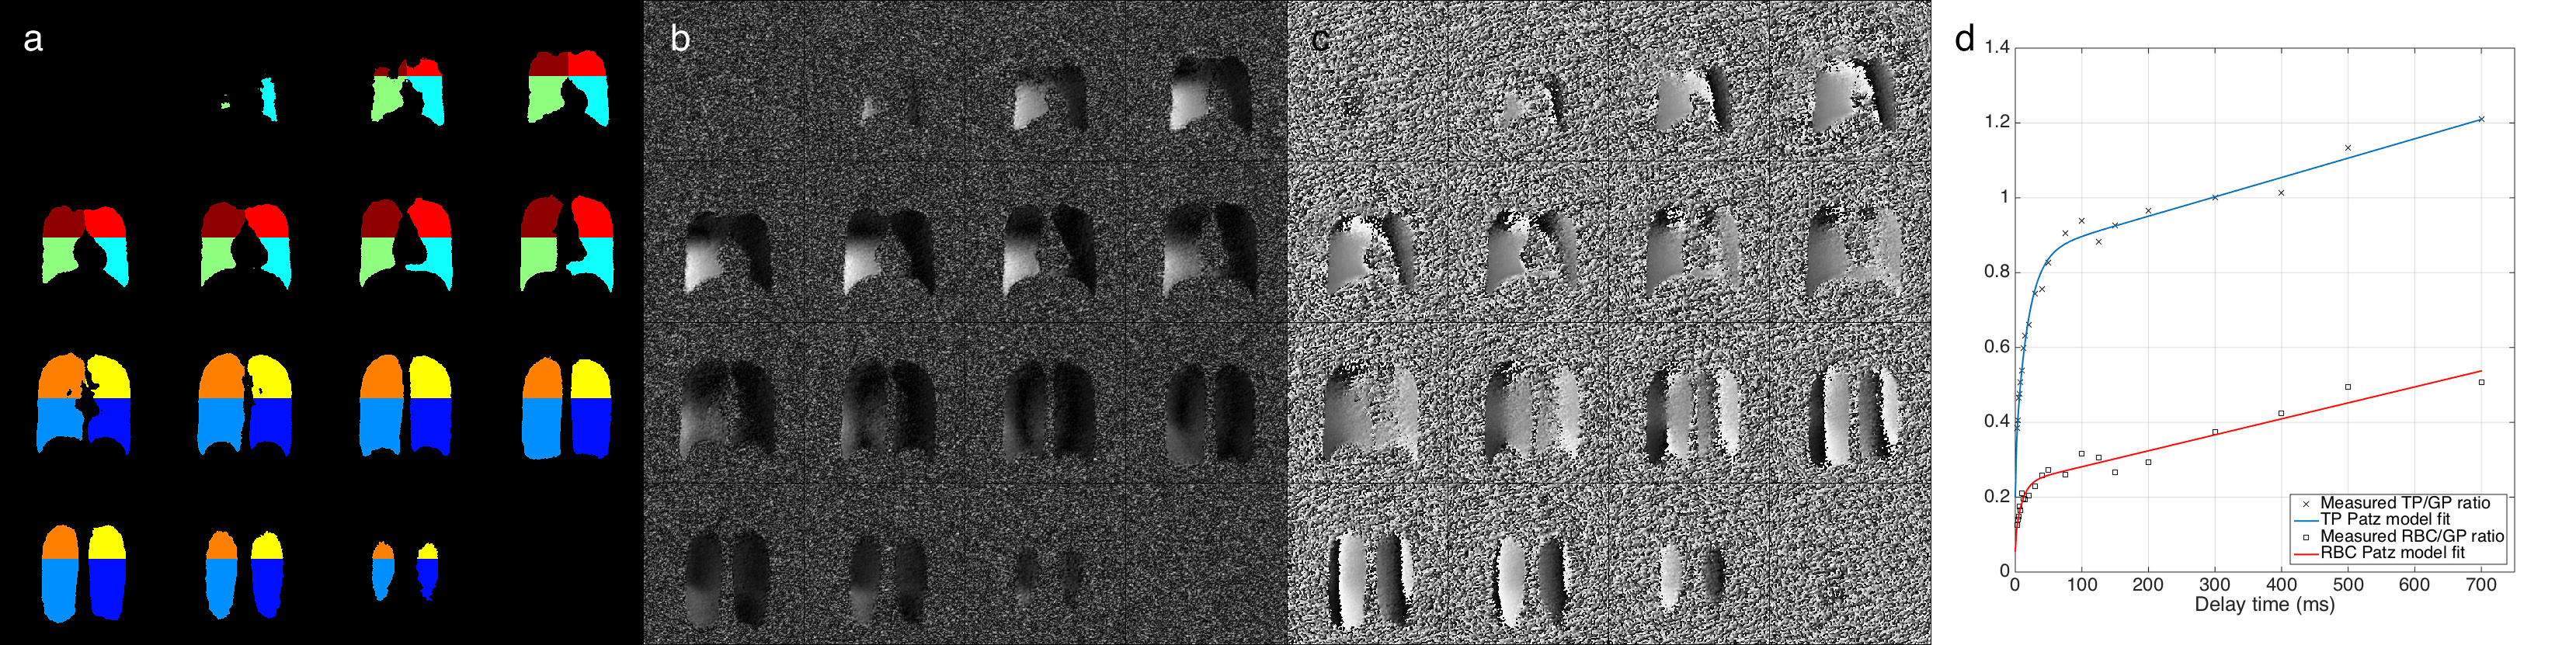
An exemplary segmentation of a lung and the corresponding spatial response function for one ROI after SPLASH localization can be found in figure 1a–c. Figure 1d shows CSSR TP/GP and RBC/GP ratio data at different delay times and the corresponding fitted model curves.
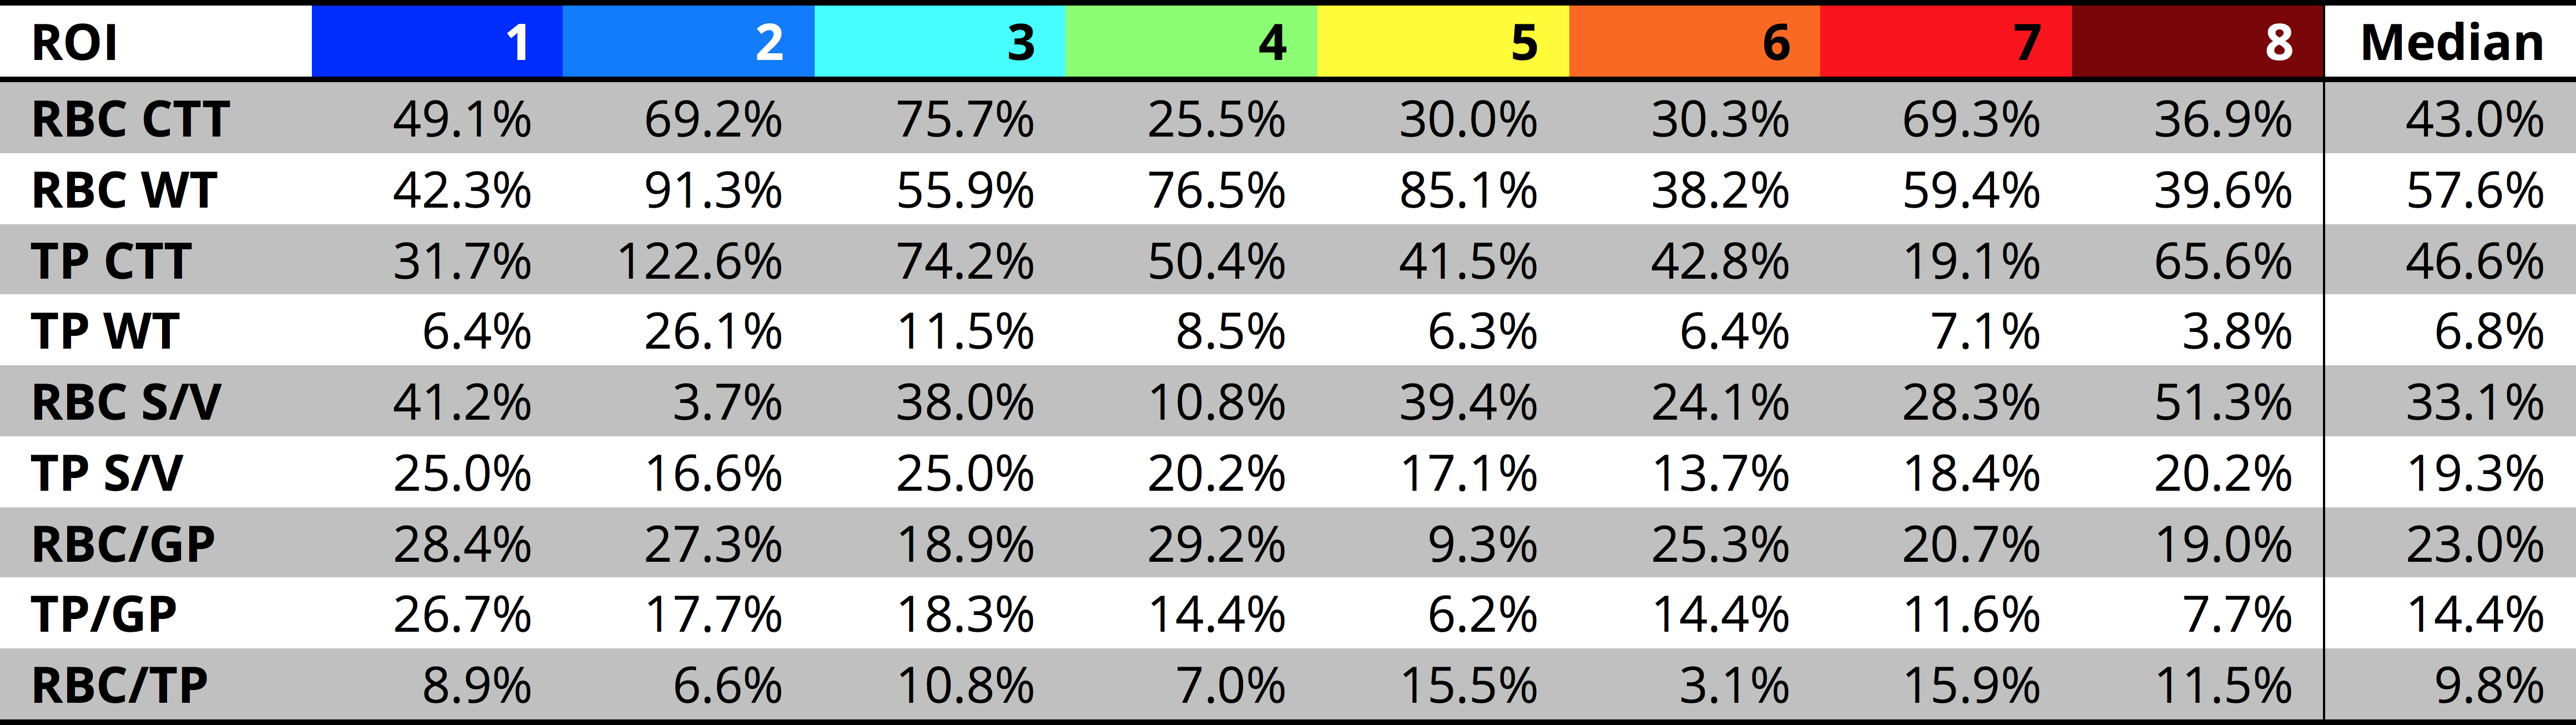
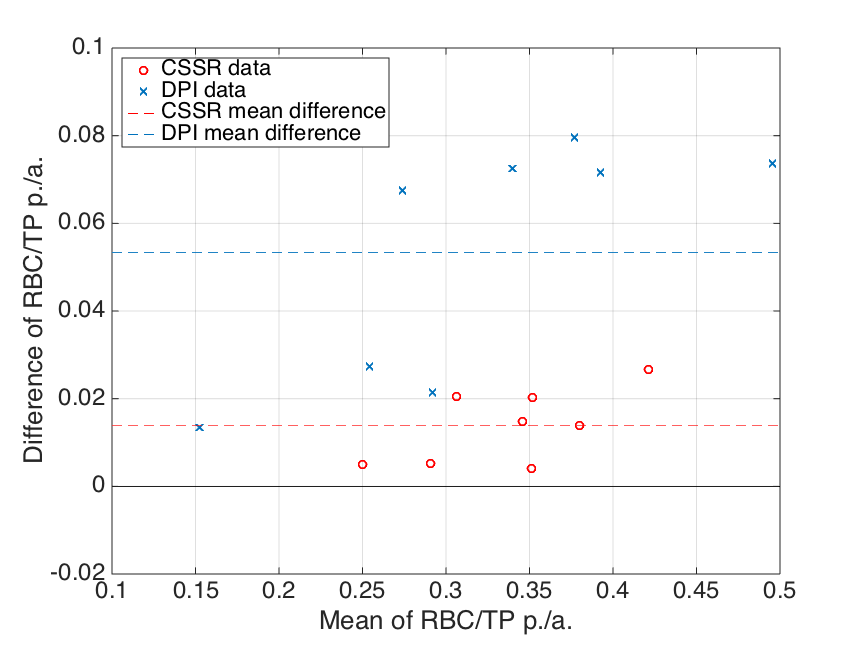
The CVs for the model parameters and the ratios are shown for every ROI in table 1. The parameters TP wall thickness and RBC/TP show the lowest median CVs. There were significant differences between the anterior and posterior RBC/TP ratios determined by CSSR and DPI (figure 2). In addition, a significant correlation for RBC/TP as measured by CSSR and dissolved-phase imaging for the whole lung was found (Spearman rank correlation coefficient r = 0.74, p = 0.046).
TP septal wall thickness significantly correlated with age (Pearson correlation coefficient r = 0.84, p = 0.009).
Discussion
Using CSSR 129Xe spectroscopy and spectral localization by a 16-channel receive coil, reproducible regional measurements of septal wall thickness and RBC/TP can be obtained.
The differences in RBC/TP ratio between anterior and posterior lung regions are likely due to gravitational effects in the supine position as previously described using the DPI technique3.
The relatively high CVs for CSSR RBC measurements are probably in part due to an incomplete saturation of the RBC phase. Surface-area-to-volume ratios (S/V), TP/GP and RBC/GP strongly depend on lung inflation level2,5. Therefore, as a source of variance, the breathing maneuver might explain the relatively high CVs for these parameters.
One limitation of SPLASH is the spectral homogeneity assumption within one compartment, i.e. a ROI. A violation of this assumption leads to localization errors. Further work is necessary in order to quantify localization errors of SPLASH applied to CSSR measurements in the human lung.
The correlation of TP septal wall thickness with age is in accordance to findings by Stewart et al.6 and likely demonstrates normal aging of the lung.
Conclusion
Patz model gas-uptake parameters as determined by 129Xe CSSR spectroscopy can be obtained regionally in the lung. Especially the wall-thickness parameter derived from TP phase of CSSR spectrocopy and the RBC/TP ratio show good reproducibility. Thus, inflammatory processes and other pathologies in the lung affecting septal wall thickness can be measured regionally using 129Xe CSSR spectroscopy in the future.Acknowledgements
This work was funded by the German Center for Lung Research (DZL).References
1. Qing K et al.: Assessment of Lung Function in Asthma and COPD using Hyperpolarized 129Xe Chemical Shift Saturation Recovery Spectroscopy and Dissolved-Phase MR Imaging. NMR Biomed. 2014;27(12):1490–1501
2. Patz S et al.: Diffusion of hyperpolarized 129Xe in the lung: a simplified model of 129Xe septal uptake and experimental results. New J Phys. 2011;13
3. Qing K et al.: Regional Mapping of Gas Uptake by Blood and Tissue in the Human Lung Using Hyperpolarized Xenon-129 MRI. J Magn Reson Imag. 2014;39:346–359
4. An L et al.: Spectral Localization by Imaging Using Multielement Receiver Coils. Magn Reson Med. 2011;66:1–10
5. Qing K et al.: Gas Uptake Measures on Hyperpolarized Xenon-129 MRI are Inversely Proportional to Lung Inflation Level. Proc. Intl. Soc. Mag. Reson. Med. 23 (2015)
6. Stewart N et al.: Experimental validation of the hyperpolarized 129Xe chemical shift saturation recovery technique in healthy volunteers and subjects with interstitial lung disease. Magn. Reson. Med. 2015;74:196–207
Figures