4916
A Pipeline for Quantifying 129Xe Gas Exchange MRI across Pulmonary Disorders1Biomedical Engineering, Duke University, Durham, NC, United States, 2Medical Physics Graduate Program, Duke University, Durham, NC, United States, 3School of Medicine, Duke University, Durham, NC, United States, 4Electrical and Computer Engineering, Duke University, Durham, NC, United States, 5Radiology, Duke University Medical Center, Durham, NC, United States
Synopsis
With its solubility and abundant chemical shift in different tissues, hyperpolarized 129Xe is uniquely suited to imaging pulmonary function. Previous efforts have demonstrated the ability to map gas transfer to interstitial barrier tissues and red blood cells (RBCs) using the gas-phase signal as a reference. Here, we extend this analysis by using a healthy reference cohort to establish relevant thresholds for quantitative display. With this methodology we now produce maps of ventilation, barrier uptake, and RBC transfer that demonstrate readily distinguishable patterns in a variety of obstructive, restrictive and vascular disorders.
Purpose
With its solubility and large chemical shifts, hyperpolarized 129Xe is uniquely suited to imaging pulmonary function1. 129Xe exhibits distinct resonances in airspaces, interstitial barrier and red blood cells (RBCs) that can be exploited in Dixon-based acquisitions to enable imaging of gas exchange2, 3. However, these images have relatively low SNR, and methods are needed to display them intuitively and quantify them robustly. Here we employ a method of using a healthy reference cohort4 to establish thresholds to generate binning maps of ventilation, barrier and RBC transfer. Moreover, this has been incorporated into a pipeline designed to be broadly disseminated. We demonstrate this method in patients with obstructive, restrictive, and vascular lung disorders.Methods
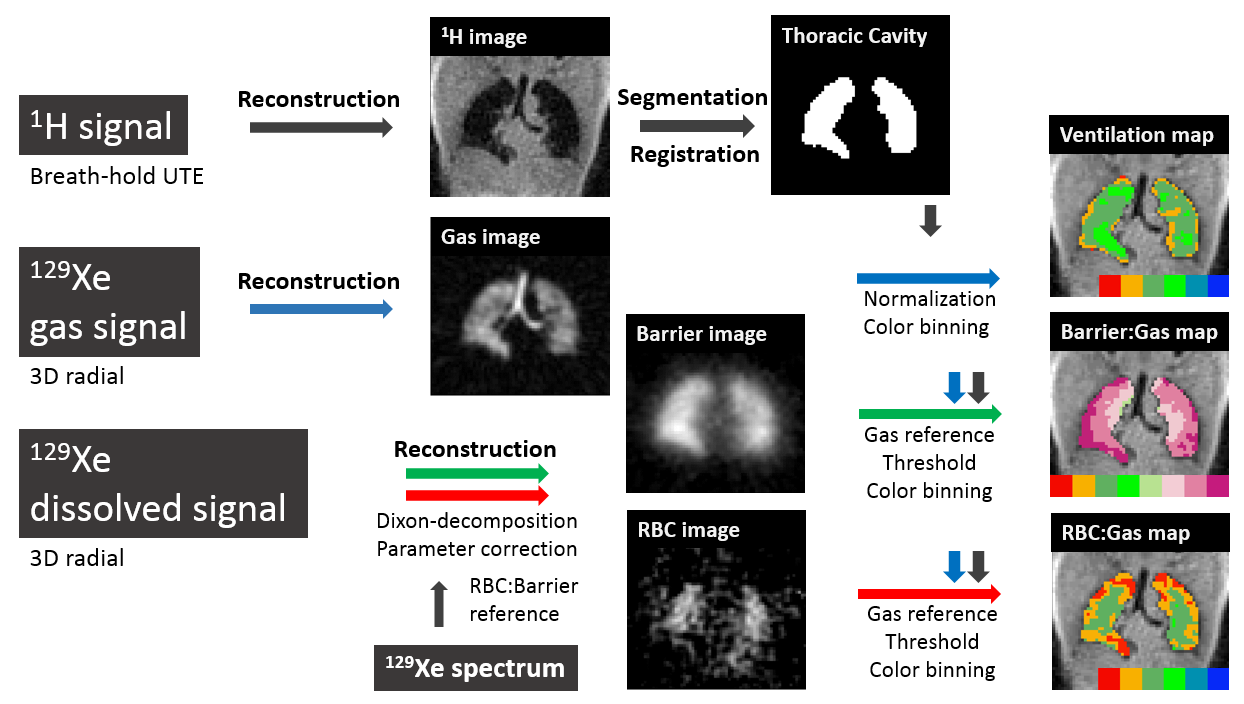
The study enrolled 13 normal subjects (Age = 43±22) used for a reference cohort, and demonstrates representative images in 2 patients with IPF, a subject having received 66 Gy therapeutic radiation, a patient with COPD caused by alpha 1 antitrypsin deficiency, an asthma patients and a patient with mild pulmonary artery hypertension (PAH). All subjects underwent single-breath 129Xe gas exchange MRI after inhaling 0.75L HP 129Xe, polarized to 16-18%. Images were obtained at 1.5 T (GE EXCITE 15M4) using an interleaved 3D radial sequence for dissolved- and gas-phase signals, with flip-angles = 0.5/22°, TR/TE = 8/0.9 ms, FOV = 40 cm3. Gas, barrier and RBC components were separated by the 1-point Dixon method4. Data were corrected for flip angle and echo time differences, after which Barrier and RBC images were divided by the gas image to produce ratio maps (Figure 1.) Gas images were normalized to their top percentile of intensities to generate a ventilation map2. To enable color binning, the histograms for all 3 maps were evaluated for the healthy reference group of 10 of 13 normal subjects who exhibited no ventilation defects. For each distribution, its mean and standard deviation (SD) were used to set thresholds for binning maps. For ventilation and RBC mapping, 6 bins were used while the barrier required 8 bins. For each subject we report the percentage of pixels falling into the lowest 2 ventilation bins - ventilation defect (VDR) and low ventilation regions (LVR); lowest 2 and highest 3 barrier bins (BarrierLow and BarrierHigh); lowest 2 and highest 2 RBC transfer bins (RBCLow and RBCHigh).Results
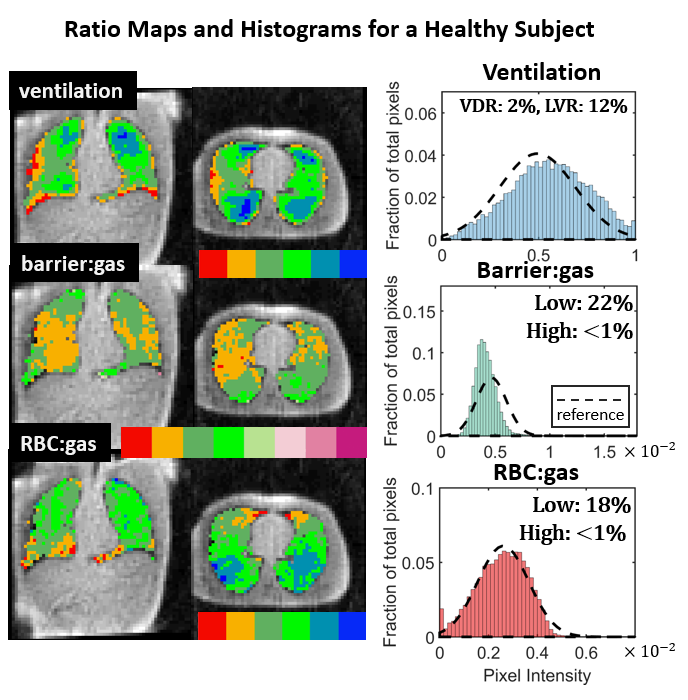
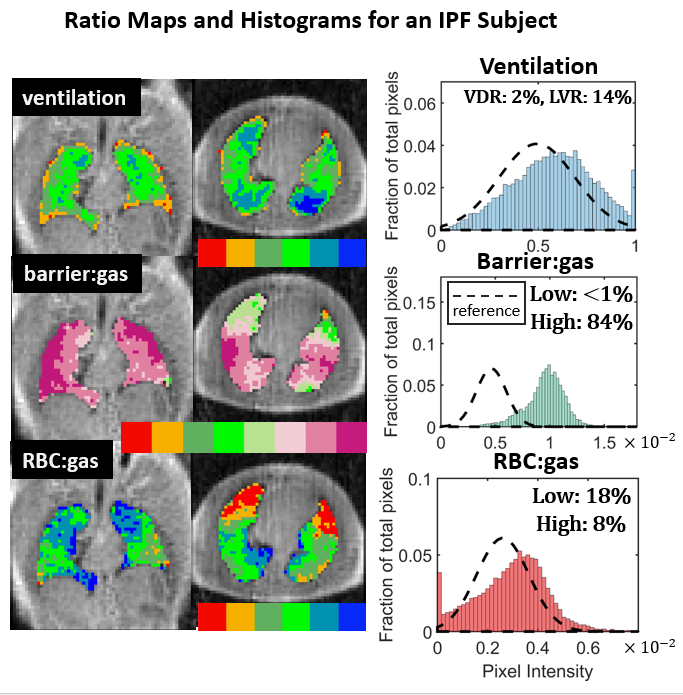
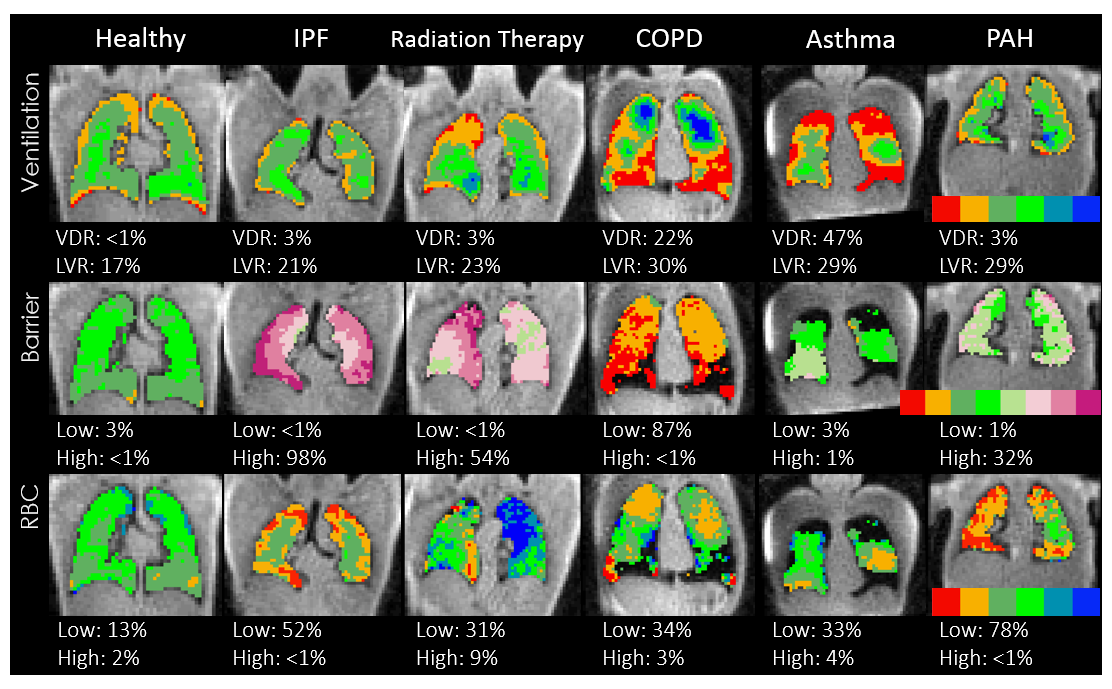
Figure 2 shows the reference histograms for each distribution, along with the color bins assigned to each intensity cluster. Figure 3 shows representative maps and histograms for a healthy subject exhibiting intensities in the normal range (green), with a slight anterior-posterior gravitational gradient in RBC transfer. Figure 4 shows maps in the same format for an IPF patient. While ventilation remains relatively normal, barrier uptake is strikingly increased. However, transfer to RBCs remains in the normal range except in the anterior lung. Figure 5 shows the application of our method to multiple pulmonary disorders. Like the IPF patient, the radiation therapy subject exhibits increased barrier ratios, but maintains higher RBC uptake. The COPD patient shows typical ventilation defects, but barrier uptake that is severely diminished. The asthmatic exhibits significant ventilation defects, but regions that remain ventilated exhibit barrier uptake in the normal range. And finally, in the PAH patient, barrier is moderately increased, but RBC transfer is dramatically reduced.Discussion
Using a healthy reference population to set binning thresholds was pivotal to generating meaningful gas exchange maps. These color images enabled key features of pulmonary function to be distinguishable across disease states. As previously reported, IPF continues to be characterized by an escalated barrier ratio, caused by interstitial tissues thickening3. Similar barrier enhancement is seen in the radiation therapy patient, likely reflecting the inflammatory stage 6 weeks after receiving ionizing radiation5. In contrast, the COPD patient in regions that were ventilated exhibited dramatically decreased barrier uptake. This is consistent with expectations based on emphysematous destruction of alveolar surface area6. By contrast, in the asthmatic, ventilation defects were the major findings7, but ventilated lung had relatively normal barrier. Finally, the PAH patient had the most dramatic loss of RBC transfer, likely caused by arterial vascular occlusions upstream of the capillary beds8.Conclusion
The ability to acquire, within a breath-hold, maps depicting ventilation, barrier integrity and RBC transfer, provides a powerful means to quantify regional pulmonary function. Preliminary evaluation of our pipeline showed that the approach is applicable to numerous pulmonary disorders, each with potentially distinguishable patterns. With further verification conducted in larger patient cohorts, this method may ultimately serve as a means to measure pulmonary disease burden and uncover its origins.Acknowledgements
R01HL126771, R01HL105643, P41 EB015897, Gilead Sciences, Duke MITPReferences
1. Kaushik, S. Sivaram, et al. "Measuring diffusion limitation with a perfusion-limited gas—hyperpolarized 129Xe gas-transfer spectroscopy in patients with idiopathic pulmonary fibrosis." Journal of Applied Physiology 117.6 (2014): 577-585.
2. Kaushik, S. Sivaram, et al. "Single-breath clinical imaging of hyperpolarized 129xe in the airspaces, barrier, and red blood cells using an interleaved 3D radial 1-point Dixon acquisition." Magnetic resonance in medicine (2015).
3. Wang, Z., et al. (2016). "Quantitative Gas Exchange using Hyperpolarized 129Xe MRI in Idiopathic Pulmonary Fibrosis." Proc. Intl. Soc. Mag. Reson. Med. 1628.
4. He, M., et al. (2016). "Differentiating Early Stage and Later Stage Idiopathic Pulmonary Fibrosis using Hyperpolarized 129Xe Ventilation MRI." Intl. Soc. Mag. Reson. Med.: 1623.
5. Movsas, Benjamin, et al. "Pulmonary radiation injury." CHEST Journal 111.4 (1997): 1061-1076.
6. Celli, Bartolome R., et al. "Standards for the diagnosis and treatment of patients with COPD: a summary of the ATS/ERS position paper." European Respiratory Journal 23.6 (2004): 932-946.
7. Bateman, ED1, et al. "Global strategy for asthma management and prevention: GINA executive summary." European Respiratory Journal 31.1 (2008): 143-178. 8. McLaughlin, Vallerie V., and Michael D. McGoon. "Pulmonary arterial hypertension." Circulation 114.13 (2006): 1417-1431.
Figures