4915
3D mapping of alveolar oxygen partial pressure with hyperpolarized 129Xe.1Radiology, Brigham and Women's Hospital, Harvard Medical School, Boston, MA, United States, 2Mirtech, Inc., Brockton, MA, United States
Synopsis
Obtaining regional alveolar pO2 is a coveted goal in pulmonary medicine, as it reflects both ventilation and perfusion. Hyperpolarized gases, mostly 3He were used to map pAO2. For 3He this is straightforward as helium is virtually insoluble in tissue. Xe, however, dissolves into tissue and blood and is carried away from the alveolar space, thus contributes to the loss of the 129Xe MRI signal. To date no attempt has been made to address this issue. Here we report a novel use of SB-XTC to measure pAO2 in vivo while simultaneously measuring and taking into account xenon gas exchange on the signal decay.
Introduction
Regional alveolar oxygen tension pAO2 is one of the most desired parameters in pulmonary medicine. It depends on both ventilation (V) and perfusion (Q); pulmonary disease is associated with deterioration of either or both; differential diagnosis requires quantifying these changes. V/Q can be measured with Nuclear Medicine techniques, but at the cost of ionizing radiation exposure. Deninger1 originally proposed a noninvasive MRI method to map pAO2 with hyperpolarized (HP) 3He, which stimulated by many others2-5. The calculation of pAO2 is based on the effect of O2 on T1 relaxation6-7. For 3He this is straightforward as helium is insoluble in tissue. Recently 129Xe has been used more in pulmonary MRI as it is naturally occurring and far cheaper. But it dissolves into tissue and blood and is carried away from the alveolar space8. This complicates T1 measurements. HPXe was used for pAO2 mapping8-12, but no attempt has been made to address this issue, mostly because only a small fraction of Xe is lost. However, this translates into a significantly larger effect on T1 calculation and thus pAO2 estimation. We have previously reported on a novel use of the single-breath xenon transfer contrast (SB-XTC)13 to measure pAO2 while simultaneously accounting for xenon uptake. Here we report on implementation of a spiral sequence to accelerate the imaging and improve the its resolution and SNR, as well as on first in vivo measurements.Methods
We have previously described pAO2 measurements14 (Figure 1). To obtain a 3D map of alveolar oxygen partial pressure we have implemented a 2D stack of spirals based on the SB-XTC approach on a Siemens 3T “Skyra” system. To map B0 and correct blurring due to off-resonance components, we collect two acquisitions with a single spiral interleave-per-partition with different TEs. We first de-blurr the data, then apply 2D off-resonance correction using linear-fit coefficients calculated from the field maps. The ventilation maps are calculated after 2D in-plane re-gridding and FT of the de-blurred k-space data15. To obtain the pAO2 maps, we followed the routine described in Figure 1. To test the sequence we measured T1 in a gas phantom using our spiral and a GRE sequences with the following parameters: TE/TR= 0.88/10ms (3.3/7.5ms) spiral(GRE), flip angle=30o(10o) spiral(GRE), FOV=25cm, data matrix 2048x5x3(32x32x3) spiral(GRE), reconstructed to 64x64x3. For both cases we corrected for the flip angle, then mapped T1 and calculated its mean. We also used simple FID’s to measure the phantom’s global T1. We compared the T1 values measured by each sequence. We mapped T1 using our spiral sequence in 4 similar bags of HPXe with 0, 15, 30 and 60 mL of air added to them, and measured their global T1 using FIDs. We estimated the expected T1 values for each of the cases. We collected an in vivo data set with a stack of spirals in ~11sec with the following parameters: FOVx=FOVy=32cm, TE/TR=0.88/12ms, 4096x10x8 data matrix reconstructed to 128x128x8. In the XTC contrast portion the parameters were Δt=2sec, tdiff1(tdiff2)=0.2(0.5)sec, N1(N2)=10(4) (Figure 1). We compared <T1> to global T1 measured using FID. Hyperpolarized xenon for all experiments was polarized using an open source polarizer XeNA16. Each polarization session produced a tedlar bag with ~ 600mL of ~30%-polarized Xe.Results and Discussion
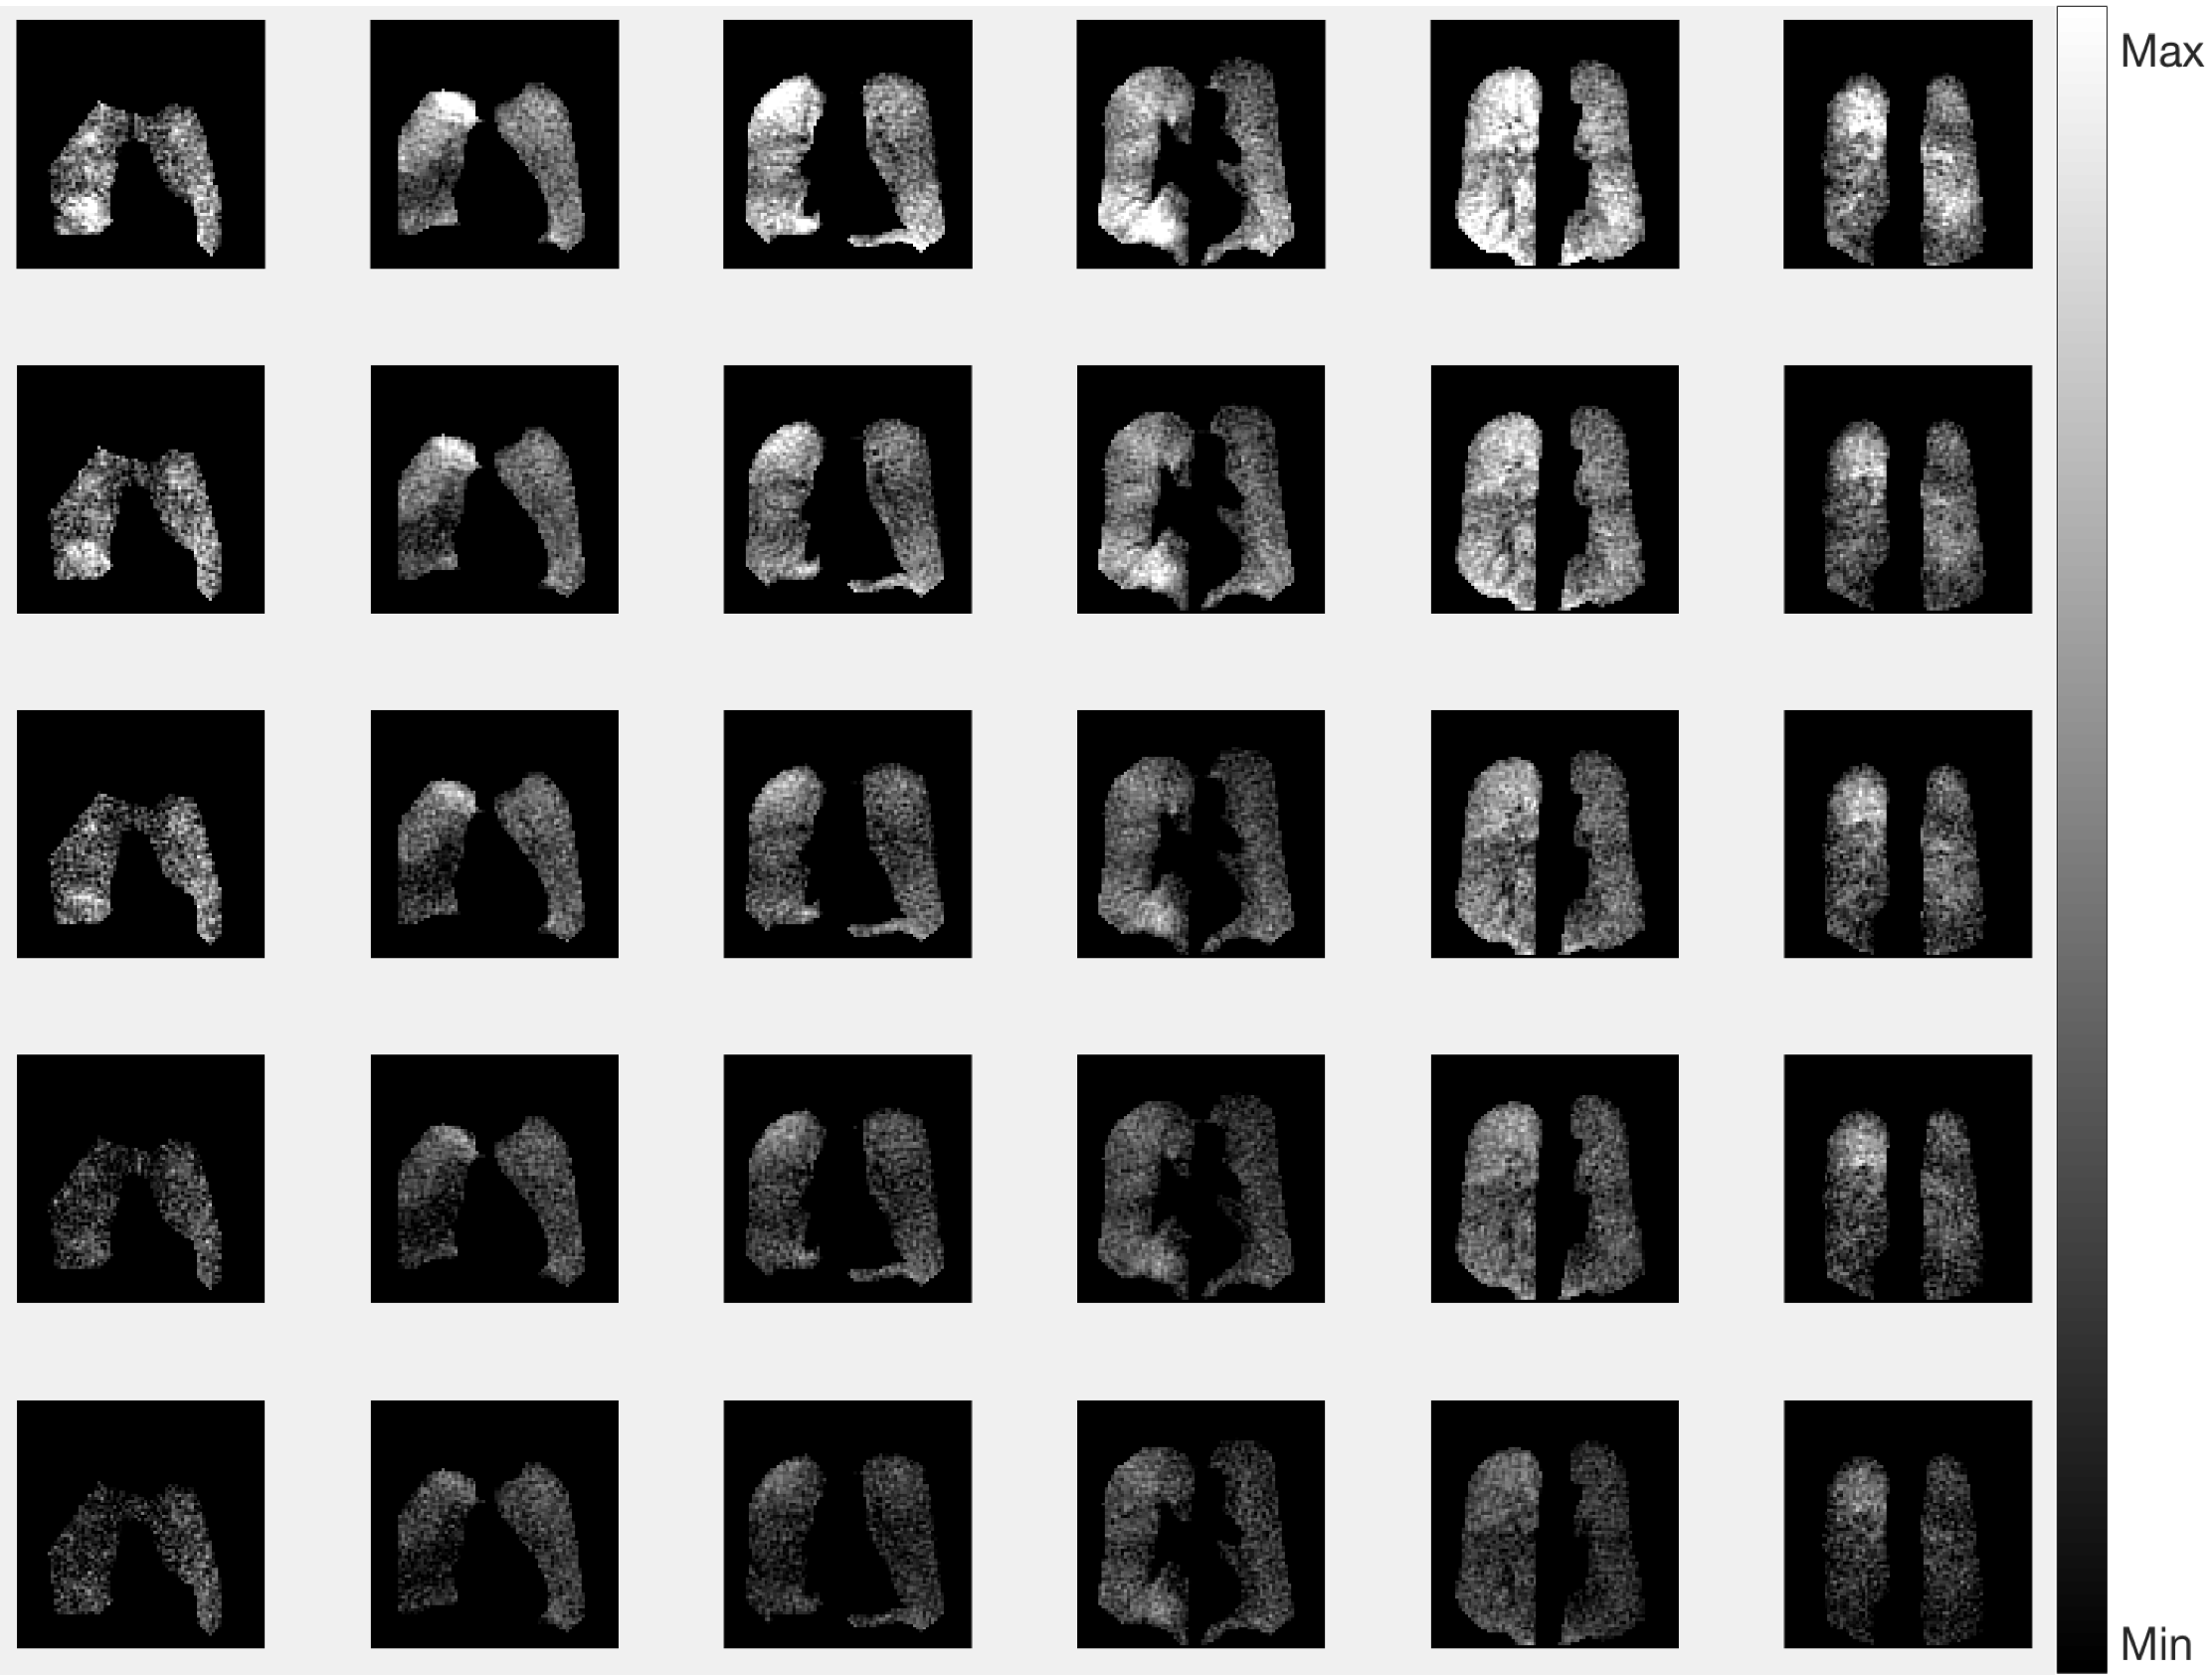
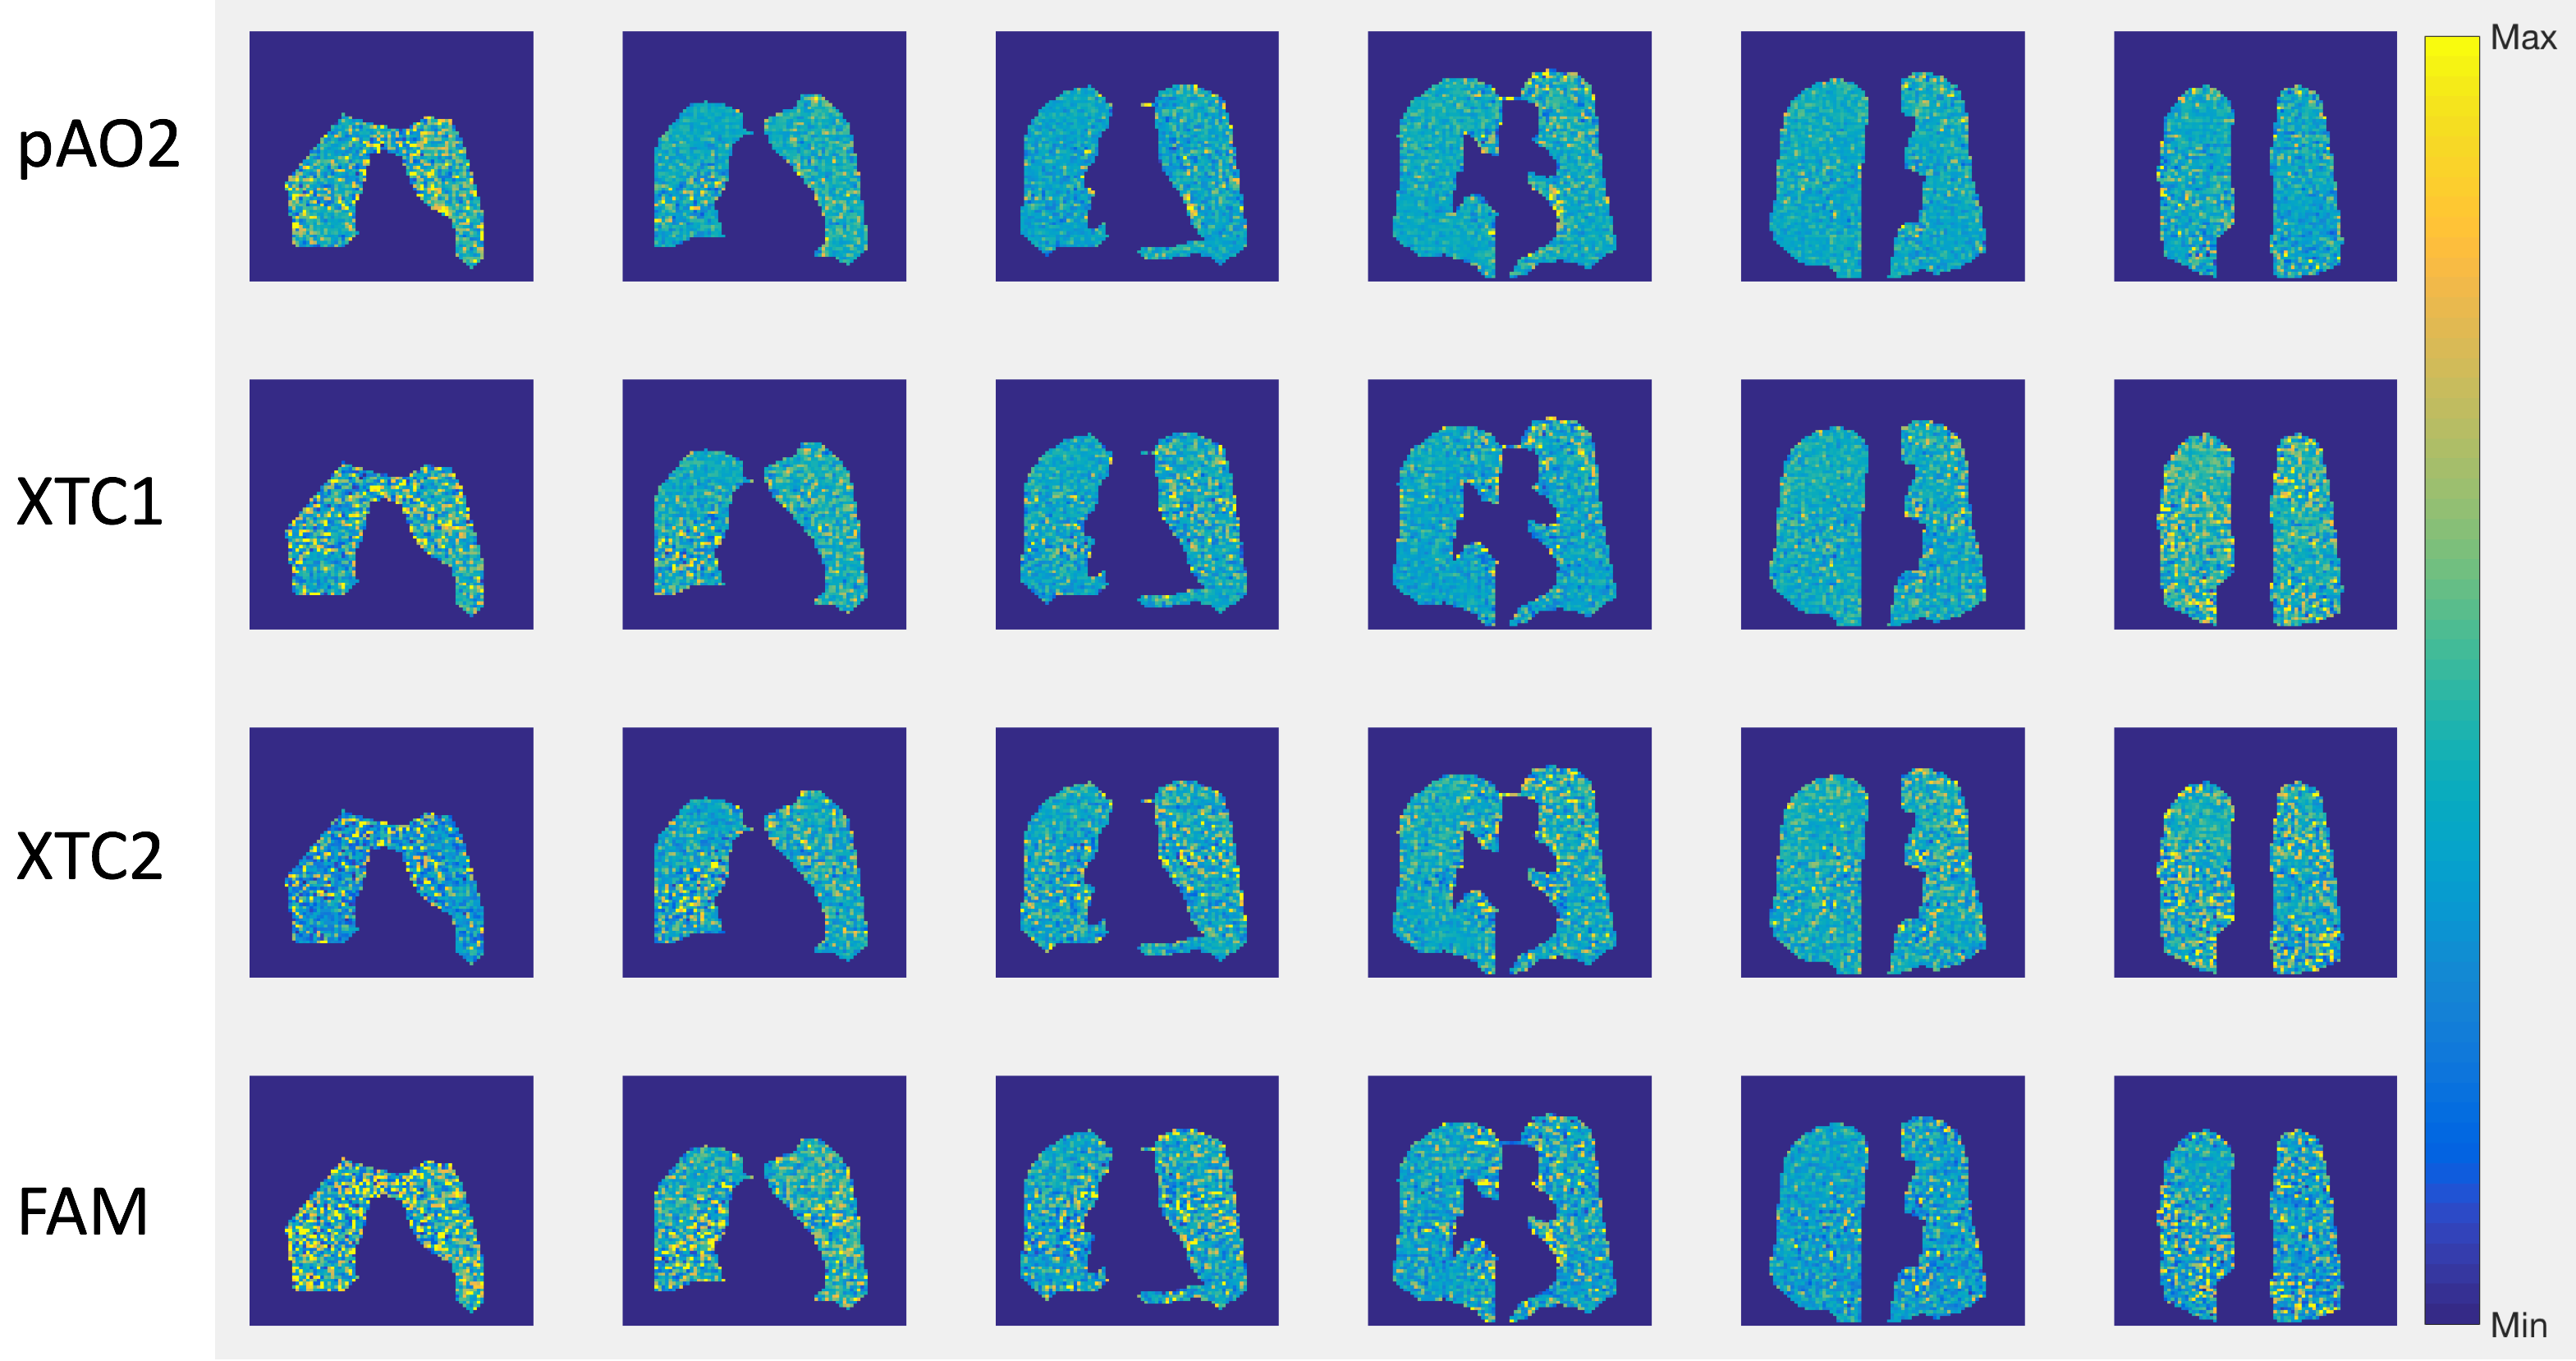
Figure 2 shows comparison between images produced by GRE and spiral sequences. More detail can be seen with the spiral sequence; both resulted in similar distributions and mean T1, which also agreed with the global measurements using FIDs: 5.2±0.57 (GRE), 4.8±0.45 (spiral), and global value of 4.5±0.32 hrs (FID). For the phantoms with 15, 30 and 60 mL of added air we measured <T1> = 9.8, 5.1 and 2 min, which agreed with the estimated (10, 5 and 2.5) and global (10.1, 5.0, 2.51) values measured with FID (Figure 3). Figure 4 shows ventilation maps collected in a healthy volunteer using our spiral pAO2 sequence: we observed measureable signal in 6 of 8 slices. The mean SNR in the ventilation maps ranged from ~10 in the 1st image to ~4 in the 5th one. Using F(200ms) and F(500ms) we extrapolated to estimate F(2sec), then mapped T1 and pAO2. Mean T1 = 20.3±9.8 sec, corresponding mean pAO2 = 106.4±57.2 Torr. Although the presented data obtained with the spiral-pAO2 approach is promising, an improved SNR is desired for more sensitive measurements. We plan to address this by mapping the flip angle in a separate acquisition. If this does not provide enough improvement, we will divide the sequence into two separate breath-holds. Of course, then one has to implement a registration routine.Acknowledgements
NIH 1R21HL132278-01A1 and NIH 1R01HL122372-01A1References
1 Deninger, et al. NMR in Biomed. 2000,13(4):194;
2 Fischer, et al. Acad.Rad. 2005,12(11):1430;
3 Wild, et al. MRM, 2005.53(5):1055;
4 Miller, et al., MRM,2010.63(1):127;
5 Hamedani, et al., MRM,2013;
6 Jameson, et al. J Chem Phys,1988, 89(7): 4074;
7 Saam, et al. Phys Rev A, 1995, 52(1): 862;
8 Patz, et al. E J Rad, 2007, 64(3): 335;
9 Hrovat, et al. ISMRM 2006.
10 Dabaghyan, et al. ISMRM 2010.
11 Miller, et al. ISMRM 2010, 2558.
12 Miller, et al. ISMRM 2013, 1448.
13 Muradyan, et al. JMRI, 2012. 37(2): 457.
14 Muradyan et al. ISMRM 2015
15 Chen and Meyer ISMRM 2006, 2966.
16 Patz, et al. NJPhys, 2011. 13:015009.
17 Nikolaou et al. PNAS, 2013, 110(35), 14150–14155.
Figures
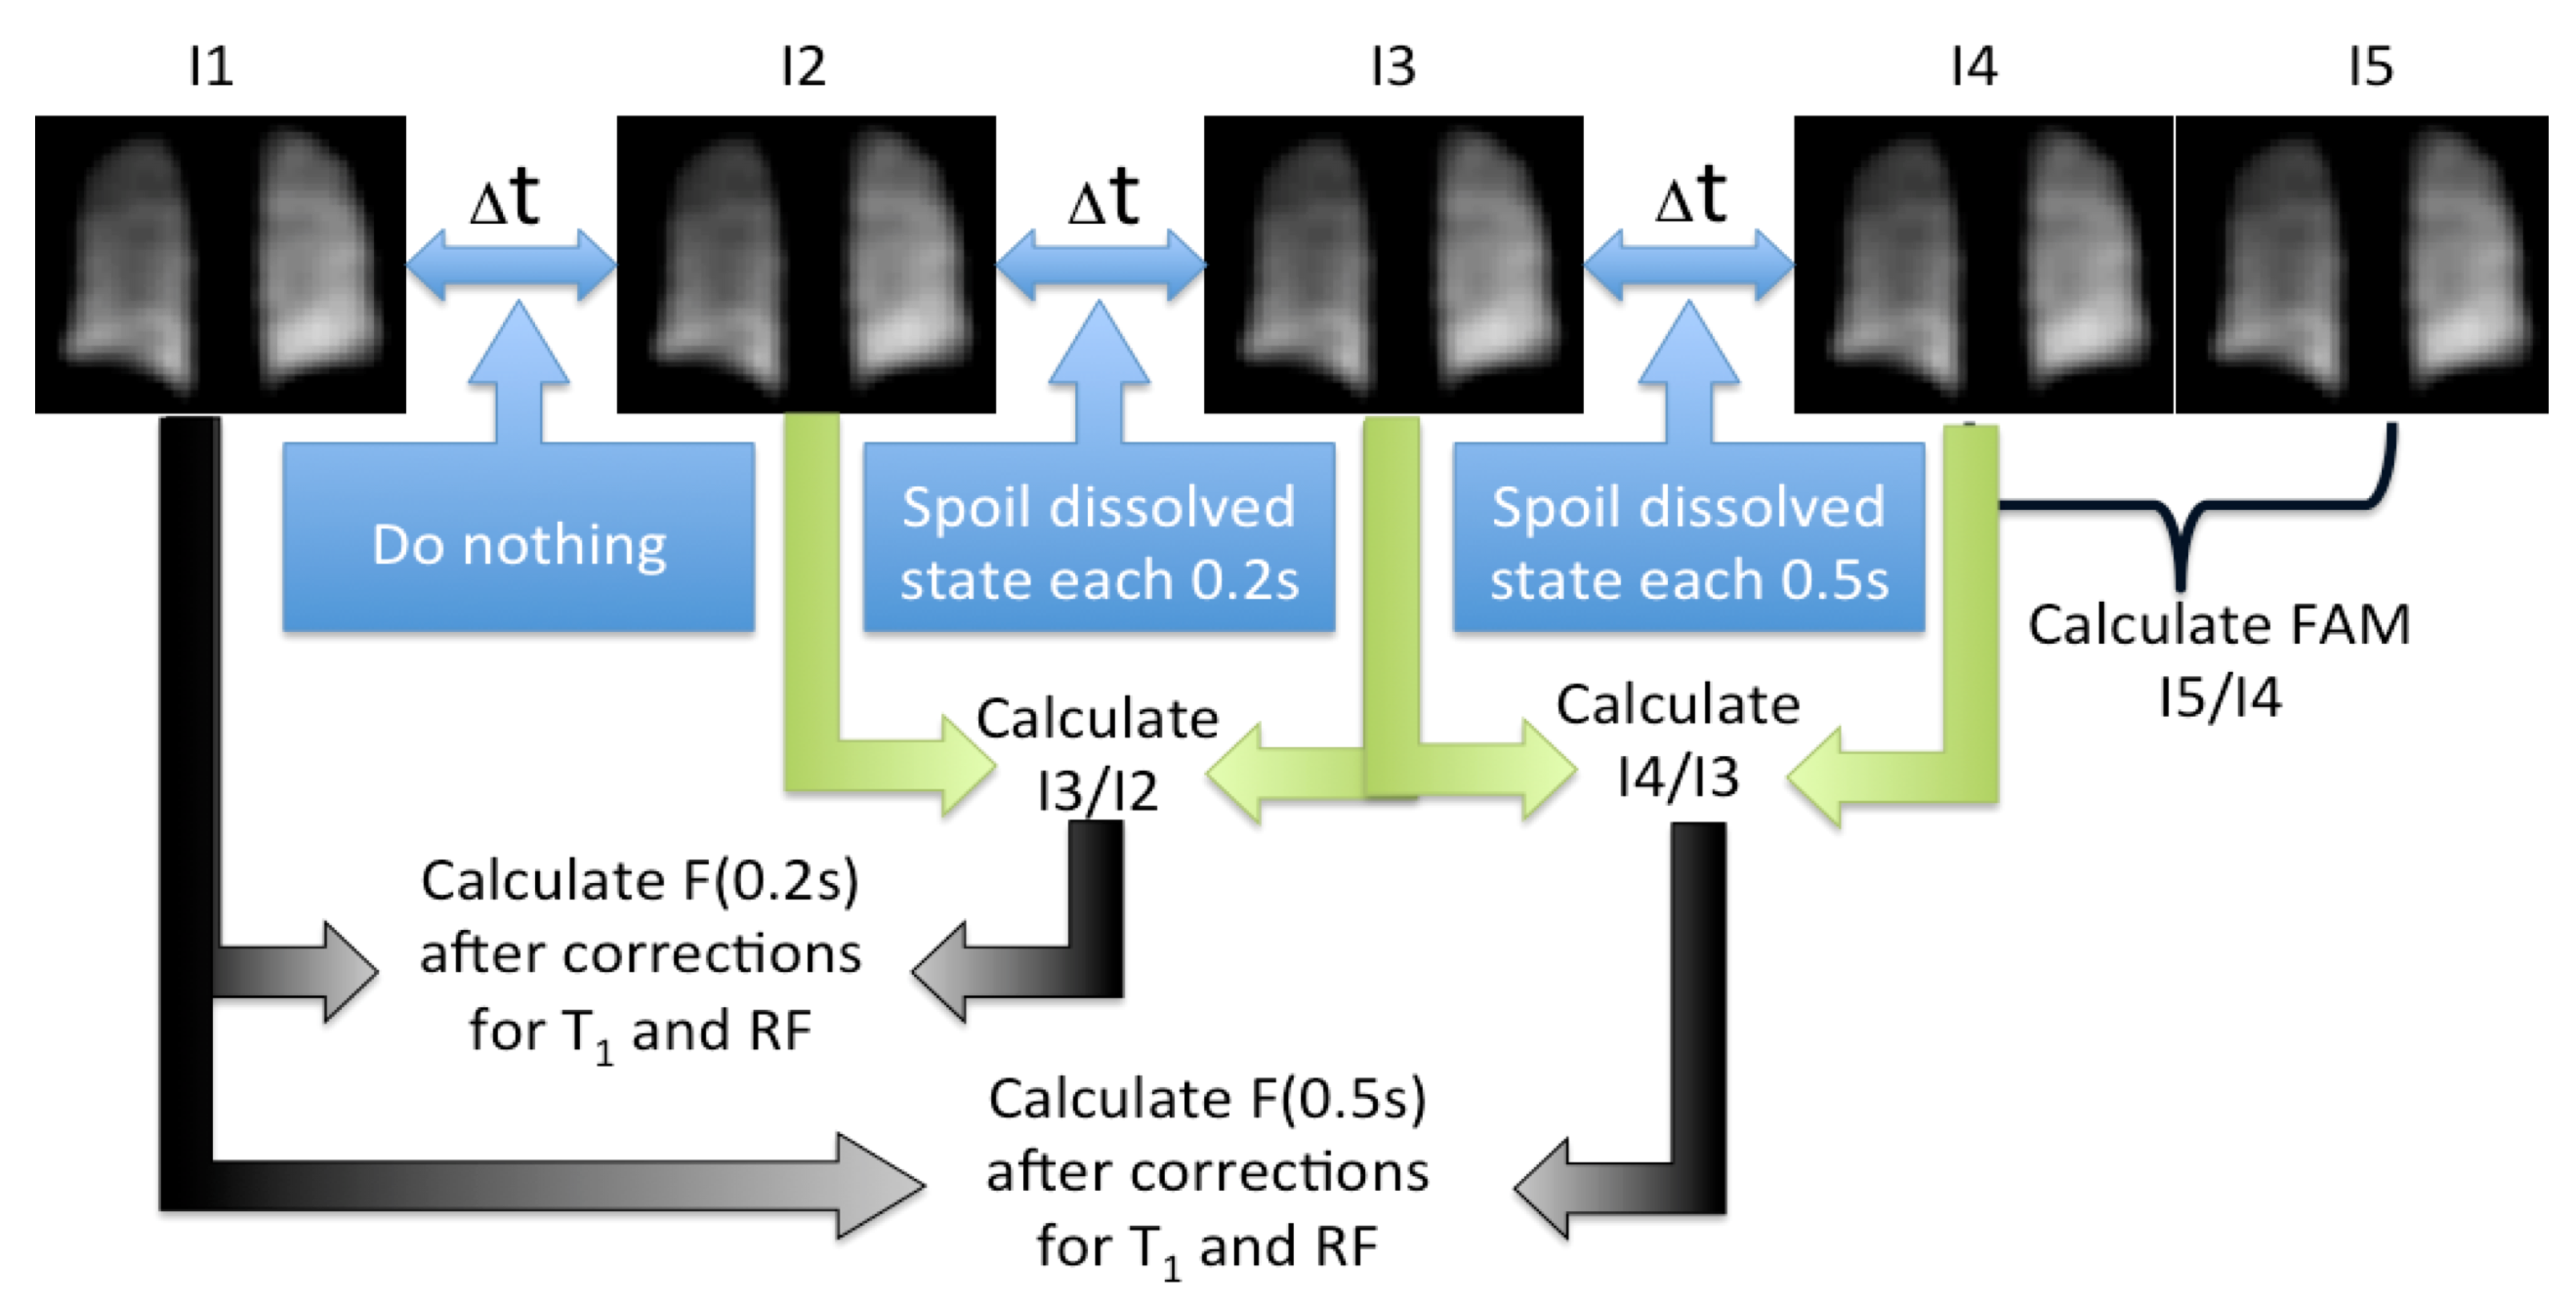
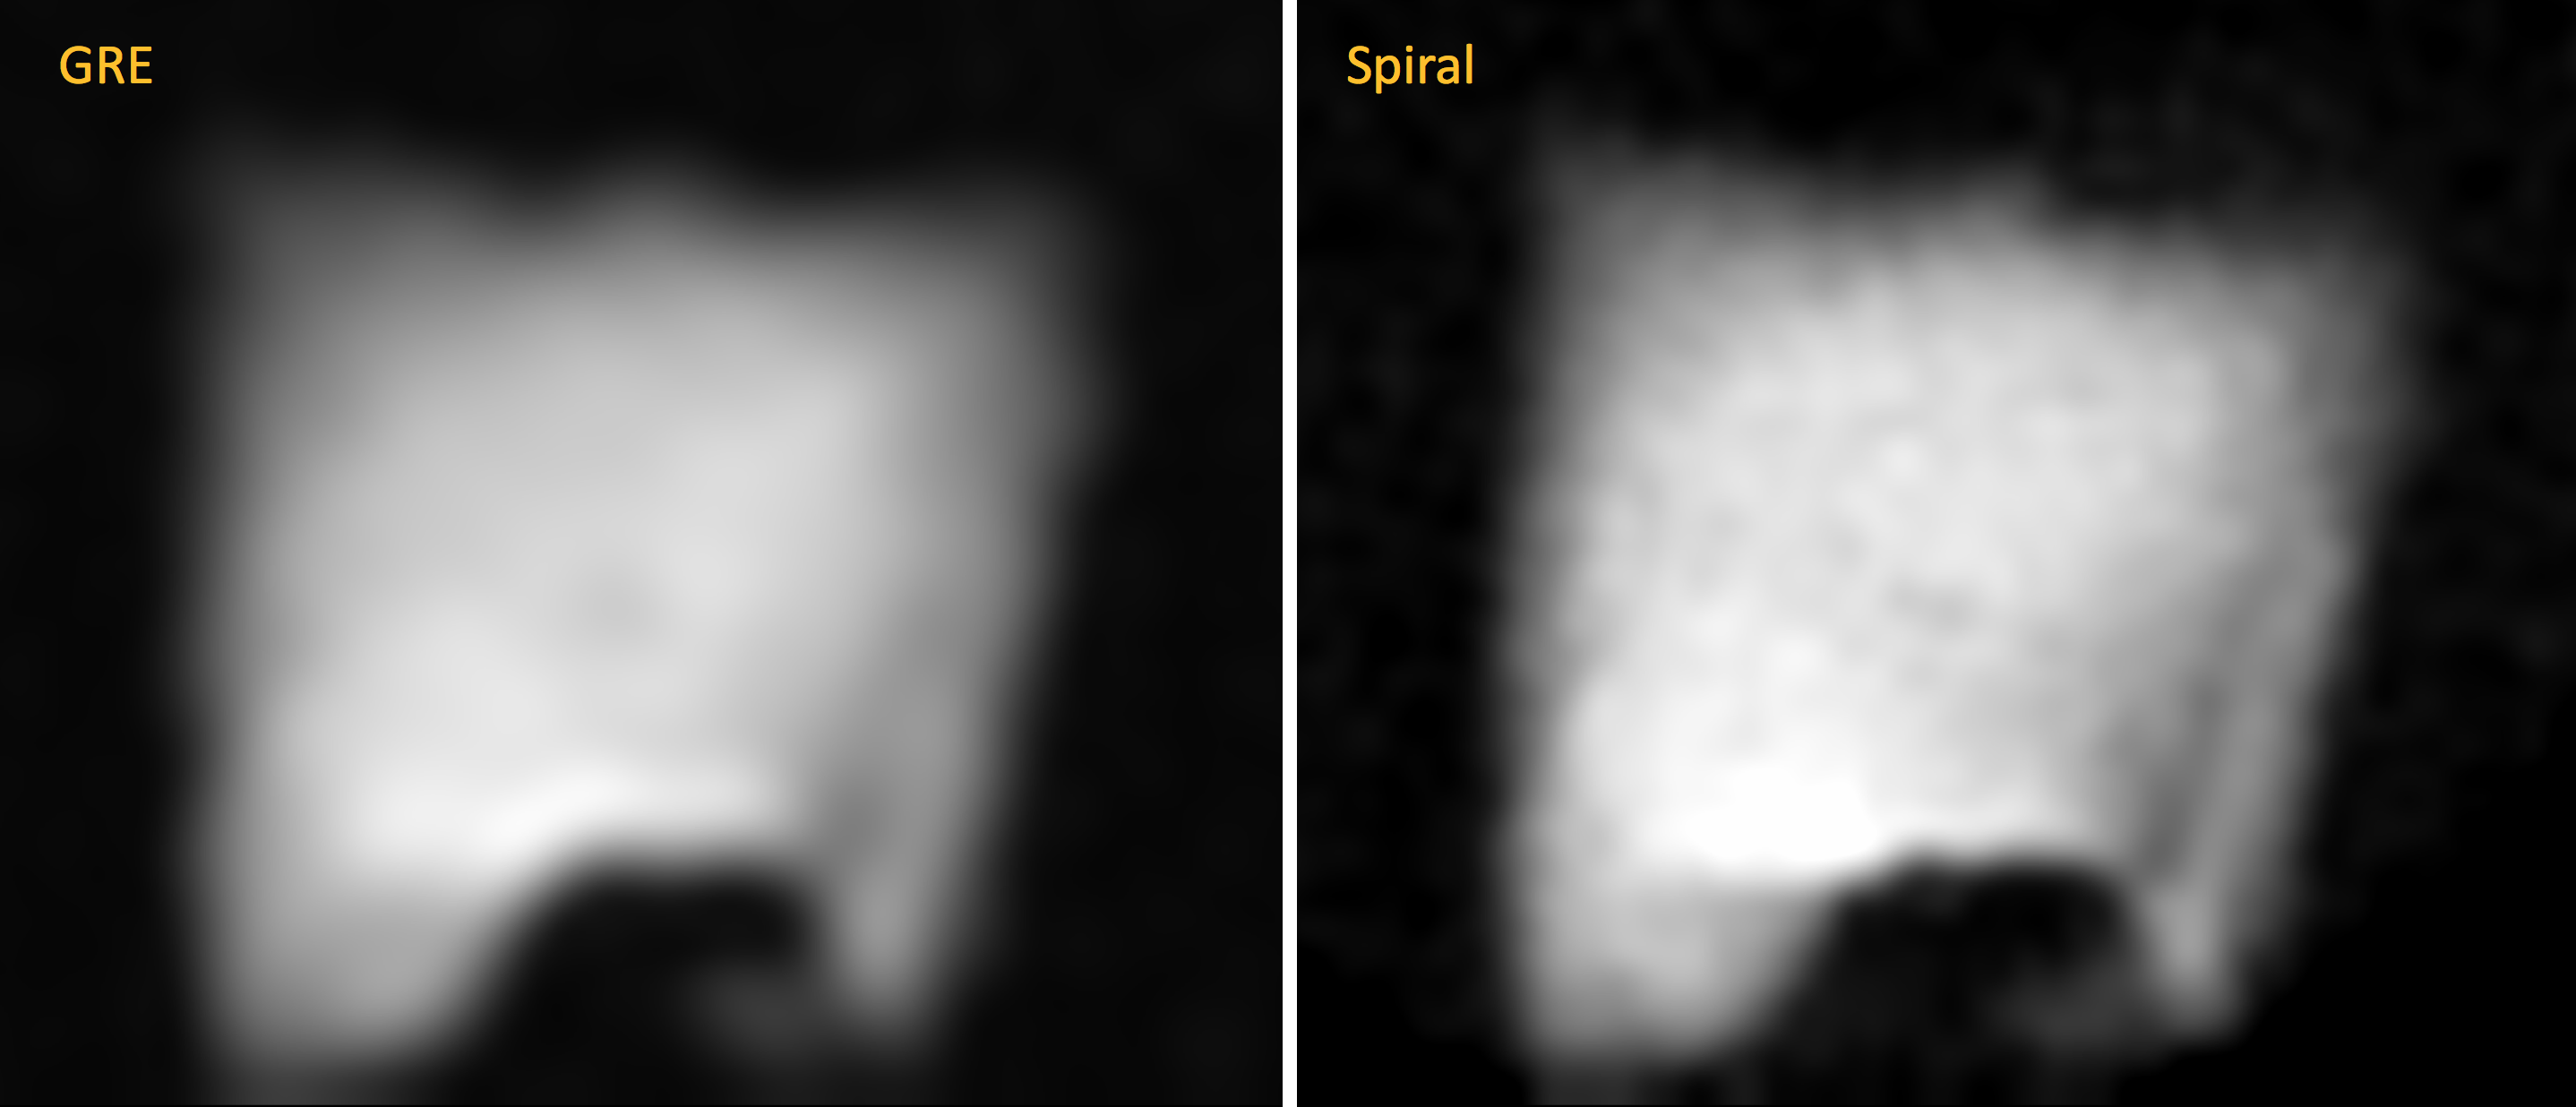
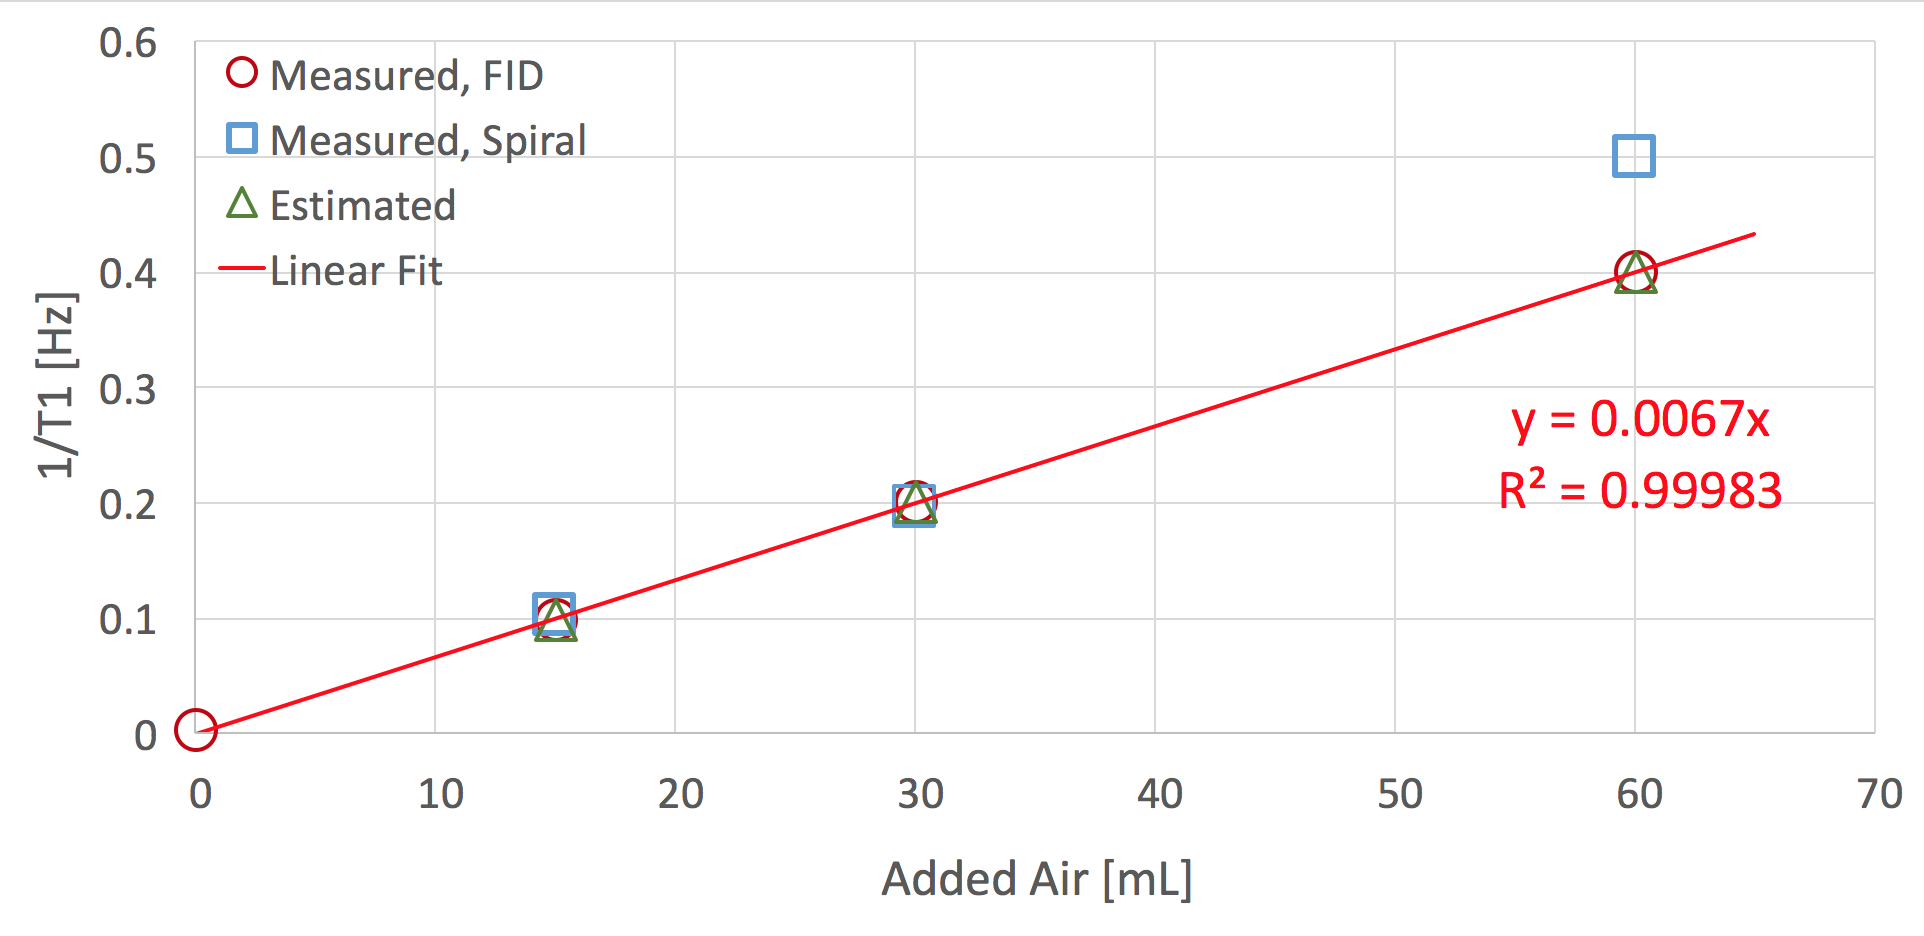
Figure 3. Relaxation rate (1/T1) of HPXe measured in tedlar bags after adding 0, 15, 30 and 60 mL of air. All four bags were prepared in a similar manner: the bags were evacuated to 15 mTorr before transfer of the HPXe from the polarizer's cell; the polarizer cell is always filled to the same pressure, thus the same volume of polarized gas is transferred every run. We did not account for the volume changes in the bags after adding the air (this could potentially affect the T1, but would probably be a minor effect).