4911
Detecting Differences in Parenchymal and Vascular Oxygenation in the Lungs with Quantitative Susceptibility Mapping1Center for Pulmonary Imaging Research, Cincinnati Children's Hospital Medical Center, Cincinnati, OH, United States, 2Biomedical Engineering, University of Cincinnati, Cincinnati, OH, United States, 3Department of Physics, Washington University, Saint Louis, MO, United States, 4Electrical Engineering and Computer Sciences, University of California -Berkeley, Berkeley, CA, United States
Synopsis
Quantitative susceptibility (QSM) mapping measures the spatial distribution of magnetic susceptibility, and is thus sensitive to the chemical and microstructure properties of tissues. Here we have combined QSM with multi-echo, radial ultra-short echo-time (UTE) MRI to assess regional variations in lung susceptibility in mice. We demonstrate QSM can differentiate between lung parenchyma, which is paramagnetic due to the presence of molecular O2 and pulmonary vasculature which is diamagnetic. Moreover, we demonstrated that the susceptibility differences between these two lung regions increases with increased oxygen partial pressure, demonstrating the approach’s sensitivity to regional pulmonary function.
Introduction
Quantitative susceptibility mapping (QSM) is an MRI-based technique that measures the spatial distribution of magnetic susceptibility, thus providing novel information about the molecular and microstructural composition of biological tissues. Although much QSM work as focused on studies of the brain, there is increasing interest in applying this technique other body parts including kidney, spine, liver, vasculature 1, and more recently the lungs2,3. In the lungs, magnetic susceptibilities differences are generated by the differences in blood oxygenation, the presence of gas-tissue interfaces at the alveolar surface, and variations in oxygen partial pressure4, 5. Here we demonstrate that QSM mapping of the lungs in vivo is sensitive to variations in pulmonary structure and function. Specifically, we demonstrate that QSM can detect significant magnetic susceptibility differences between the pulmonary vasculature and lung parenchyma and that these difference increase when O2 concentration is increased due to both increased O2 partial pressure and increased blood oxygenation in the pulmonary vessels.Methods
Animals: Six adult C57BL/6 mice (~25g) were anesthetized with isoflurane mixed with medical grade air (20% O2) then and then with 100% O2. A pressure pad monitored respiratory motion; while body temperature was maintained at ~36°C with flowing warm air (SAI Inc).
MRI: Using a 7T Bruker Biospec system and a home-built quadrature birdcage coil, respiratory-gated images were collected at end-expiration using an RF-spoiled, 3D short multi-echo radial6 sequence with interleaved golden-angle trajectories Acquisition parameters prescribed for each of the imaging conditions (100% or 25 % O2) included: radial views=51472; TR=9 ms; TEs=80, 200, 300, 400 and 500 μs; BW=278 kHz, FOV=40×40×60 mm3, matrix=128×128×128, resolution=313×313×469 μm3.
Reconstruction and QSM: The k-space data were reconstructed and re-gridded using an iterative algorithm 6, 7, 8, and image phase was calculated using Laplacian-based phase unwrapping and background phase removal algorithm called V-SHARP 9.The reconstruction algorithm STAR-QSM was used to invert the tissue phase 10. Finally, the QSM maps obtained from each of the echoes were linearly summed to enhance susceptibility SNR.
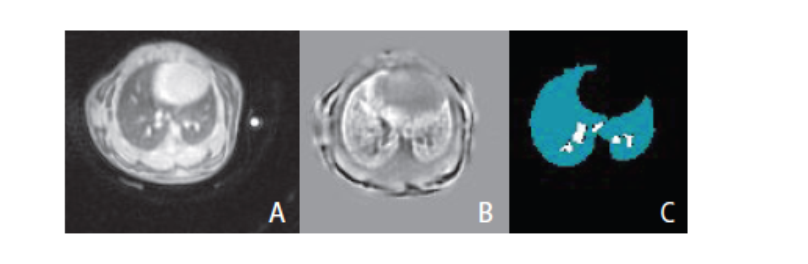
Image Analysis: Amira software was used to manually segment the lung volume from thoracic cavity, and segment the parenchyma from the vasculature using seeded region-growing (Figure 1). An ROI in the skeletal muscle was used to provide reference susceptibility. All segmentation was performed on 500-μs TE magnitude images. To minimize partial volume effects, parenchymal and vascular masks were subjects to morphological erosion using a 4-pixel-diameter structuring element, and only data within these eroded masks were used in subsequent data processing. All measurements were made in MATLAB and statistical testing (paired t-testing) was performed in R.
Results and Discussion
Consistent with previous observations2, 3, positive susceptibility signal was observed from the lungs relative to surrounding tissues. Within the lung volume, however, significant differences were observed between the parenchyma and pulmonary vasculature (p < 0.001), with the mean volume in the parenchyma being paramagnetic (1.3 ppm) and the mean in the vasculature being diamagnetic (- 0.8 ppm). The whole-lung mean susceptibility signal increased by ~10% (0.13 ppm) when animals breathed 100% O2 rather than air. Additionally, the susceptibility difference between parenchyma and vasculature increased when animals breathed 100% O2 (p = 0.003, Figure 2), due to increased paramagnetic O2 content in the pulmonary airspaces and a shift from paramagnetic deoxyhemoglobin to diamagnetic oxyhemoglobin in the blood.
We have demonstrated that QSM using radial UTE MRI is able to distinguish the paramagnetic pulmonary parenchyma from the adjacent, diamagnetic pulmonary vasculature and from non-pulmonary tissues outside the lungs. Additionally, we have demonstrated that the susceptibility differences observed between vessels and parenchyma increase with increasing oxygen partial pressure. This suggests that lung QSM has potential to quantify fundamental aspects of pulmonary physiology (e.g., blood oxygenation efficiency and regional ventilation-perfusion matching) and to be used in contrast-free pulmonary angiography applications.
Conclusion
QSM mapping of the lung is sensitive to fundamental aspects of lung function. As such, it has the potential to become a powerful tool for studying a wide range of pulmonary diseases, such as idiopathic pulmonary fibrosis, where lung structure and function are pathologically altered. Moreover, because QSM provides this sensitivity without the need for exogenous contrast agents such as fluorinated or hyperpolarized gases, it has high potential for wide-spread clinical translation.Acknowledgements
We would like to thank Richard Scott Dunn for technical assistance during the experiments. Funding from the following is greatly appreciated: NIH/NHLBI R00-HL-111217-03 and the Cincinnati Children’s Hospital Medical Center, Trustee Award & Procter Scholar (TAPS) Program.References
1. Haacke, E. Mark, et al. "Quantitative susceptibility mapping: current status and future directions." Magnetic resonance imaging 33.1 (2015): 1-25.
2. Zackary I. Cleveland, Jinbang Guo, Teckla Akinyi, Hongjiang Wei, S. Sivaram Kaushik, Jason C. Woods, Chunlei Liu, Vivian S. Lee, and Luke Xie. “Quantitative Susceptibility Mapping of the Lungs with Multi-echo Radial MRI: Sensitivity to Pulmonary O2 Content” Proceedings ISMRM 2016.
3. Hongjiang Wei, Luke Xie, Yuyao, Zhang, and Chunlei Liu. “High-Resolution Quantitative Susceptibility Mapping of Free-Breathing Human Lung” Proceedings ISMRM 2016.
4. Chen XJ, Moller HE, Chawla MS, et al., Spatially resolved measurements of hyperpolarized gas properties in the lung in vivo. Part II: T2*. Magnet Reson Med 1999;42(4):729-737.
5. Ohno Y, Koyama H, Yoshikawa T, et al., T2* Measurements of 3-T MRI with Ultrashort TEs: Capabilities of Pulmonary Function Assessment and Clinical Stage Classification in Smokers. Am J Roentgenol 2011;197(2):W279-W285.
6. Xie L, Layton AT, Wang N, et al., Dynamic contrast-enhanced quantitative susceptibility mapping with ultrashort echo time MRI for evaluating renal function. Am J Physiol Renal Physiol 2015: doi: 10.1152/ajprenal.00351.2015.
7. Zwart NR, Johnson KO, Pipe JG. Efficient sample density estimation by combining gridding and an optimized kernel. Magnet Reson Med 2012;67(3):701-710.
8. Johnson KO, Pipe JG. Convolution Kernel Design and Efficient Algorithm for Sampling Density Correction. Magnet Reson Med 2009;61(2):439-447.
9. Li W, Wu B, Liu C. Quantitative susceptibility mapping of human brain reflects spatial variation in tissue composition. NeuroImage 2011;55(4):1645-1656.
10. Wei H, Dibb R, Zhou Y, Sun Y, Xu J, Wang N, Liu C. Streaking artifact reduction for quantitative susceptibility mapping of sources with large dynamic range. NMR Biomed 2015;28(10):1294-1303.
Figures